The Issues page in Traceable is your central command center for monitoring API risks. If you are responsible for the organization’s API security, log in to Traceable and navigate to the Issues page. This page serves as a hub where all potential vulnerabilities, risky patterns, and compliance gaps are identified through discovery across various sources.
.png)
Issues
What will you Learn from this Topic?
By the end of this topic, you will be able to:
Understand what Issues are and how Traceable detects and displays them.
Understand the Issue life-cycle, from discovery to remediation and monitoring.
Understand the key components such as:
Visual charts for severity and status trends
Issue listings with column-level information
Grouping and Filtering options to organize and prioritize issues effectively
If you already have an understanding of these components and want to learn how you can drill down and manage an issue, see Issue Management.
What are Issues and How does Traceable Identify Them?
Issues are security gaps in your API definition that threat actors may exploit to attack your API infrastructure. Traceable identifies assets, API endpoints, and services in your environment through the discovery process. After Traceable discovers the API endpoints, it scans the APIs and their associated services for issues and displays them on the Issues page.
Note
Traceable does not scan APIs for issues during the learning phase.
How is the Issues Page Helpful?
The Issues page offers a streamlined and intuitive experience to help you identify issues, understand them in depth, conduct a risk assessment, and resolve them efficiently. Even after you resolve an issue, Traceable continuously monitors the API endpoints that you have remediated and secured. It reports an issue if it finds any in the future; therefore, continuous monitoring is necessary. For more information, see Journey of an Issue.
Whether you are a security engineer, developer, or DevOps lead, Traceable gives you the visibility and control to secure your APIs effectively.
Journey of an Issue
Every security story in Traceable begins with an API and is mapped through an issue lifecycle. The issue-management lifecycle process helps identify and remediate security risks before threat actors can exploit them.
.png)
Issue Management Life Cycle
Following is the life cycle and how issues flow within it:
Stage | Description |
|---|---|
Discovery (Identify API Endpoints) | API Identification via live traffic or integrations. |
Scan (Issue Scan) | Scans your identified APIs to detect potential vulnerabilities. |
Analysis (Risk Assessment) | You analyze the issue, including what it is, where it occurred, and the associated risks. |
Remediation | You act on the issue: fix it, mark it under review, accept the risk, or dismiss it. |
Monitoring (Verification and Monitoring) | Traceable verifies the remediation on the APIs, tracks its reoccurrence, and reopens it, if necessary. |
This feedback loop ensures that you are always working with relevant, current, and actionable security information and issues.
Understanding Issues
The Issues page is a centralized hub for visualizing all vulnerabilities detected in both External and Internal APIs. It provides a comprehensive overview of open issues, including their severity and key details such as the last time they were seen. This dashboard provides a clear snapshot of your system’s security risks, helping you investigate and prioritize their resolution efficiently. To view the Issues page, navigate to Discovery → API Risk → Issues.
For information on how to drill down into an issue, manage its status, and remediate it, as well as the rules surrounding resolution and deletion, see Issue Management.
Issue Types
Traceable, based on its continuous learning, detects the following types of issues:
Category | Issue Type |
|---|---|
Insecure Design |
|
Remote Code Execution |
|
Security Headers |
|
Authentication |
|
SQL Injection |
|
Data Exposure |
|
JSON Web Token (JWT) |
|
Improper asset management |
|
Business logic |
|
Security misconfiguration |
|
Access control |
|
TLS |
|
Authorization |
|
Cross-site scripting |
|
Server-side request forgery |
|
Issue Sources
The Issues page displays issues discovered during runtime protection, API security testing (AST), or detected by an Issue policy. These three different categories of issues are based on different sources:
Live Traffic
AST
Compliance
Conformance Analysis
Issue Severity
Traceable categorizes detected issues based on their criticality and impact on your application ecosystem. The following are the categories in descending order of severity:
Critical — Represents issues that pose the highest risk and require immediate remediation to prevent significant security breaches.
High — Represents issues that may expose sensitive data or compromise system integrity if not addressed promptly.
Medium — Represents moderate risks that may not be immediately exploitable but can still weaken security over time.
Low — Represents minor issues with limited impact, and are often resolved during routine maintenance.
Informational — Represents issues that do not pose a security risk, but provide context, such as configuration details, exposed metadata, and usage patterns.
Key Components
The page contains key components that help you quickly assess and understand issues. Below are the main elements of the page and their significance:
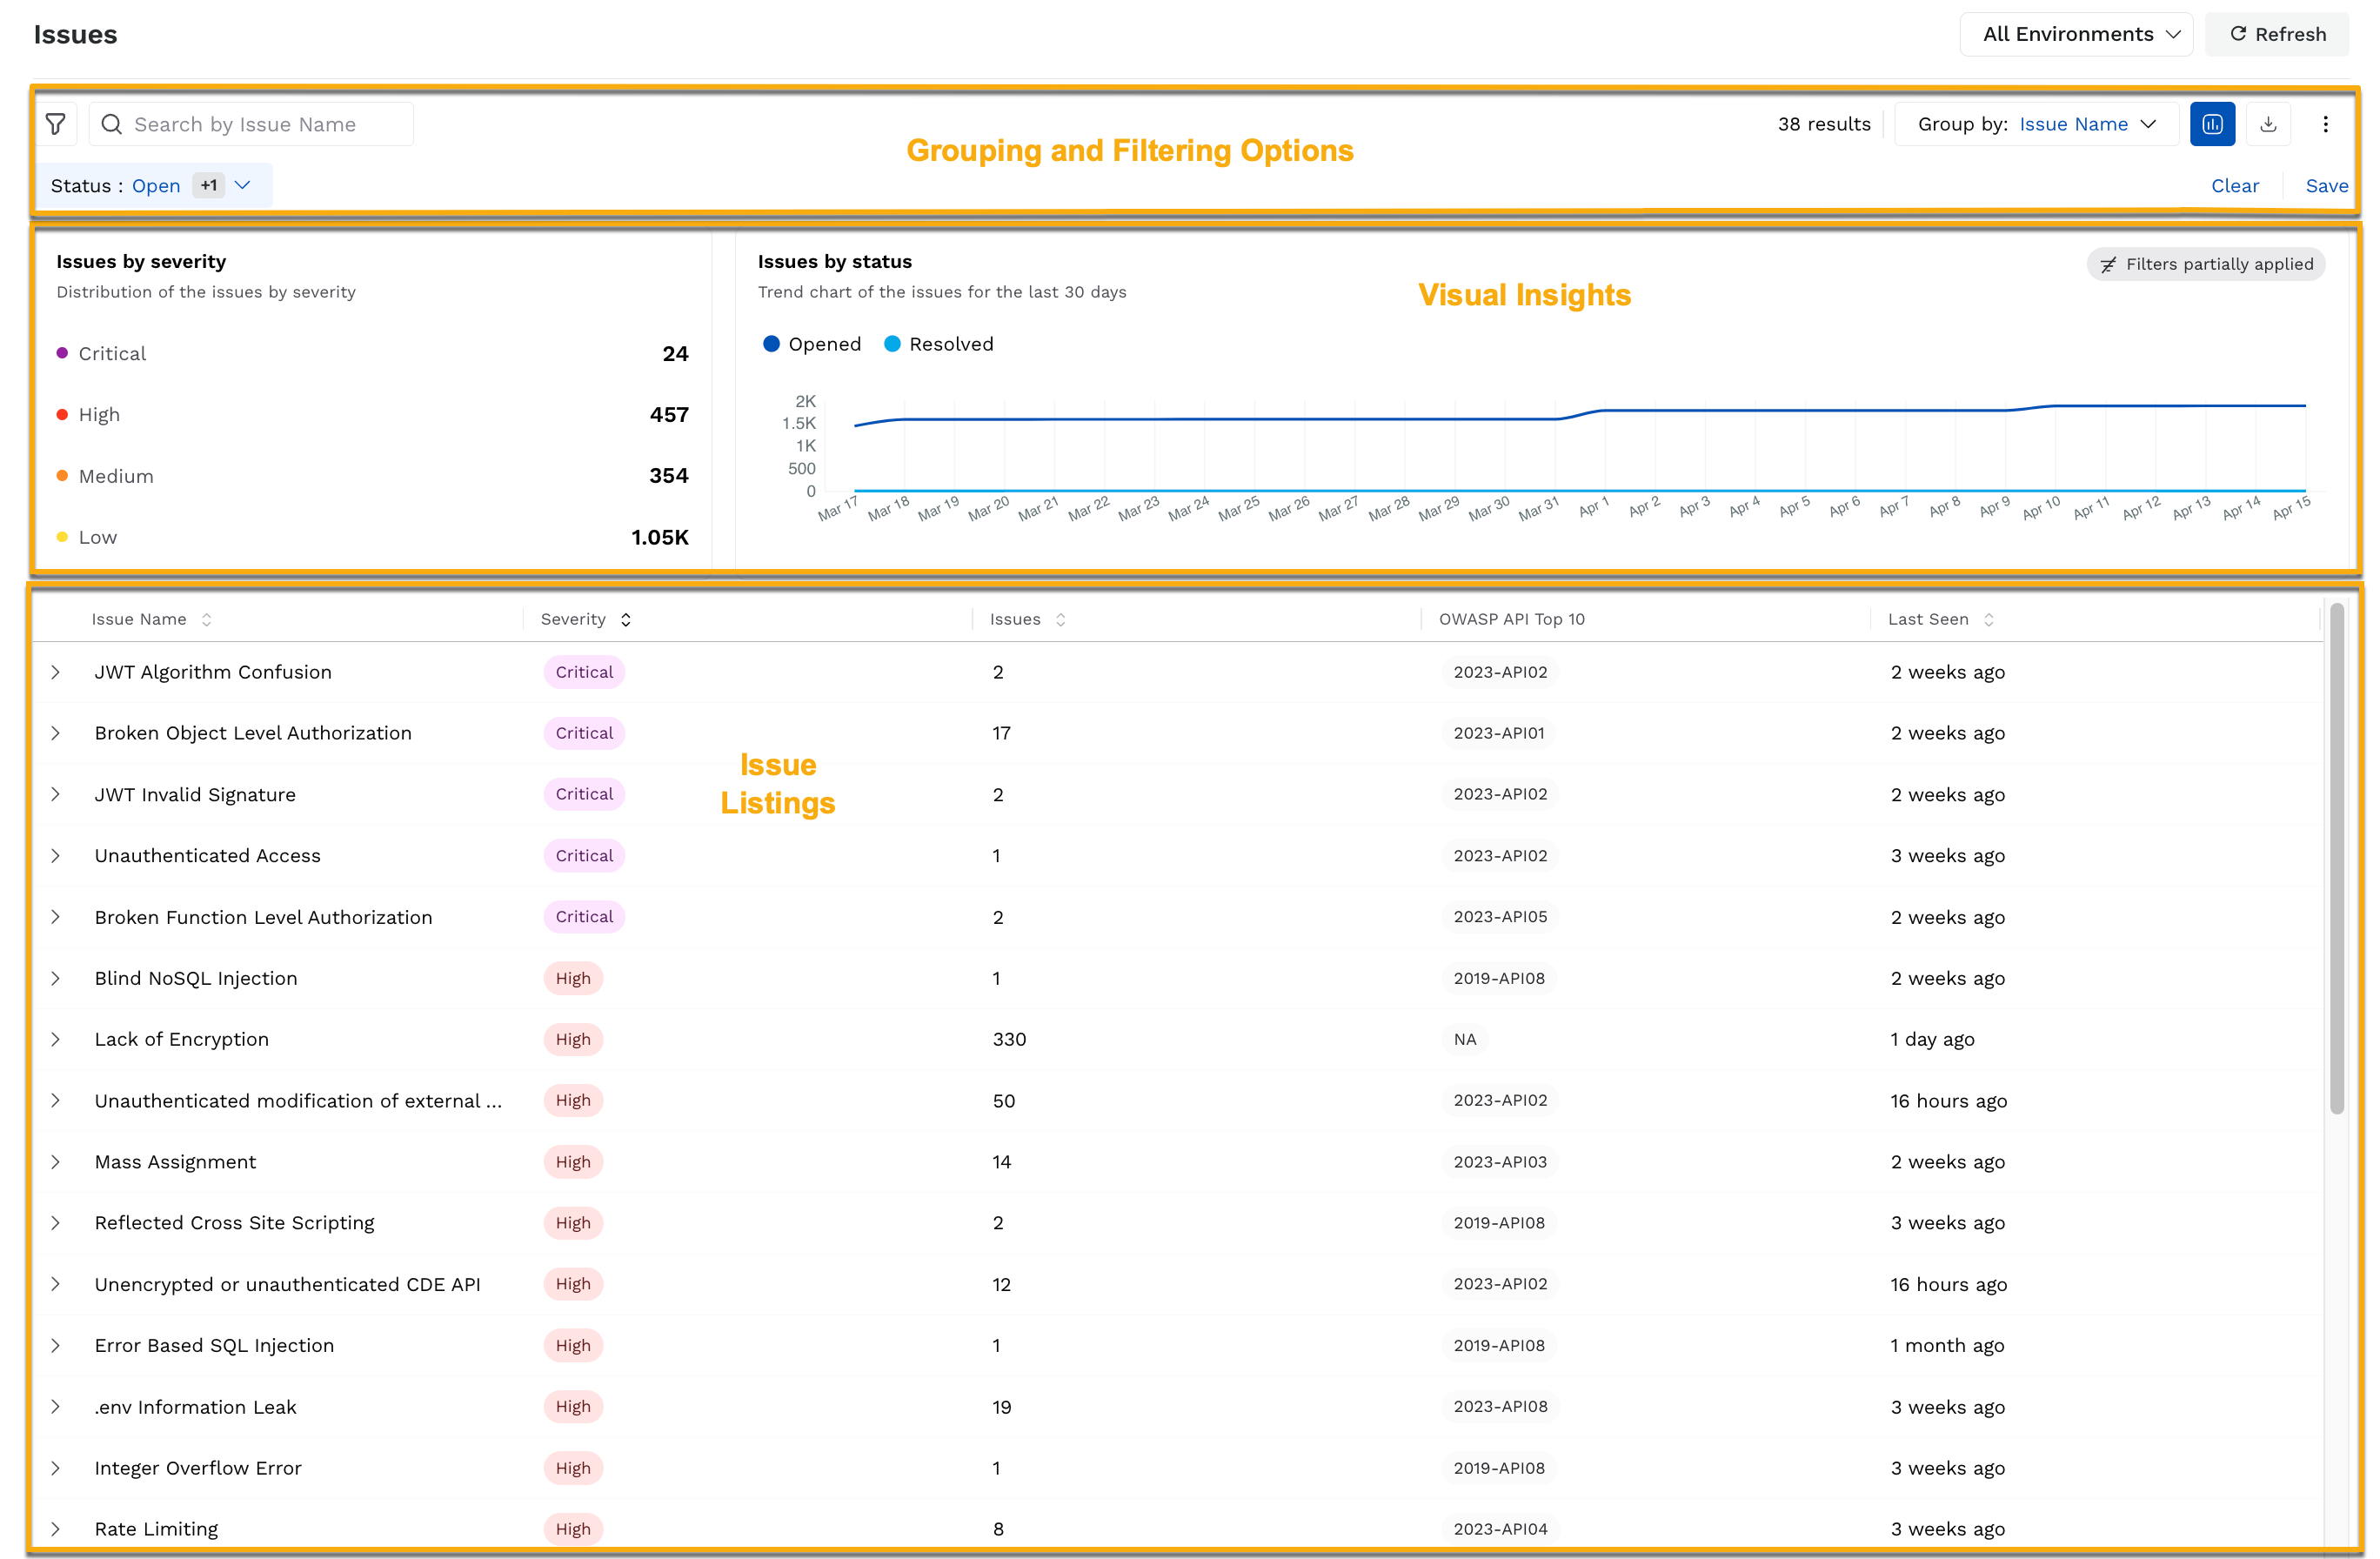
Issues Key Components
Visual Insights
At the top of the page, Traceable shows the following charts:
Chart | Description |
|---|---|
Issues by Severity | Shows the count of issues by severity (Severity Breakdown). You can click on the severity to filter the results based on your selection. |
Issues by Status | Shows a trend of the open and resolved issues over the past 30 days. |
Collectively, the above charts provide an overview of your application’s security health and trends, based on which you can take the necessary actions.
Issue Listings
Each entry on the page represents a unique issue, when grouped by Issue Name (default), with each column providing the following details. If you wish to drill down into an issue and manage it individually according to your requirements, see Navigating the Issues Flow.
Column | Description |
|---|---|
Issue Name | Specifies the issue's name, such as Broken Object Level Authorization. This name is used across the Traceable platform for identification purposes. |
Endpoint | Specifies the API or system endpoint (e.g. |
Severity | Each issue is categorized by color-coded labels (e.g., Low, Medium, High, Critical), enabling you to quickly assess its impact and urgency. This is helpful as it provides a way to prioritize issue resolution based on risk, focusing on high-severity issues that may require immediate attention, while lower-severity issues can be addressed as part of routine maintenance. |
Source | Displays information about the issue's origin (e.g., AST). This helps identify whether the issue was detected during the API scan, Issue policy, or testing. |
OWASP API Top 10 | Specifies the mapping to the OWASP API Top 10 security risks. This helps you understand and prioritize issues based on their global recognition. |
Last Seen | Specifies the most recent occurrence of the issue. This helps you determine whether the issue is still active, has reappeared, or is no longer a threat. |
Status | Displays the current status of the issue. This serves as a communication medium to indicate whether or not an issue requires prioritization. For more information on the available statuses, see Issue Management. |
Integrations | Displays the Jira icon. This helps you track an issue by creating a Jira ticket directly from the Traceable platform.
|
Actions | Enables you to edit the policy through which Traceable detected the issue.
|
Grouping and Filtering Options
While Traceable groups the issues on the page based on their name, you can filter and group issues based on several criteria:
Group By
Category | Description |
|---|---|
Issue Name | Groups issues based on the specific issue. This helps you understand how widespread an issue is across environments and focus on resolving the most recurring issues. |
Category | Groups issues based on broader classifications such as Authentication, Authorization, or JSON Web Token. This helps you analyze the issues from a broader perspective, identifying which issues are most common across the system. |
OWASP API Top 10 | Groups issues based on their mapping in OWASP API Top 10 categories. This helps you align your analysis with recognized industry standards. |
API Endpoints | Groups issues based on the endpoints in which they were detected. This helps you analyze the risk exposure for endpoints and prioritize resolution accordingly. |
Owner | Groups issues based on the assigned owner of the API. This helps you direct these issues to the right individual or team for faster and effective resolution. For more information on ownership and its assignment, see API Ownership. |
Label | Groups issues based on the labels assigned to APIs. This helps you assess and prioritize issues by business function, risk, or internal tagging conventions. |
Domain | Groups issues based on the domain of the API where the issue was detected. This helps you assess and prioritize issues by the application area or team affected. |
To group the issues using either of the above criteria, use the Group by drop-down, as shown in the image above.
Filters
Narrow the issues based on options, such as status, severity, source, timestamp, or sensitivity, ensuring that you can analyze them accordingly. To filter the issues based on your requirements, use the Filter (![]() ) icon, as shown in the image above.
) icon, as shown in the image above.
For information on managing issues based on the above groups and filters, see Issue Management.