The Posture Insights dashboard in Traceable provides a centralized and dynamic view of your organization’s API security posture. It enables security teams to view metrics for APIs across environments, assess these metrics and security posture, and monitor changes in near real-time. The dashboard provides actionable insights into the evolution of your API landscape, including API exposure, issue sensitivity, authentication issues, and the handling of sensitive data.
.png)
Posture Insights Dashboard
What will you learn in this topic?
By the end of this topic, you will understand:
The purpose and usefulness of the Posture Insights dashboard.
The details shown in each widget and how to leverage them.
The actions you can take on the dashboard.
How to investigate a sudden spike in API risk, using an example?
Understanding and leveraging the Posture Insights dashboard
The widgets displayed in the dashboard are divided into multiple categories. The following sections outline the key details displayed in the widgets and explain how you can utilize the data to tailor and analyze issues according to your requirements.
Note
The dashboard displays metrics for All Environments by default. You can change these settings according to your requirements. For more information, see Actions on the Posture Insights dashboard.
API Discovery and Posture summary
The widgets in this section provide a high-level overview of the API footprint and security posture.
Key metrics and widgets
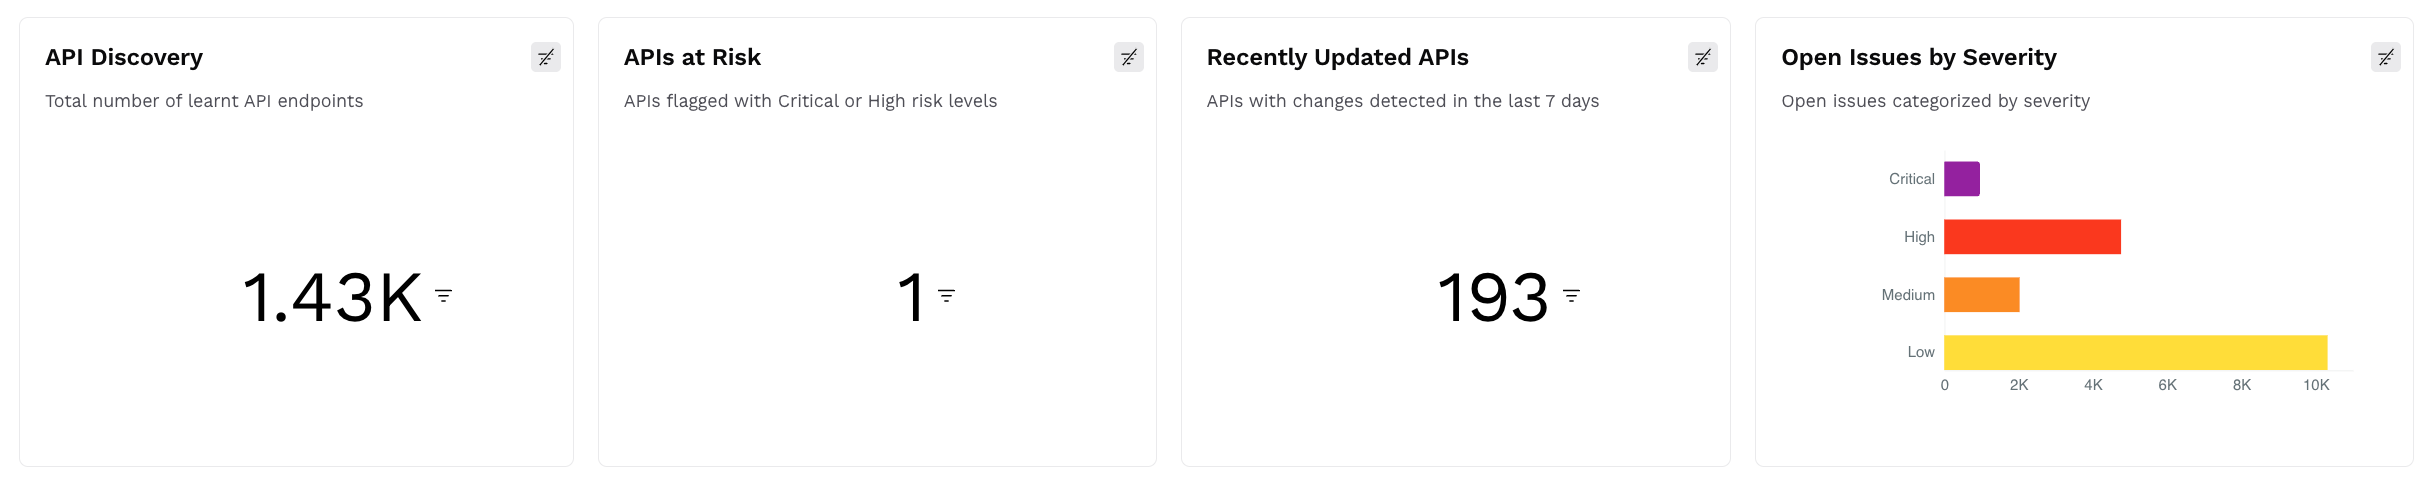
Key Metrics
API Discovery — This widget displays the total number of unique APIs discovered, for example, 1.43K, across environments at the time of viewing.
APIs at Risk — This widget displays the number of APIs flagged with High or Critical severity issues, for example, 1.
Recently Updated APIs — This widget displays the number of APIs that have changed in the last 7 days, for example, 193.
Open Issues by Severity — This widget displays a breakdown of the number of open issues grouped by severity: Critical, High, Medium, and Low.
For more information on these metrics, see Inventory.
Leveraging data shown in the widgets
You can utilize the data shown in the section in the following manner:
Identify posture changes, such as rising risks, recent updates, and newly discovered APIs.
Focus on APIs that have changed recently and may introduce new risks.
Use the displayed metrics to establish baselines and track posture changes.
Issue Trend and OWASP Mapping
The widgets in this section visualize issue trends over time and highlight issues based on the OWASP API Security Top 10 framework.
Issue Trend
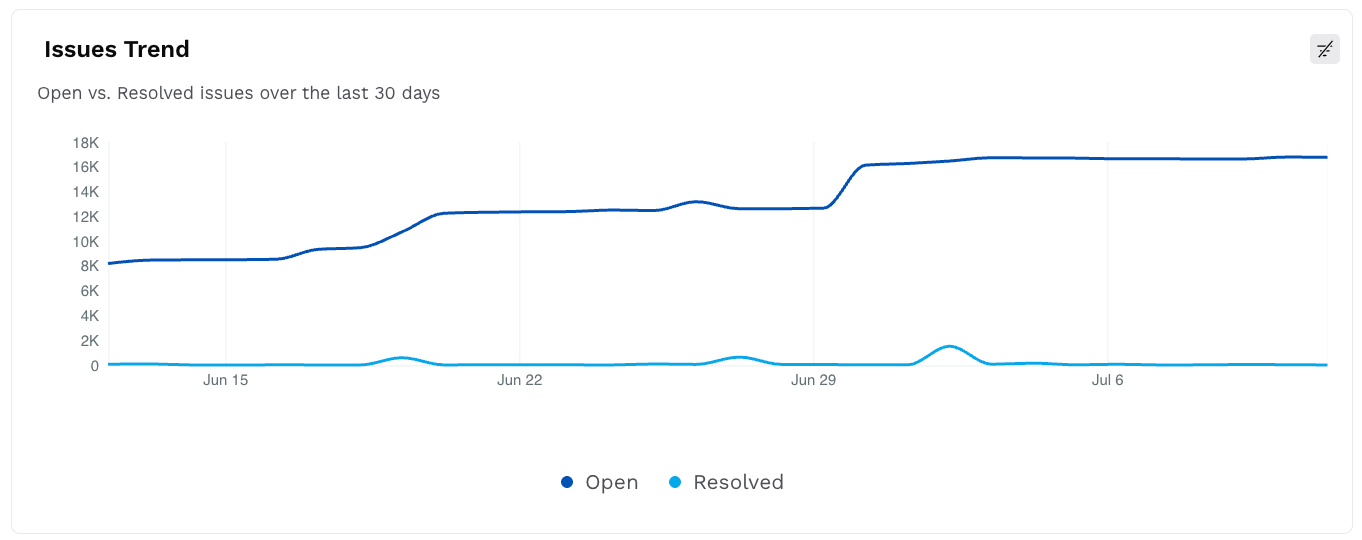
Issues Trend
This widget displays a line chart with the trend of open versus resolved issues in the past 30 days. This helps you understand the resolution velocity and growth in the number of open issues over time.
OWASP API Top 10 Issues
.png)
Open OWASP Top 10 Issues
This widget maps the open issues to the OWASP API Top 10 categories, for example, 2023-API09. It also highlights the type and count of issues corresponding to the category, along with the source based on which Traceable discovered the issue.
For more information on Issues, see Issues Overview.
Leveraging data shown in the widgets
You can utilize the data shown in the section in the following manner:
Analyze any recent increase in open issues or improvements in resolution trends.
Monitor surges in new issues or drops in remediation velocity.
Use the OWASP view to identify changes in types of issues, for example, an increase in the count of ownership issues.
API Inventory Classification
The widgets in this section provide insights into how APIs are structured and exposed across environments.
API Types Overview
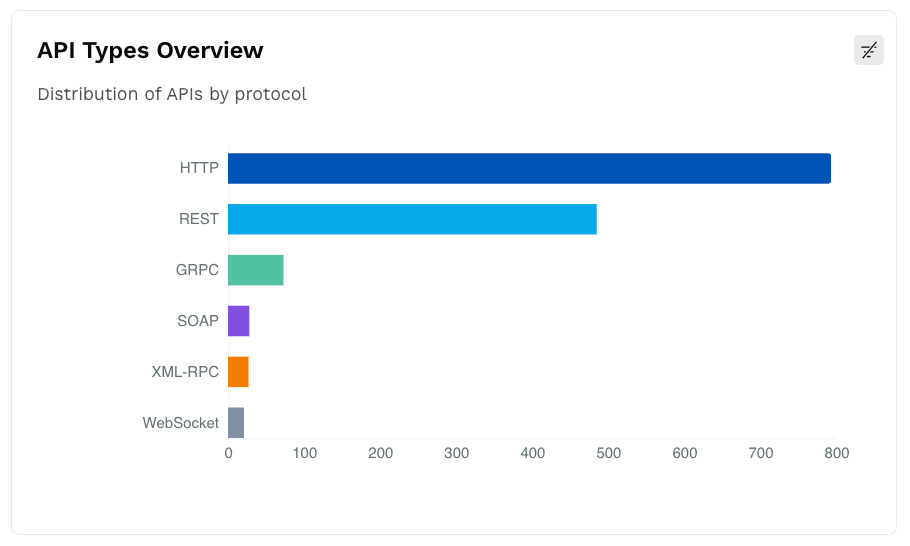
API Types Overview
This widget displays a bar chart with the number of APIs categorized by the protocol, for example, REST, GRPC.
API Exposure Classification
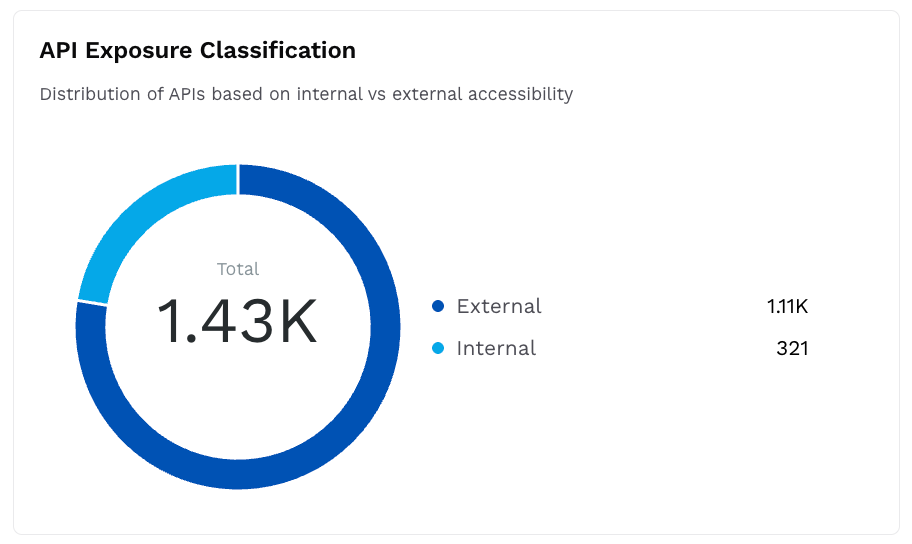
API Exposure Classification
This widget displays a donut chart with the number of APIs categorized by accessibility (Internal or External).
Authenticated vs Unauthenticated APIs
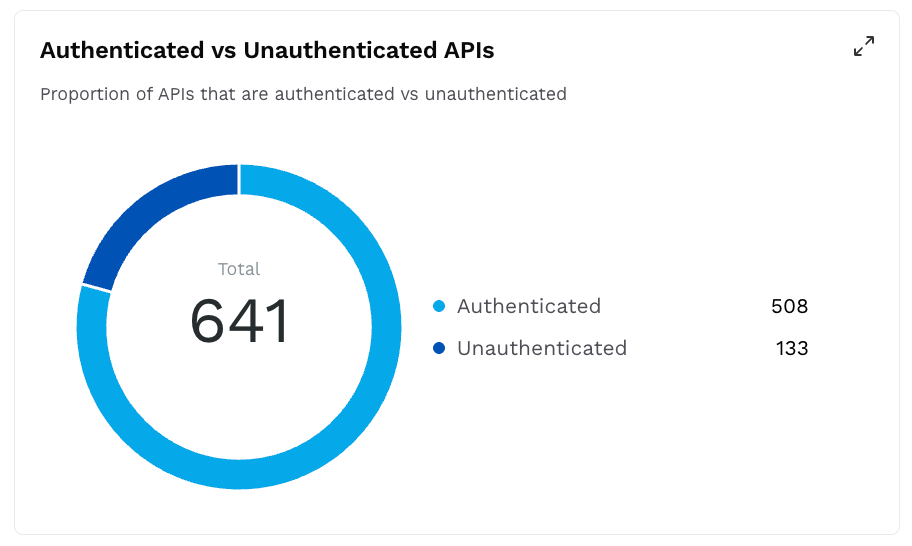
Authenticated vs Unauthenticated APIs
This widget displays a donut chart with the count of APIs enforcing authentication and the ones that do not, for example, 508 Authenticated and 134 Unauthenticated.
Leveraging data shown in the widgets
You can utilize the data shown in the section along with the environment-based filters in the following manner:
Understand the various protocols across APIs in your application ecosystem.
Monitor and assess the external APIs that may be exploited by attackers.
Identify unauthenticated APIs that may require attention.
Enforce standards based on API exposure and protocol.
Authentication and Data Sensitivity Insights
The widgets in this section provide insights into the authentication mechanism of APIs and the sensitive data they expose.
Authentication Method Distribution
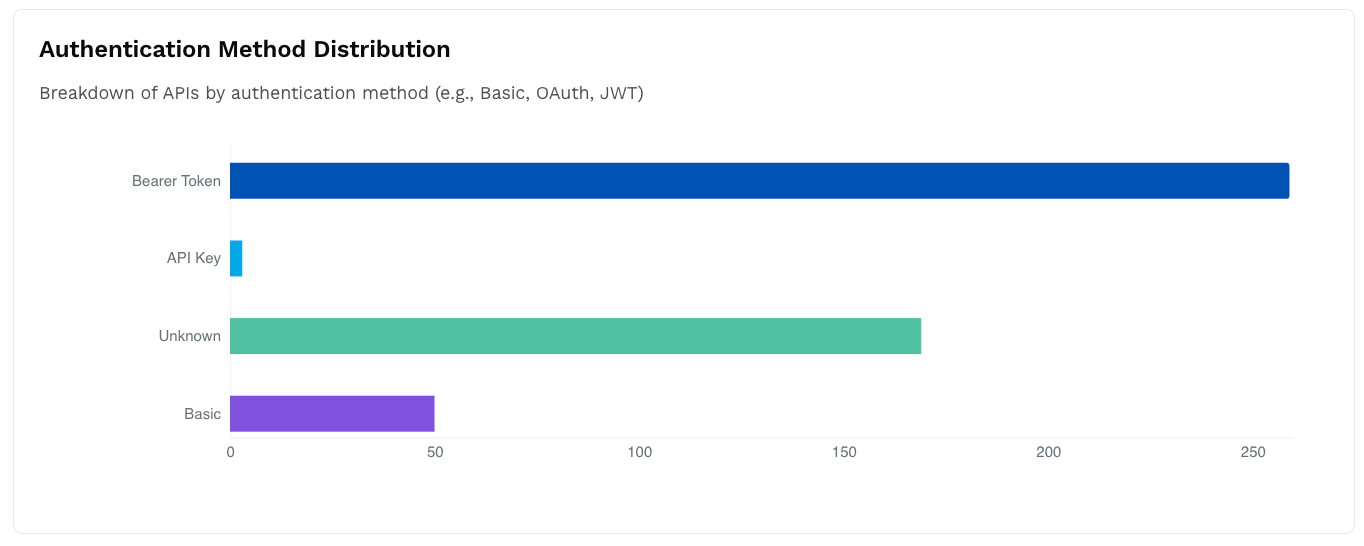
Authentication Method Distribution
This widget displays a bar chart with the number of APIs categorized by their authentication mechanism, for example, API Key, Basic Auth.
Sensitive Data Distribution Across APIs
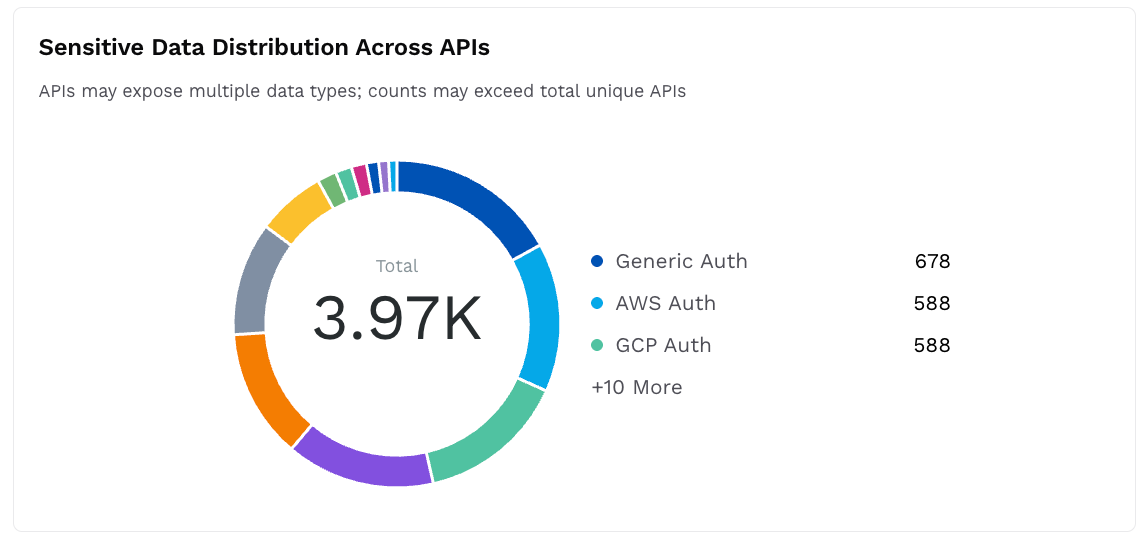
Sensitive Data Distribution Across APIs
This widget displays a donut chart with the count of sensitive data types exposed through APIs, for example, PCI DSS, General Personal Info.
Leveraging data shown in the widgets
You can utilize the data shown in the section in the following manner:
Identify weak authentication methods and the associated APIs.
Ensure that authentication is consistent across services.
Identify APIs that expose sensitive data and may require data protection policies.
Actions on the Posture Insights dashboard
The Posture Insights dashboard provides various actions that you can perform to view the specific data and drill down according to your requirements:
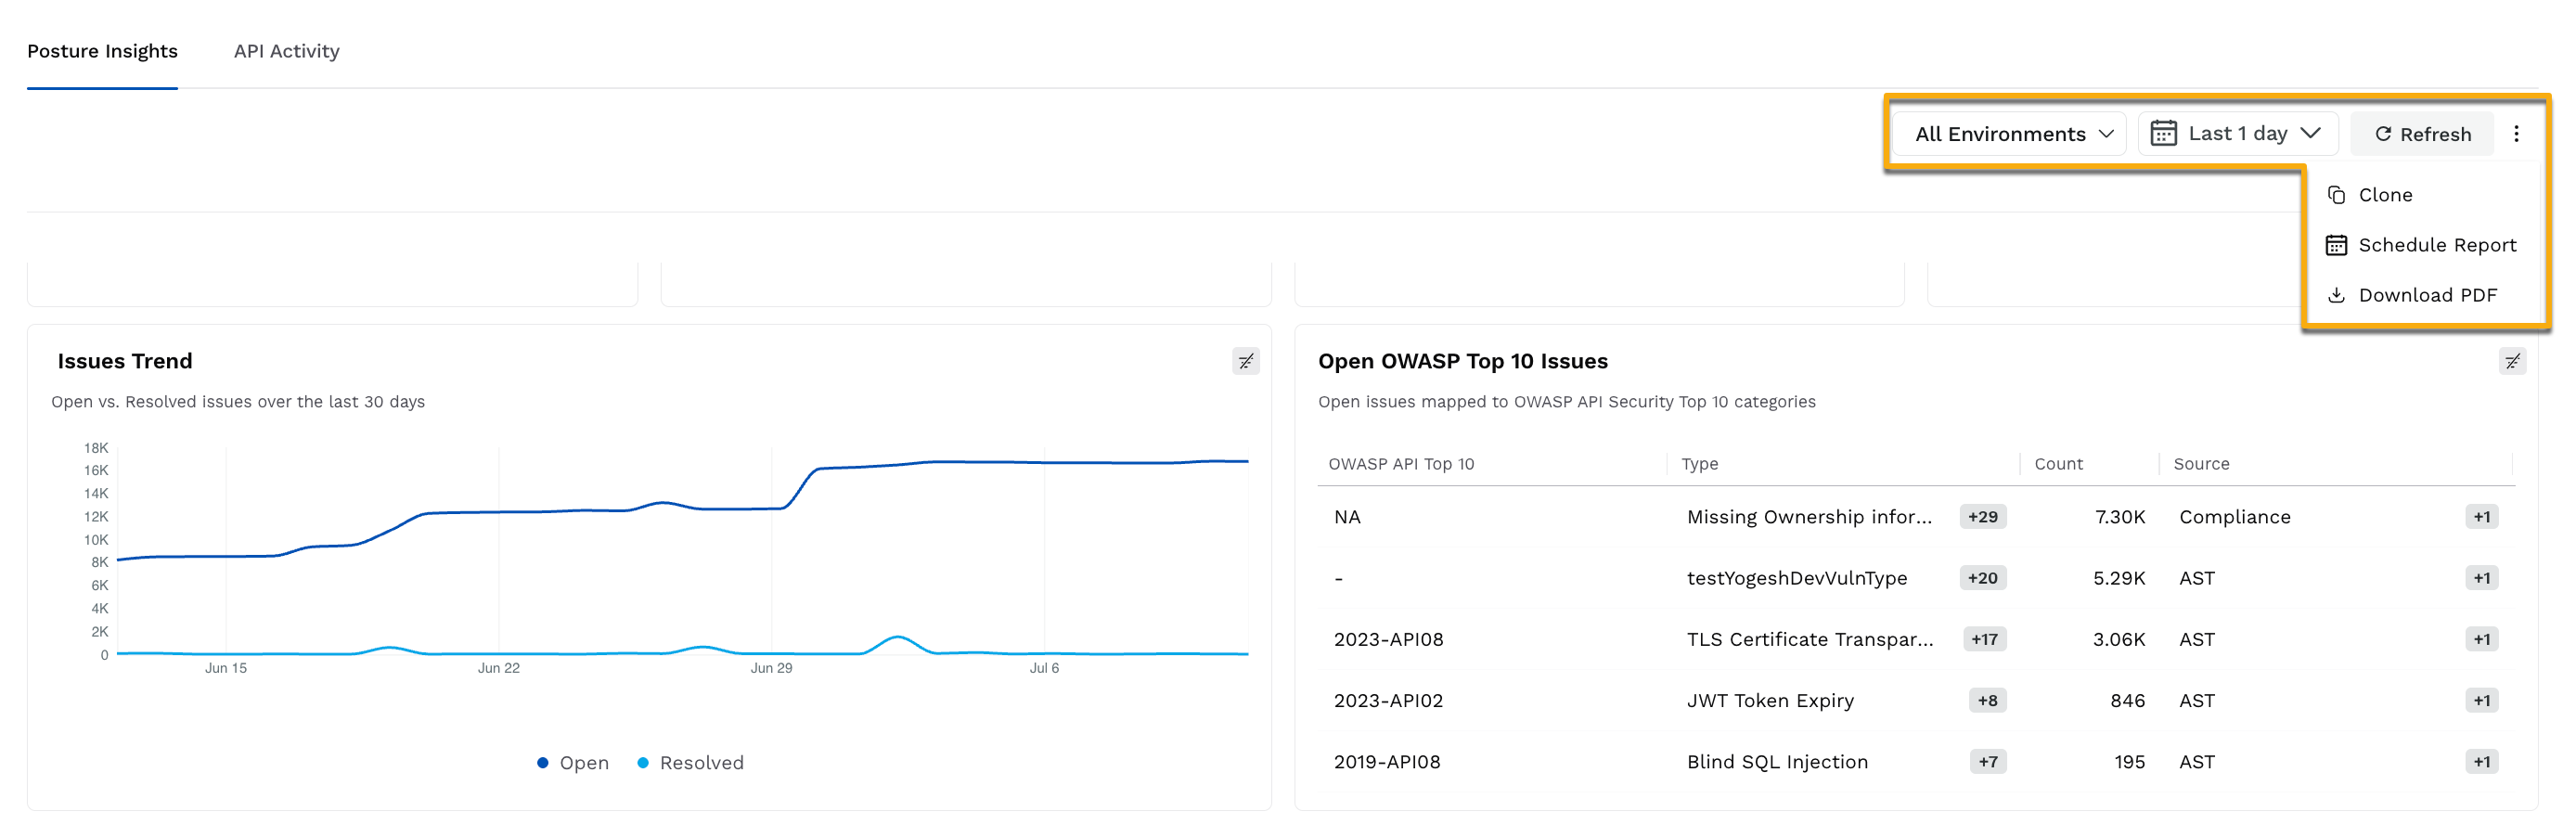
Actions on the Posture Insights Dashboard
View data for specific Environments — While Traceable displays data on the dashboard for All Environments by default, you can click the Environment drop-down in the page’s top right corner to view data for specific environments.
Drill down into specific data — You can click a value displayed in the dashboard widgets to drill down into a specific metric. Traceable redirects you to the page and selects the filters based on the value you clicked on. On this page, you can monitor the metrics and carry out the necessary actions.
Clone the dashboard — While the widgets displayed in the dashboard cannot be modified, you can clone the dashboard to the Custom Dashboard page and modify it according to your requirements. To clone the dashboard, click the Ellipsis icon in the page’s top right corner, and click Clone. For more information on custom dashboards, see Boards.
Schedule a Report for the dashboard — You can schedule a report for the dashboard that Traceable sends to your email address. To schedule a report, click the Ellipsis icon in the page’s top right corner, click Schedule Report, and in the pop-up window, complete the following steps:
.png)
Schedule Dashboard Report
Specify a Name for the report, for example, Sample Posture Insights Report.
Select a Format, for example, PDF.
Select the Environment for which you wish to receive the report, for example, Fintech-App.
Select the Frequency and corresponding Timeline, for example, Weekly, Friday, 3:00 PM.
Click the toggle to enable or disable report generation.
Specify the Email(s) where you wish to receive the report.
Based on the timeline you select, Traceable generates the report and sends it to the specified email address(s).
Download PDF — You can download the data shown in the dashboard for offline analysis. To download the dashboard, click the Ellipsis icon in the page’s top right corner, and click Download PDF.
Practical example: Investigating a sudden API risk spike
Consider a scenario where the data is being displayed in the dashboard for the Payments environment. In this dashboard, you observe that the APIs at Risk widget shows an increase from 2 to 10 within 12 hours. The Payments environment contains payment-related APIs that contain sensitive customer and transaction data.
In such a scenario, you can utilize the dashboard in the following manner:
Step 1 — Identify the API risk scope
In the Key Metrics widgets, you observe a rise in the number of issues having High severity. Additionally, you navigate to the Recently Updated APIs widget and click the value to drill down to view the affected APIs. Upon clicking, Traceable redirects you to the Inventory page with the necessary filters applied. While the page displays the APIs updated in the past 7 days, you can apply the Last Called filter to view the APIs updated on a specific date or within a timeline. For example, if you wish to view updated APIs between the last 12 hours, complete the following steps:
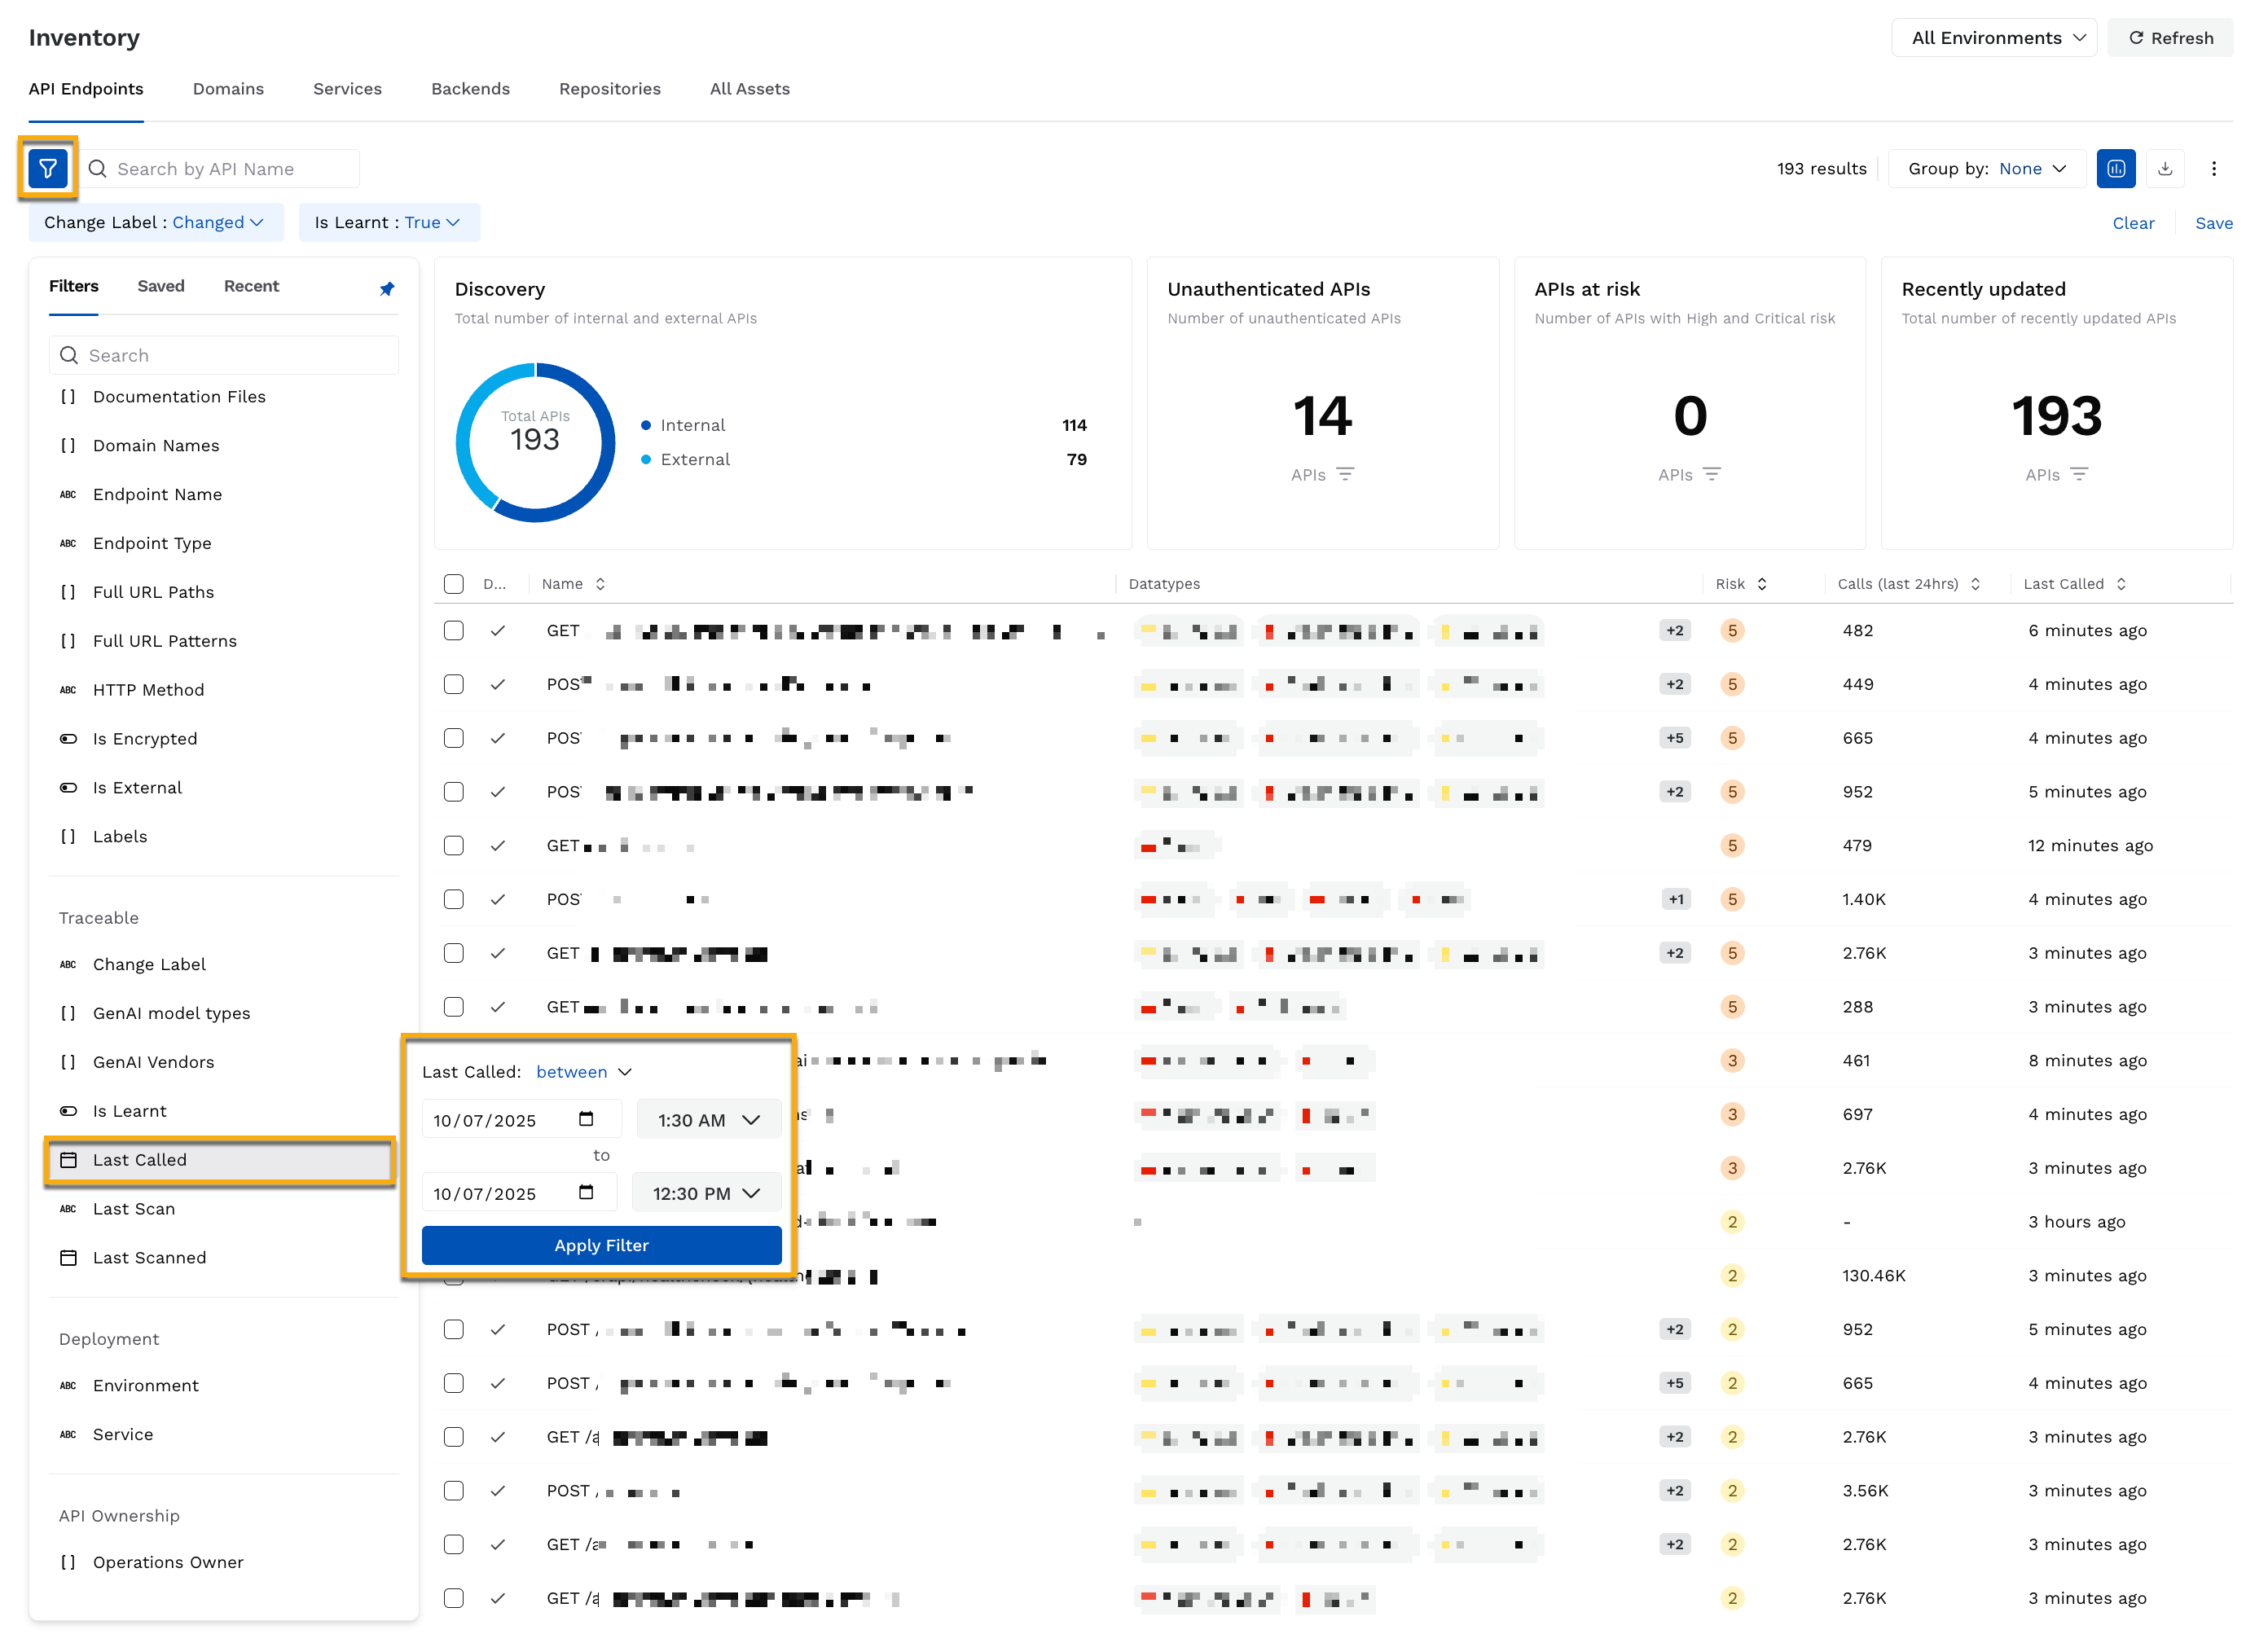
Drill down into Recently Updated APIs
In the Inventory page’s left top corner, click the Filter icon.
In the Filter panel, scroll down to the Traceable → Last Called filter attribute.
In the attribute panel, do the following:
From the Operator drop-down, select an operator, for example, between.
In the Time Range drop-downs, select the dates and time according to your requirements, for example, July 10, 1:30 AM and July 10, 12:30 PM.
Click Apply Filter.
From the list of APIs, you identify that updates were made to the following payment-related APIs, resulting in an issue spike:
POST /api/v1/cards/issueGET /api/v1/cards/authorizationPOST /api/v1/wallet
These APIs indicate that they were updated in the recent release.
Step 2 — Investigate the issue trends
Navigate to the Issue Trend widget, and you observe a spike in the number of open issues on July 10, 2:00 AM. This spike coincides with the deployment window for the Payments team. Then, you can identify the OWASP categories associated with the APIs.
Step 3 — Map vulnerabilities to OWASP categories
Navigate to the Open OWASP Top 10 Issues widget, and you observe that the following categories were not present earlier:
2023-API01— Broken Object Level Authorization (BOLA)2023-API04— Unrestricted Resource Consumption2023-API08— Security Misconfiguration
These OWASP categories indicate that exploiters may be attacking APIs that do not have:
Proper authorization checks.
Any rate limits.
Proper configurations.
Further, you can verify the API exposure and authentication to identify unintentionally exposed APIs.
Step 4 — Drill down into API exposure and authentication issues
Navigate to the API Exposure Classification and Authenticated vs Unauthenticated APIs widgets, and you identify that the APIs are Internal and Authenticated.
To investigate further, you navigate to the Authentication Method Distribution widget and identify that multiple APIs are using API keys, which do not fulfill the internal standards for API authentication.
Further, using the Sensitive Data Distribution Across APIs widget, you identify that the following data types are being exposed through the affected APIs:
General personal information, such as email address, name, and phone number.
Card details, such as ID and expiry.
As a result of the drill-down, you can take the necessary actions as mentioned below.
Results
Using the Posture Insights dashboard, you were able to:
Identify the APIs involved in the spike and correlate them to recent releases.
Map the detected issues to OWASP categories to understand their impact.
Identify misconfigurations in API authentication that do not fulfill the internal standards.
Analyze the exposure of sensitive customer and financial data and take the necessary actions.
Implement the required actions, such as rolling back the release, enforcing strict authentication standards, and access controls.
Inform the relevant engineering teams of the issues, mandate API ownership fields, and implement governance policies.