AI Security is Traceable’s out-of-the-box dashboard that provides insights into AI assets, such as models, APIs, and MCP servers, ensuring immediate functionality. The dashboard consolidates analytics from the Discovery, Protection, and Testing modules to help you monitor security posture and threat activity.
AI Security Dashboard
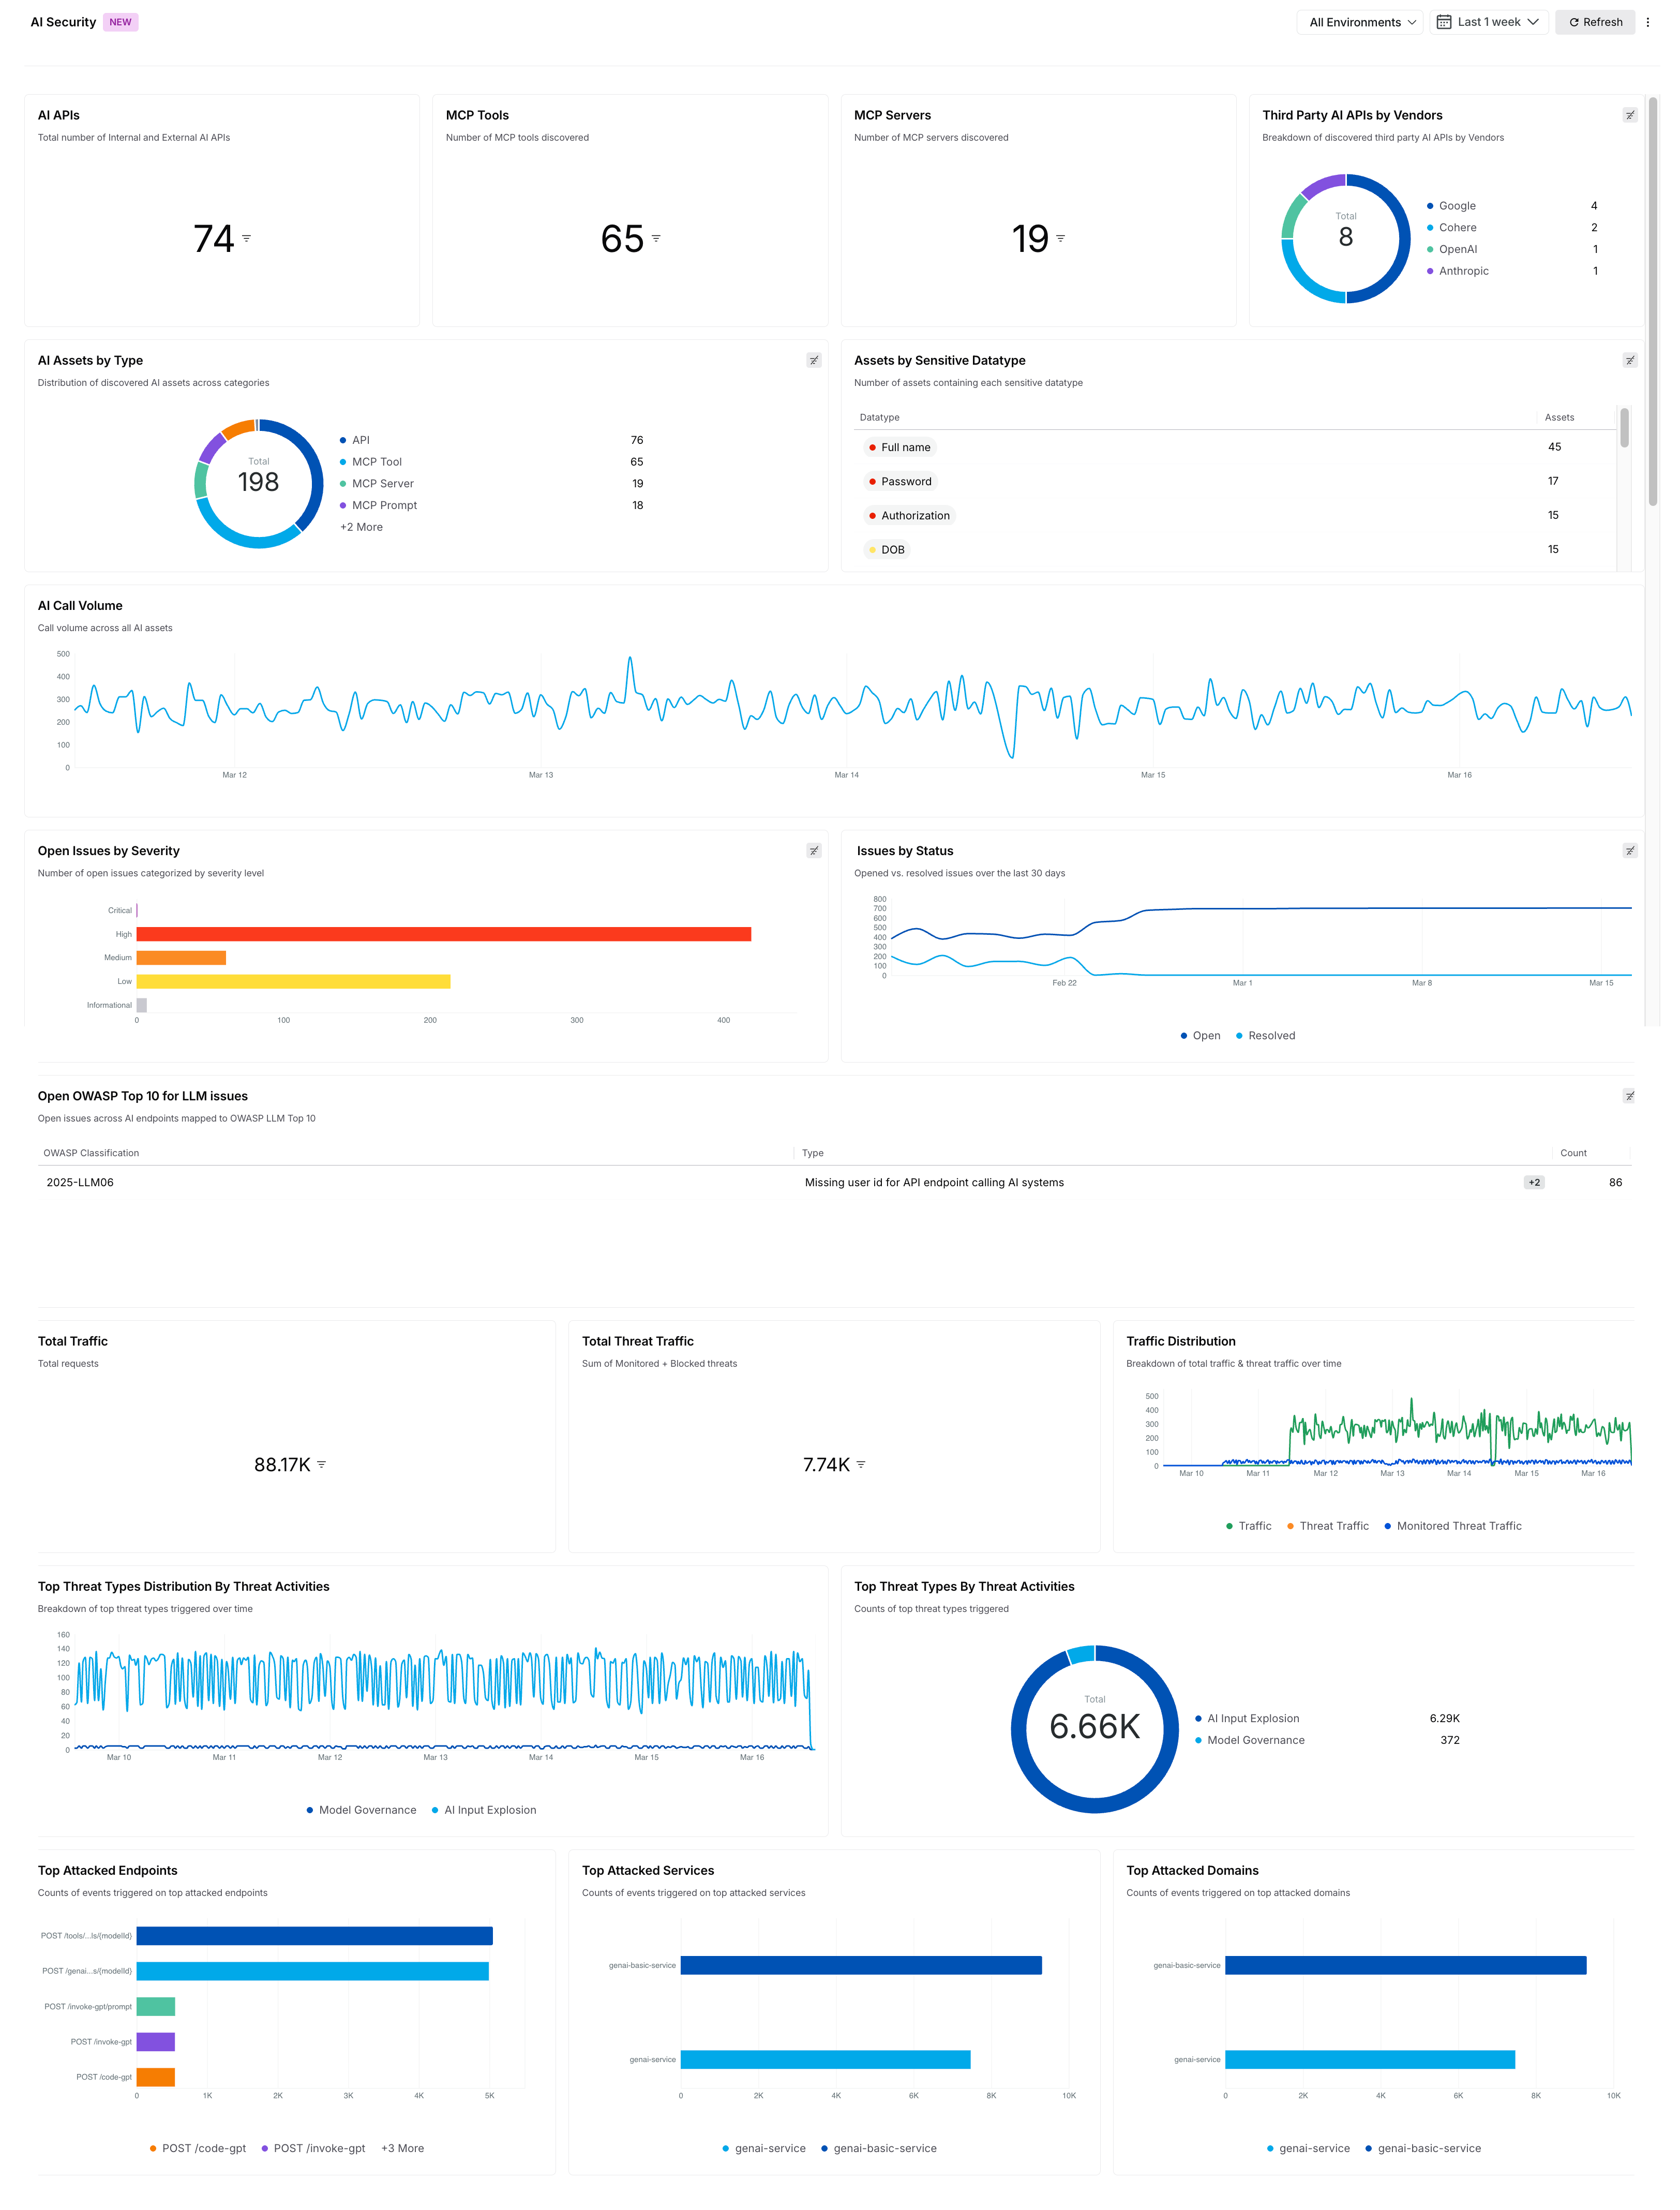
Widgets on the AI Security dashboard
By default, the following widgets are displayed on the AI Security dashboard:
Widget Name | Description |
|---|---|
AI APIs | This displays a univariate widget with the total number of internal and external AI APIs discovered. For more information on these APIs, see AI Assets. |
MCP Tools | This displays a univariate widget with the total number of Model Context Protocol (MCP) tools discovered. For more information, see AI Asset Details. |
MCP Servers | This displays a univariate widget with the total number of Model Context Protocol (MCP) servers discovered. For more information, see AI Asset Details. |
Third-Party AI Vendors and APIs | This displays a table widget with the discovered third-party AI vendors and their corresponding APIs. For more information, see Third Party. |
AI Assets by Type | This displays a donut chart showing the distribution of discovered AI assets by type, including AI APIs, MCP tools, MCP servers, and MCP prompts. |
Assets by Sensitive Datatype | This displays a table widget with the number of AI assets containing each detected sensitive datatype. |
AI Call Volume | This displays a time-series chart of call volume across all AI assets. |
Open Issues by Severity | This displays a horizontal bar chart with the number of open issues categorized by severity. For more information, see Issues Overview. |
Issues by Status | This displays a time-series chart showing the number of opened versus resolved issues over the past 30 days. For more information, see Issues Overview. |
Open OWASP Top 10 for LLM Issues | This displays a table widget mapping open issues across AI endpoints to the OWASP LLM Top 10 risks. |
Total Traffic | This displays a univariate widget with the total number of requests observed. |
Total Threat Traffic | This displays a metric card with the total number of monitored and blocked threats. For more information, see Threat Activity. |
Traffic Distribution | This displays a time-series chart with the breakdown of total traffic and threat traffic over time. |
Top Threat Types Distribution by Threat Activities | This displays a time-series chart with the distribution of the top threat types triggered over time. |
Top Threat Types by Threat Activities | This displays a donut chart with the counts of top threat types triggered. For more information, see Threat Activity. |
Top Attacked Endpoints | This displays a bar chart with the counts of events triggered on the top-attacked endpoints. For more information, see API Endpoints. |
Top Attacked Services | This displays a bar chart with the count of events triggered on the top-attacked services. For more information, see Services. |
Top Attacked Domains | This displays a bar chart with the count of events triggered on the top-attacked domains. For more information, see Domains. |
Actions on the AI Security Dashboard
While the above widgets are shown in the AI Security dashboard by default, you can customize the dashboard to carry out the following actions:
Action | Description |
|---|---|
Add Widgets | Add up to 12 widgets on the dashboard. |
Clone Widgets | Duplicate existing widgets and modify their configurations according to your requirements. |
Modify Widgets | Edit the configuration(s) of the existing widgets according to your requirements. |
Remove Widgets | Delete widgets from the dashboard according to your requirements. |
Apart from the above actions, Traceable also allows you to do the following:
Modify the Name and Description of Widgets
Modify the Placement and Size of Widgets
Modify the Dashboard’s Name and Description
Reset the Dashboard to the Default View
For the steps to perform the above actions, see Actions.