Updates (October 2025 to December 2025)
October 2025 — Updated the topic to add detailed information about the threat rules on a group-by-level basis in a slide-out panel, and manage Jira tickets for the same group under different timestamps. For more information, see Navigating the Threat Activity Flow.
Threat Activity in Traceable enables your security teams to detect, investigate, and mitigate potential threats in real-time. It provides an intuitive interface with detailed insights into active threats, allowing you to effectively monitor suspicious activities across your systems. Threat activity allows you to analyze threats by grouping, drilling down into specific events, and reviewing detailed evidence to understand the nature of attacks and take appropriate actions.
What will you learn in this topic?
By the end of this topic, you will be able to understand:
The use of threat activity and how you can leverage it.
The steps to navigate the threat activity flow.
The key features of threat activities.
The concept of creating and tracking Jira tickets for individual and grouped threat rules.
Why use Threat Activity?
The constant barrage of cyberattacks on systems, networks, and APIs makes it imperative to have a tool that provides actionable insights into what is happening within your infrastructure. Threat Activity helps you:
Monitor active threats — Stay updated with real-time alerts on ongoing malicious activity.
Drill down into specific threats — Group and filter data based on criteria that matter most to your investigation.
Analyze evidence in detail — Review request/response data, attacker sources, and other critical metadata to make informed security decisions.
Mitigate and respond — Implement fixes or block suspicious actors based on evidence and recommendations provided by the platform.
Understanding Threat Activity
The Threat Activities page is a centralized hub for visualizing all detected threats. It provides a comprehensive overview of ongoing attacks, including their severity and key details such as the source and target of the threat. This dashboard provides a clear snapshot of your system’s security posture, helping security teams prioritize and investigate threats efficiently. To view the Threat Activity page, navigate to Protection → Threat Activities.
The following interactive demo walks you through the steps to navigate, view, and manage threat activities in Traceable.
Key Components
The Threat Activities page contains several key components that help you quickly assess and manage detected threats. Below are the main elements of the page and their significance:
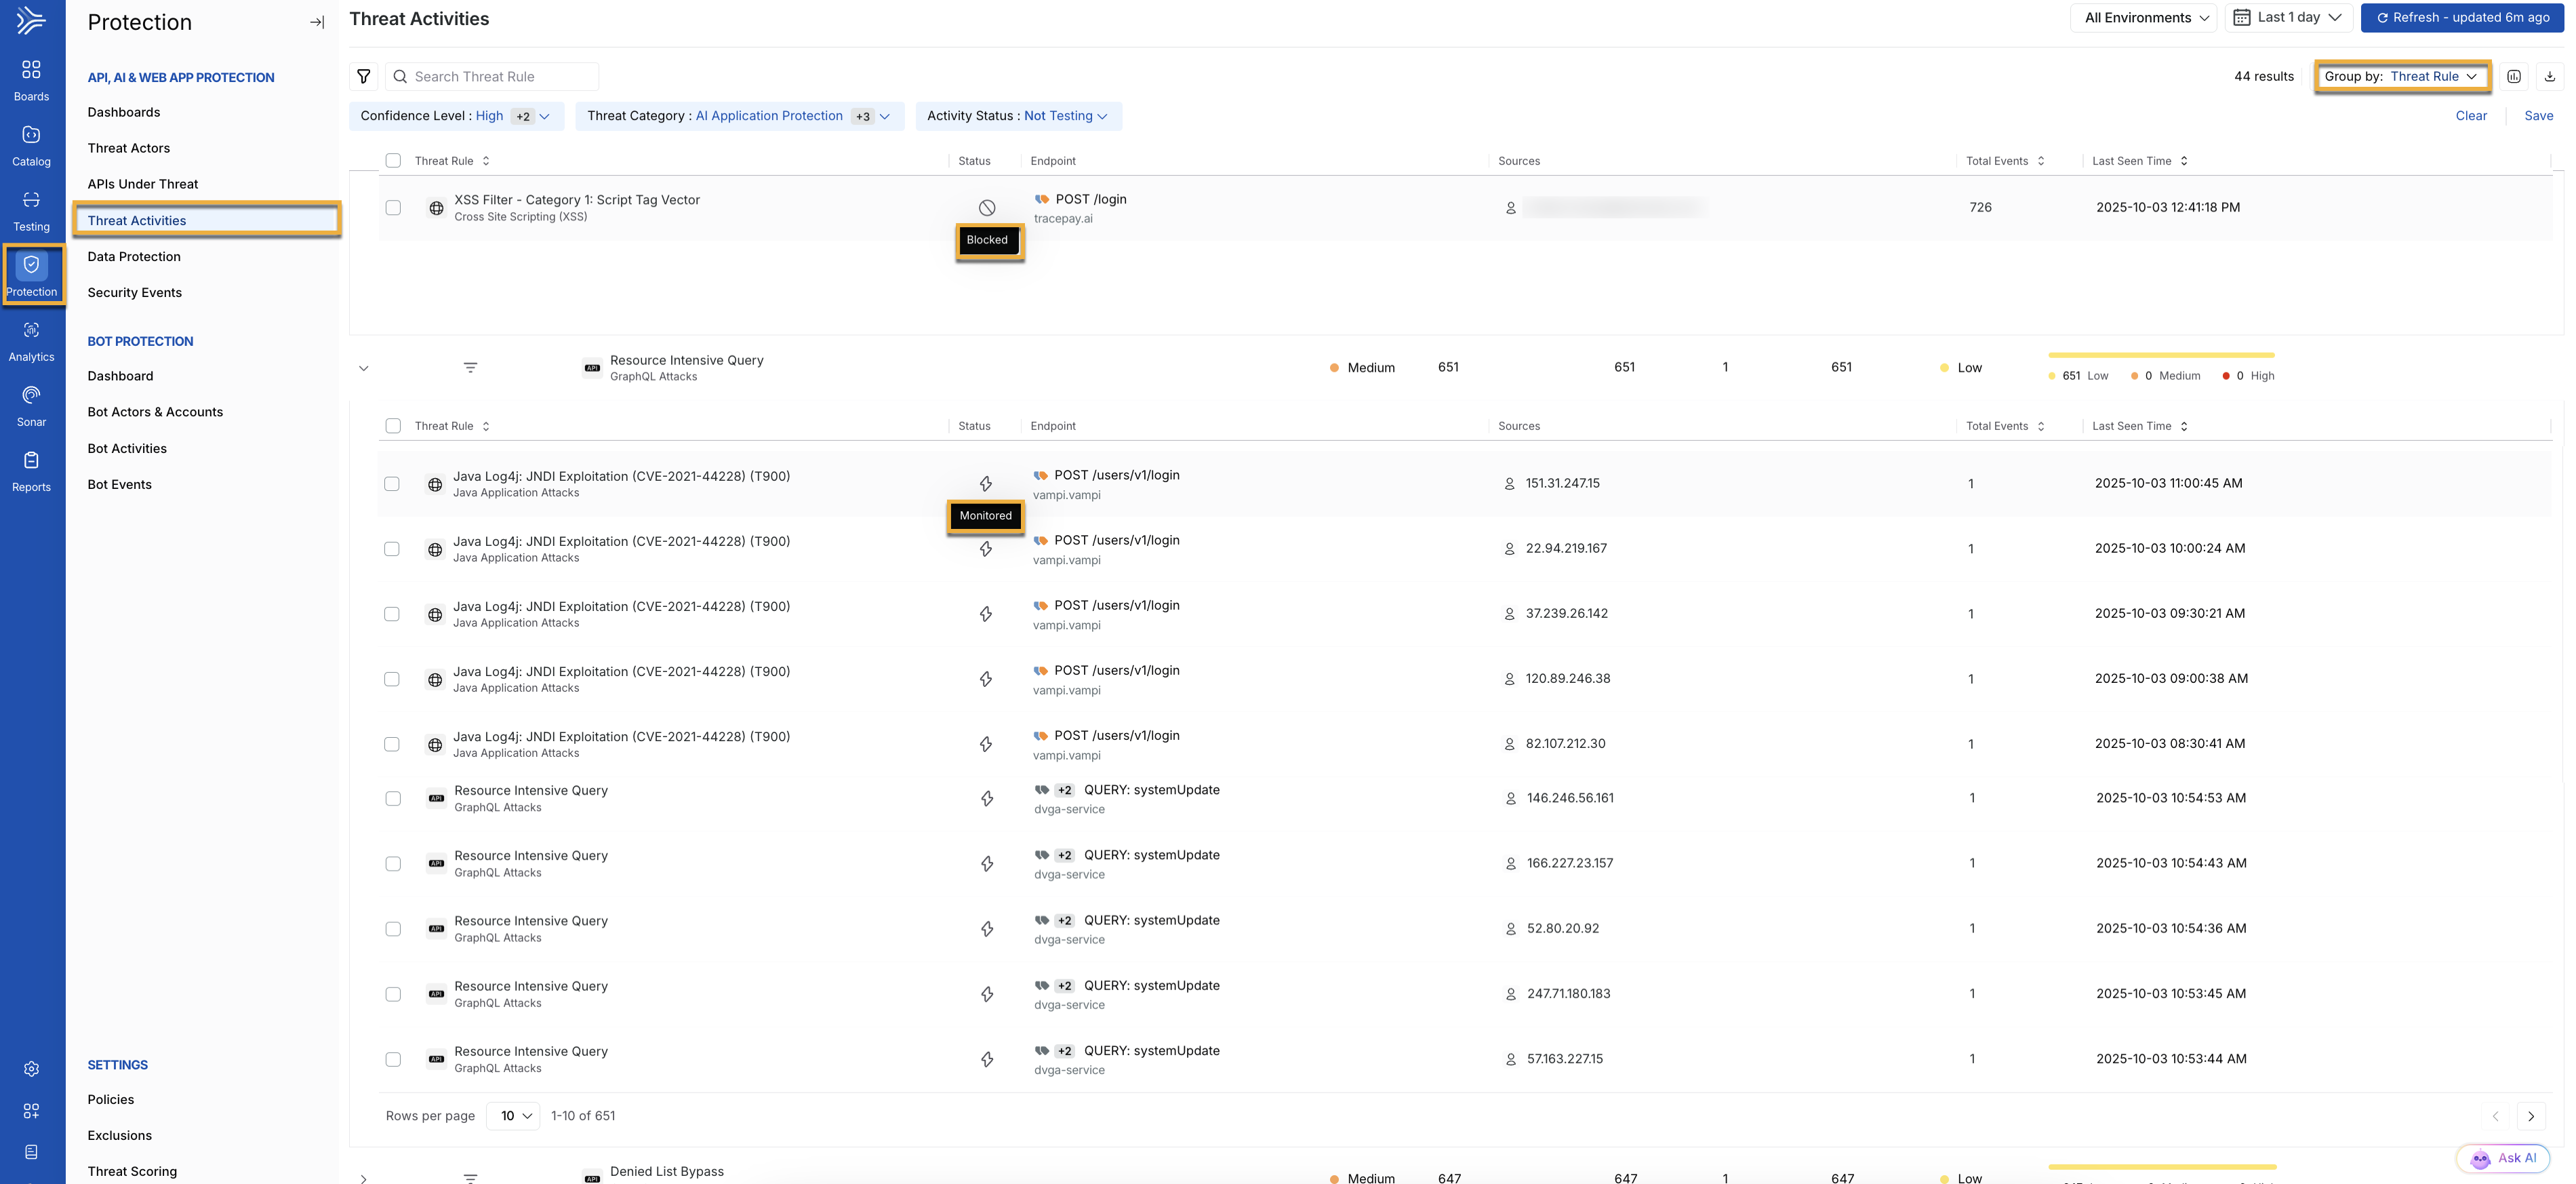
Threat Activity Dashboard
Threat Listings — Each entry in the dashboard represents an individual threat rule, with each entry providing the following details:
Threat Rule — Describes the type of attack, for example, Remote File Inclusion, SQL Injection. Understanding the behavior helps security teams quickly assess the type of attack being attempted and its potential impact on the system.
Status — Displays the current status of how the threat is being handled. This serves as a communication medium to indicate whether a threat has been monitored (
 ) or blocked (
 ).
).Endpoint — Specifies the API or system endpoint, for example,
POST /get_userunder attack. This helps security teams focus on which parts of the infrastructure are targeted and may require additional hardening or scrutiny.Sources — Displays information about the origin of the threat, including the IP address or actor responsible for the suspicious activity. This helps identify whether the threat comes from a known bad actor or a potential internal source.
Total Events — Displays the number of times a particular threat has been triggered. This is helpful as high event counts may indicate repeated attack attempts, suggesting persistent threats that must be addressed immediately.
Last Seen Time — Displays the most recent detection time for the threat, helping you track ongoing or recurring threats. Monitoring the last seen time ensures that security teams can distinguish between active threats and those that may have been successfully mitigated.
Grouping and Filtering Options — You have the flexibility to group and filter threats based on several criteria:
Note
By default, Traceable groups the threats by Threat Rule.
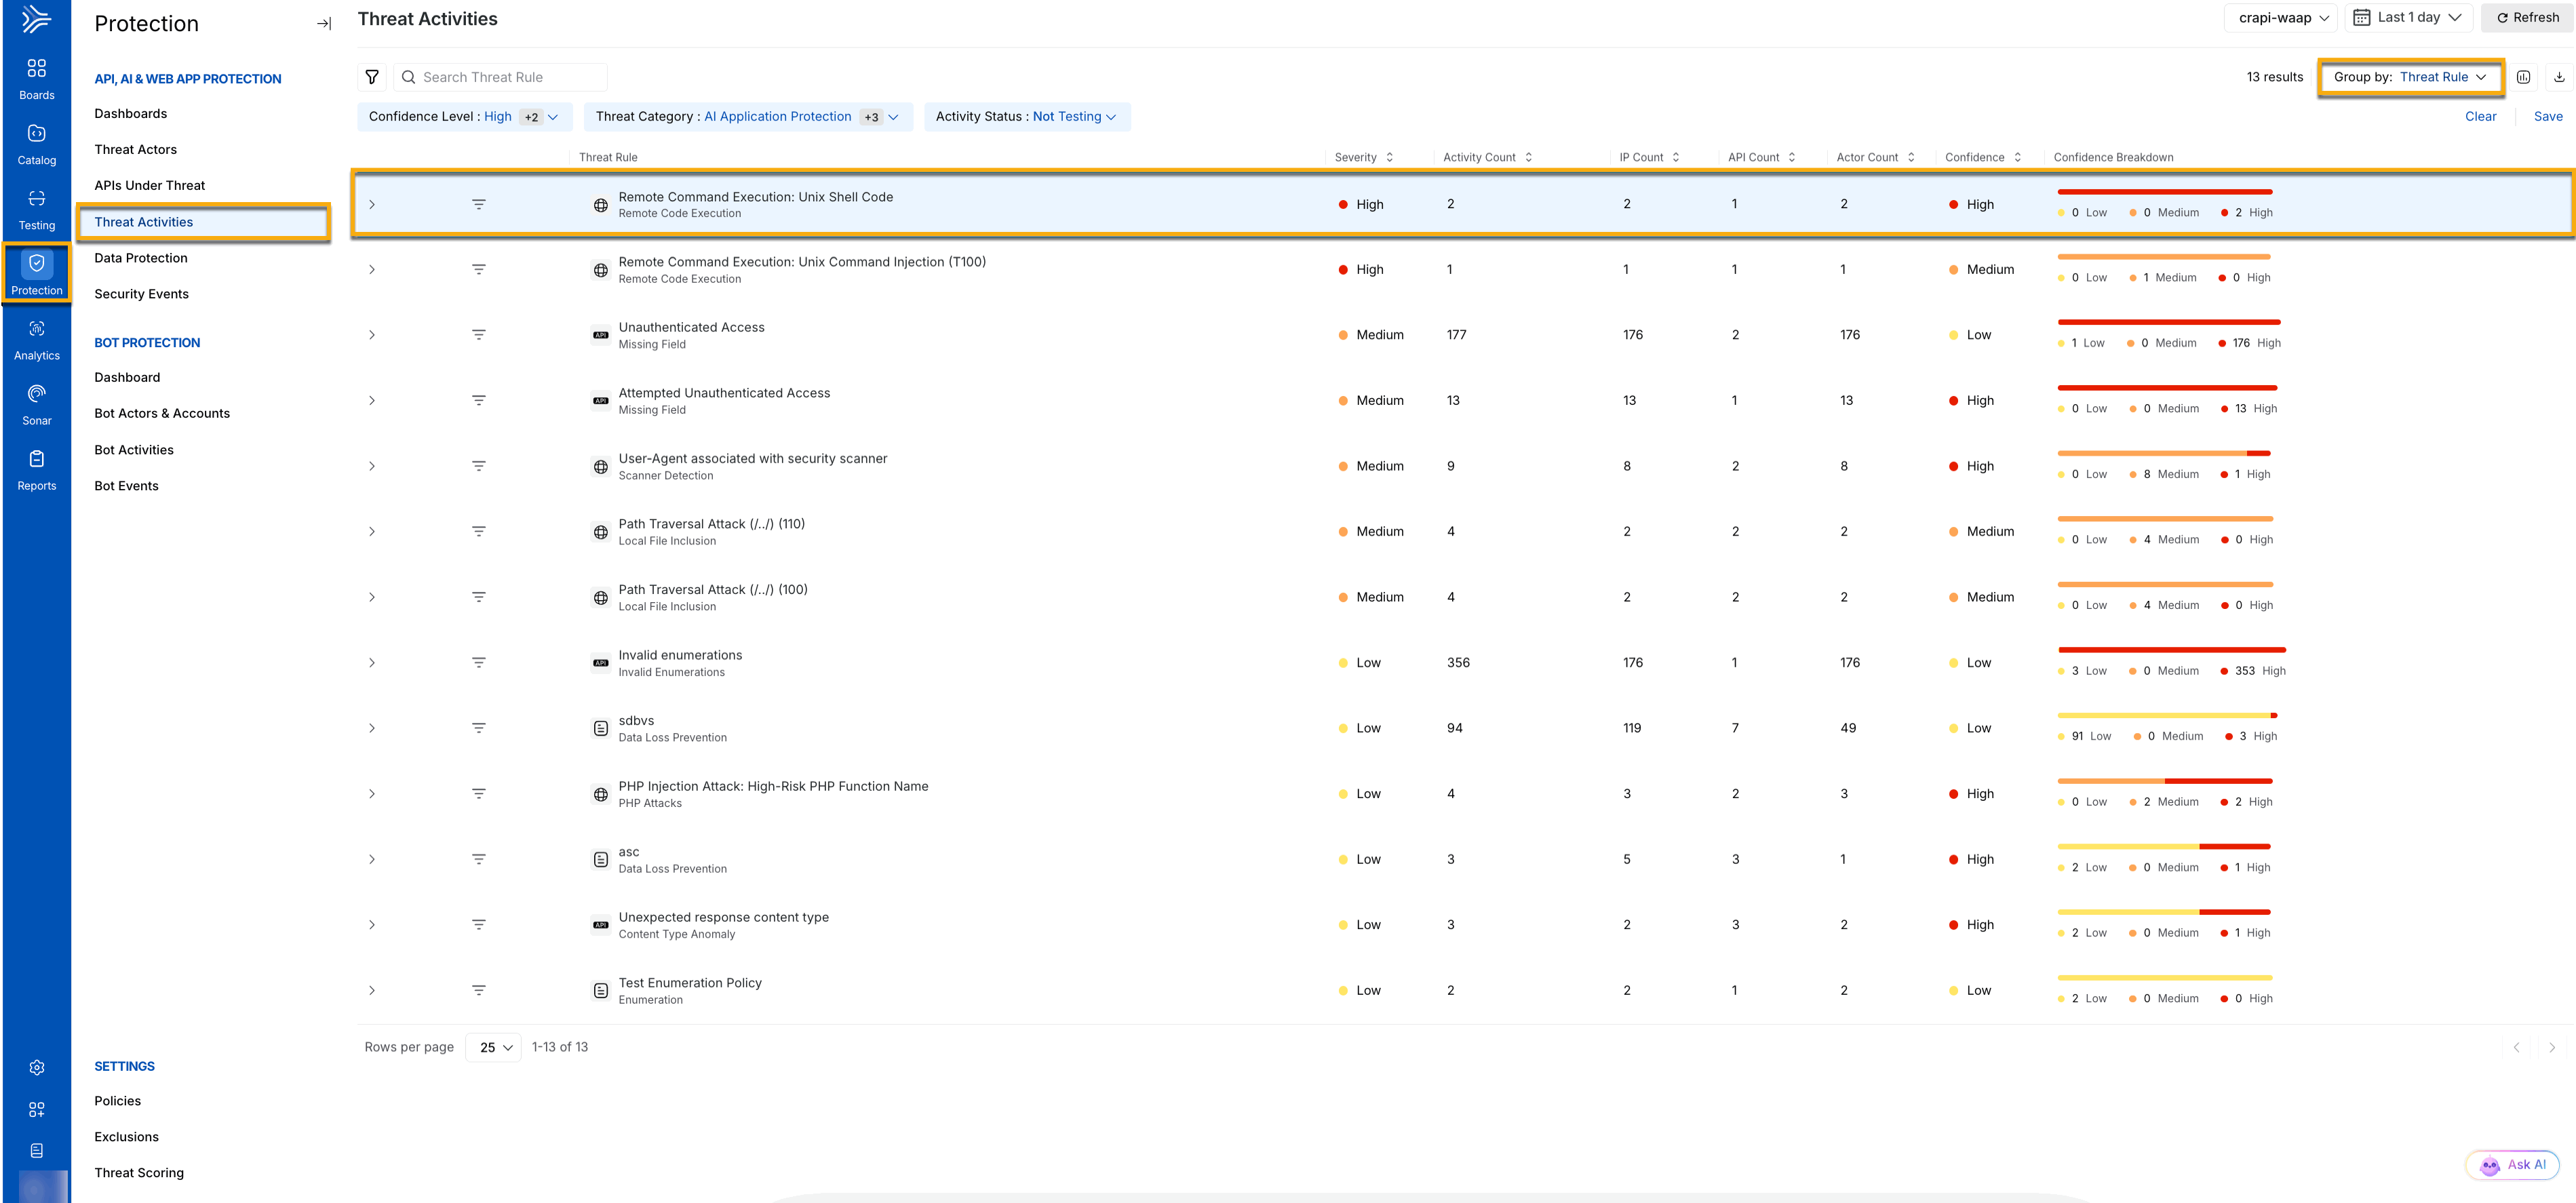
The Severity Indicators, Activity Count, IP Count, API Count, and Actor Count components are visible only when you group the threats using either of the below criteria.
Group by Endpoint — This helps you identify the threat patterns targeting specific parts of your infrastructure.
Group by Threat Rule — This helps you determine if multiple similar threats, such as Remote File Inclusion attacks, are occurring across different endpoints, indicating a possible targeted campaign.
Note
The Threat Details tab appears only when the rules are grouped by Threat Rule (default).
Group by Actor — This helps you identify if the same actor or IP address is responsible for multiple attacks, enabling teams to take decisive actions such as blocking IPs or adding users to watchlists.
Group by Domain or Service — This helps you provide insights into the specific services or domains that are under attack, aiding in the identification of high-risk assets.
Group by Threat Categories — This helps you provide the type of threat categories, such as API Protection, Web Application Protection, or Custom Policies.
Severity Indicators — Each threat is accompanied by color-coded labels, such as Low, Medium, High, and Critical, enabling you to quickly assess its urgency. This is helpful as it gives teams a way to prioritize threats based on risk, focusing on high-severity threats that may require immediate action, while lower-severity threats can be addressed as part of routine maintenance.
Activity Count — Displays the total number of threat activities observed for the grouped attribute. This is helpful as it provides teams with a way to prioritize threats based on the count, focusing on higher activity counts that may require immediate attention.
IP Count — Displays the total number of IPs Traceable observed for the grouped attribute. This is helpful as it provides teams with a way to prioritize threats based on the count, focusing on groups with higher IP counts, as they may require immediate action.
API Count — Displays the total number of APIs under attack as part of the grouped attribute. This is helpful as it provides teams with a way to prioritize threats based on the count, focusing on groups with higher API counts, as they may require immediate action.
Actor Count — Displays the total number of threat actors that Traceable discovered as part of the grouped attribute. This is helpful as it provides teams with a way to prioritize threats based on the count, focusing on groups with higher actor counts, as they may require immediate action.
Navigating the Threat Activity Flow
When you first land on the Threat Activities page, you are presented with a list of detected threats, displaying key information like rule, endpoint, and source. The grouping and filtering options enable you to narrow your focus by grouping threats according to criteria such as actor, endpoint, or domain. After applying these groupings, you can drill down into a specific threat to view more detailed information, including an event timeline, impact, an attack description, and suggested mitigation steps.
You can view the evidence for a threat for deeper investigation, as it provides critical data such as request/response logs, actor information, IP reputation, and event timestamps. The evidence page is divided into sections that provide raw data and other details to help you understand the attack’s structure and intent.
1. Main Threat Activity Dashboard
When you first land on the Threat Activities page, you can see a comprehensive dashboard that lists all ongoing or recent threats detected within the environment. This dashboard serves as the central hub where you can:
Threat Activity Dashboard
View listed threats — Each threat is presented with details such as its rule (for example, Remote File Inclusion), the targeted endpoint, the actor, and severity, for example, Low, Medium, or High.
Group and filter — You can group the data based on categories such as Threat Rule, Actor, Endpoint, Service, or Domain. These groupings enable you to focus on specific areas of interest, such as threats targeting particular endpoints or actors with suspicious IP reputations.
2. Drilling Down into a Specific Threat on an Individual Level
After choosing how to group or filter the threats, you can drill down into a specific threat for a more granular view. Click on a particular threat rule for a detailed view. This flow is essential for pinpointing the nature and severity of a particular threat:
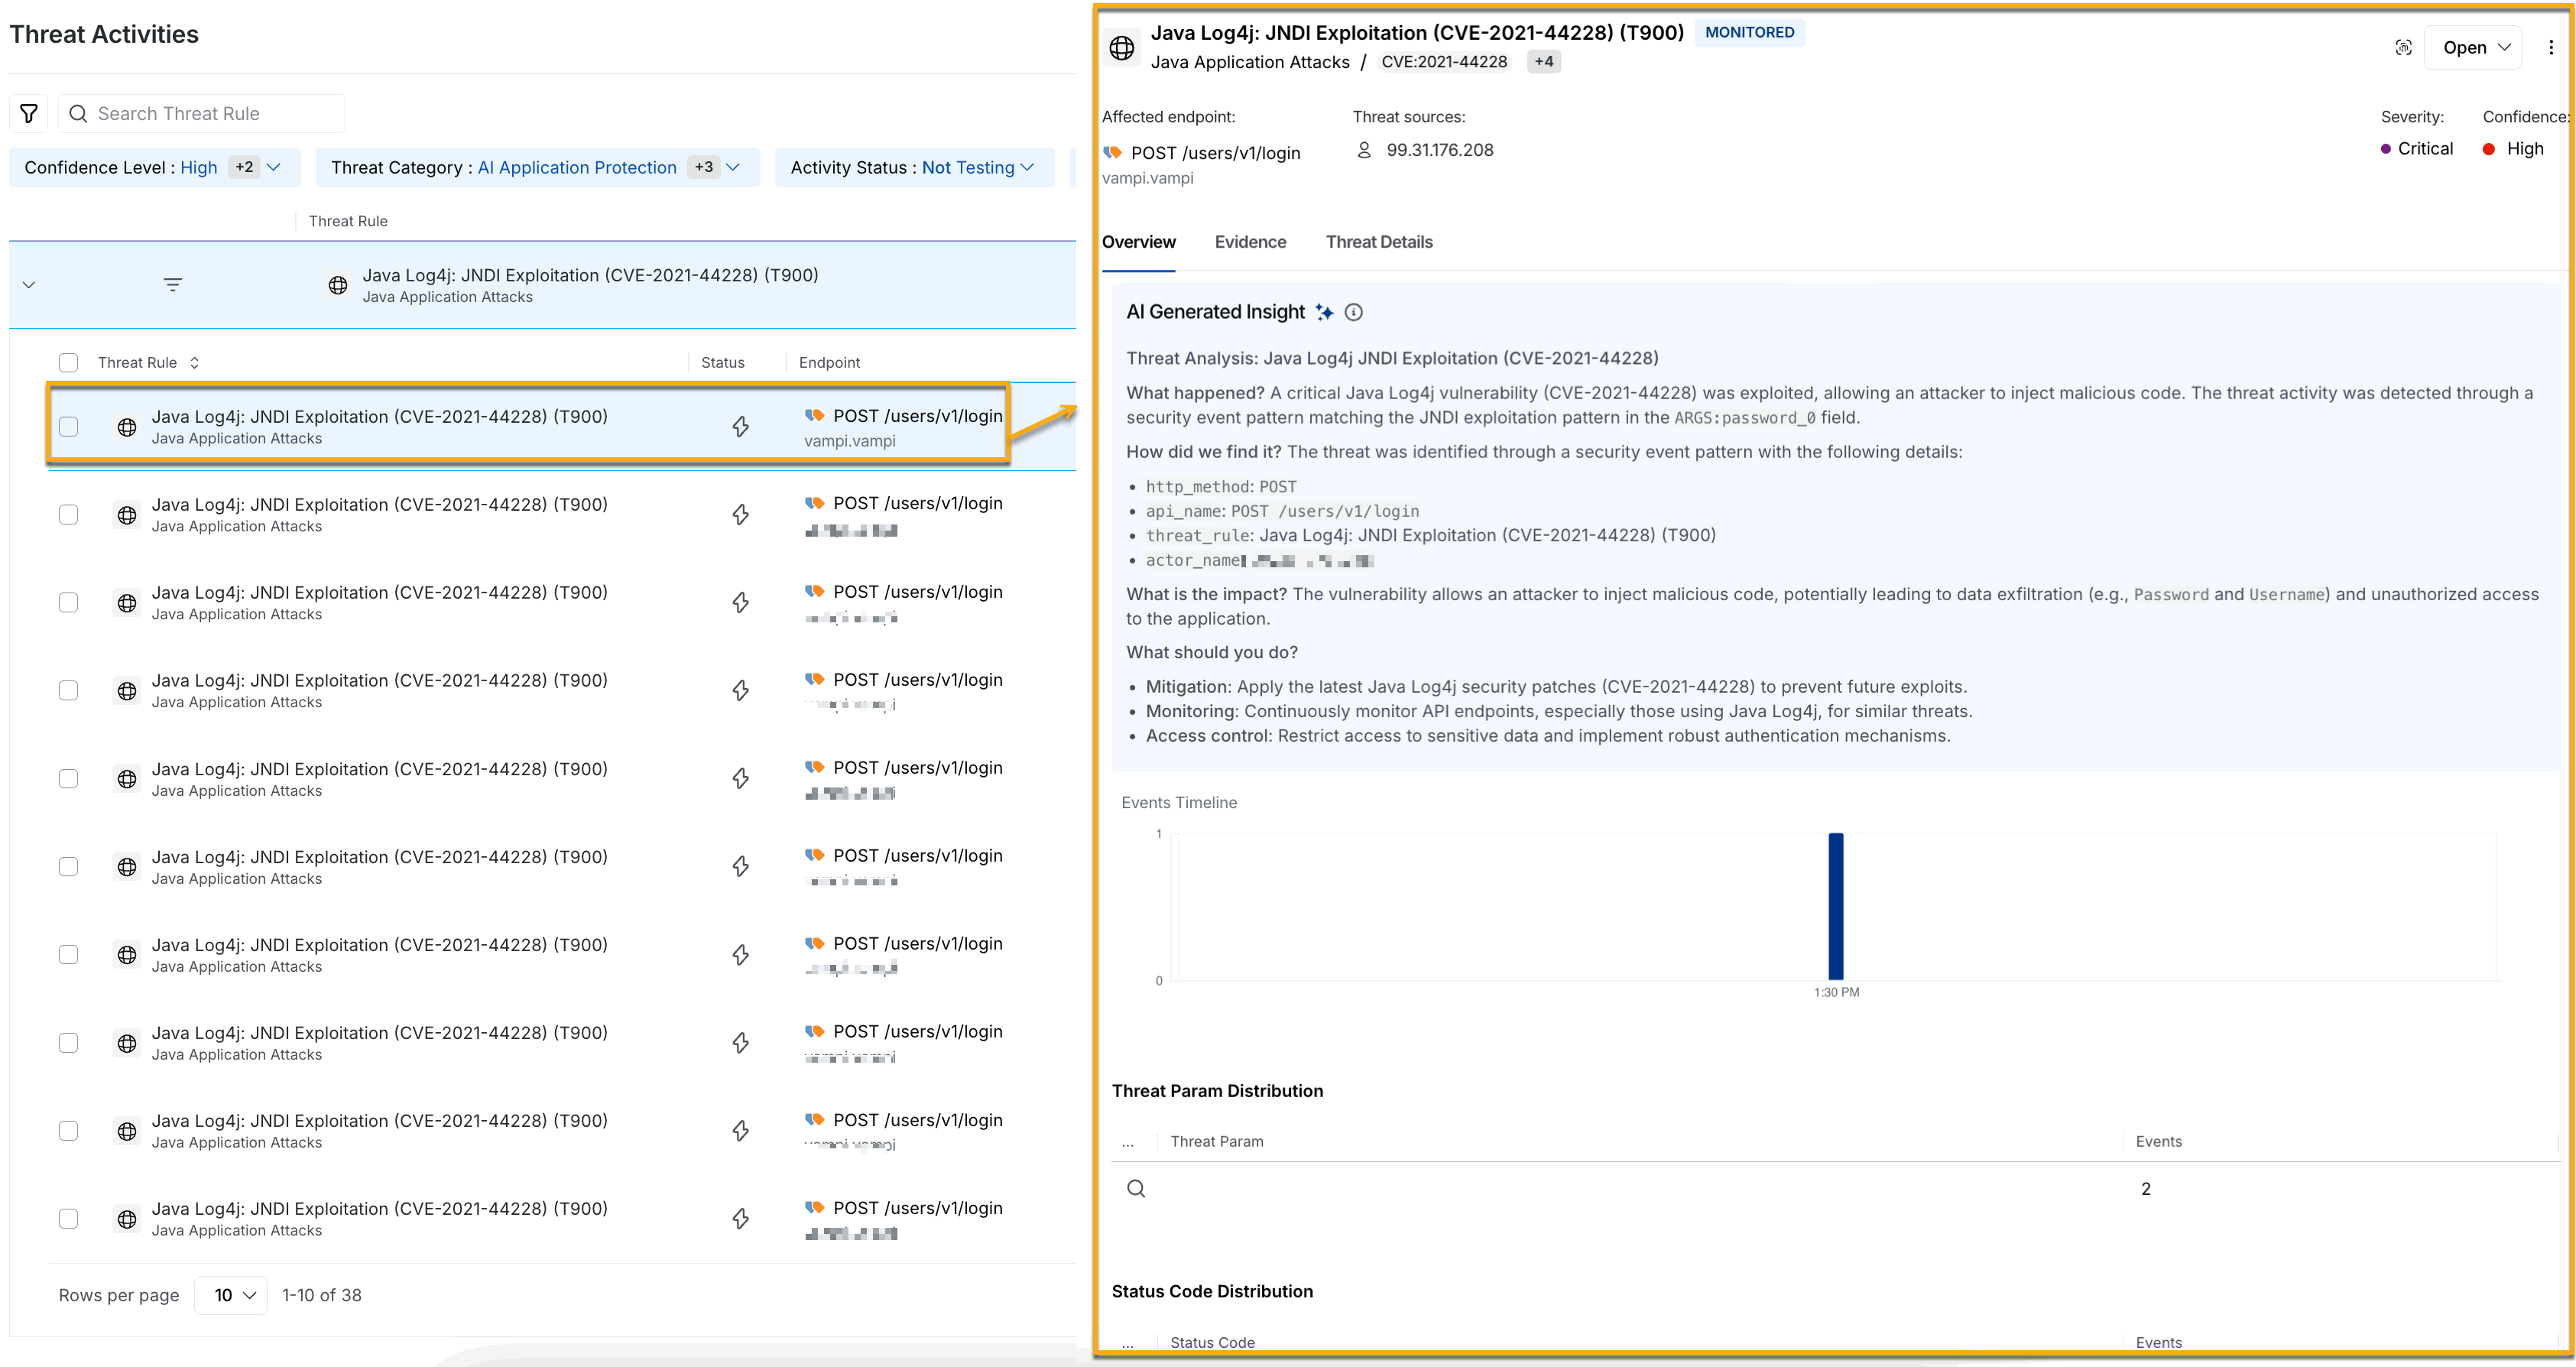
Threat Activity Drill Down on an individual level
The threat rules on an individual level additionally highlight the affected endpoints, threat sources, severity, and confidence of the affected rule. It also highlights an AI Generated Insight of the threat detected and provides information such as how it was found, its impact, and what you should do to handle this threat in the Overview tab.
Note
To enable the AI generated insights for threat activity, navigate to Settings → AI Features, and enable the toggle as shown below.
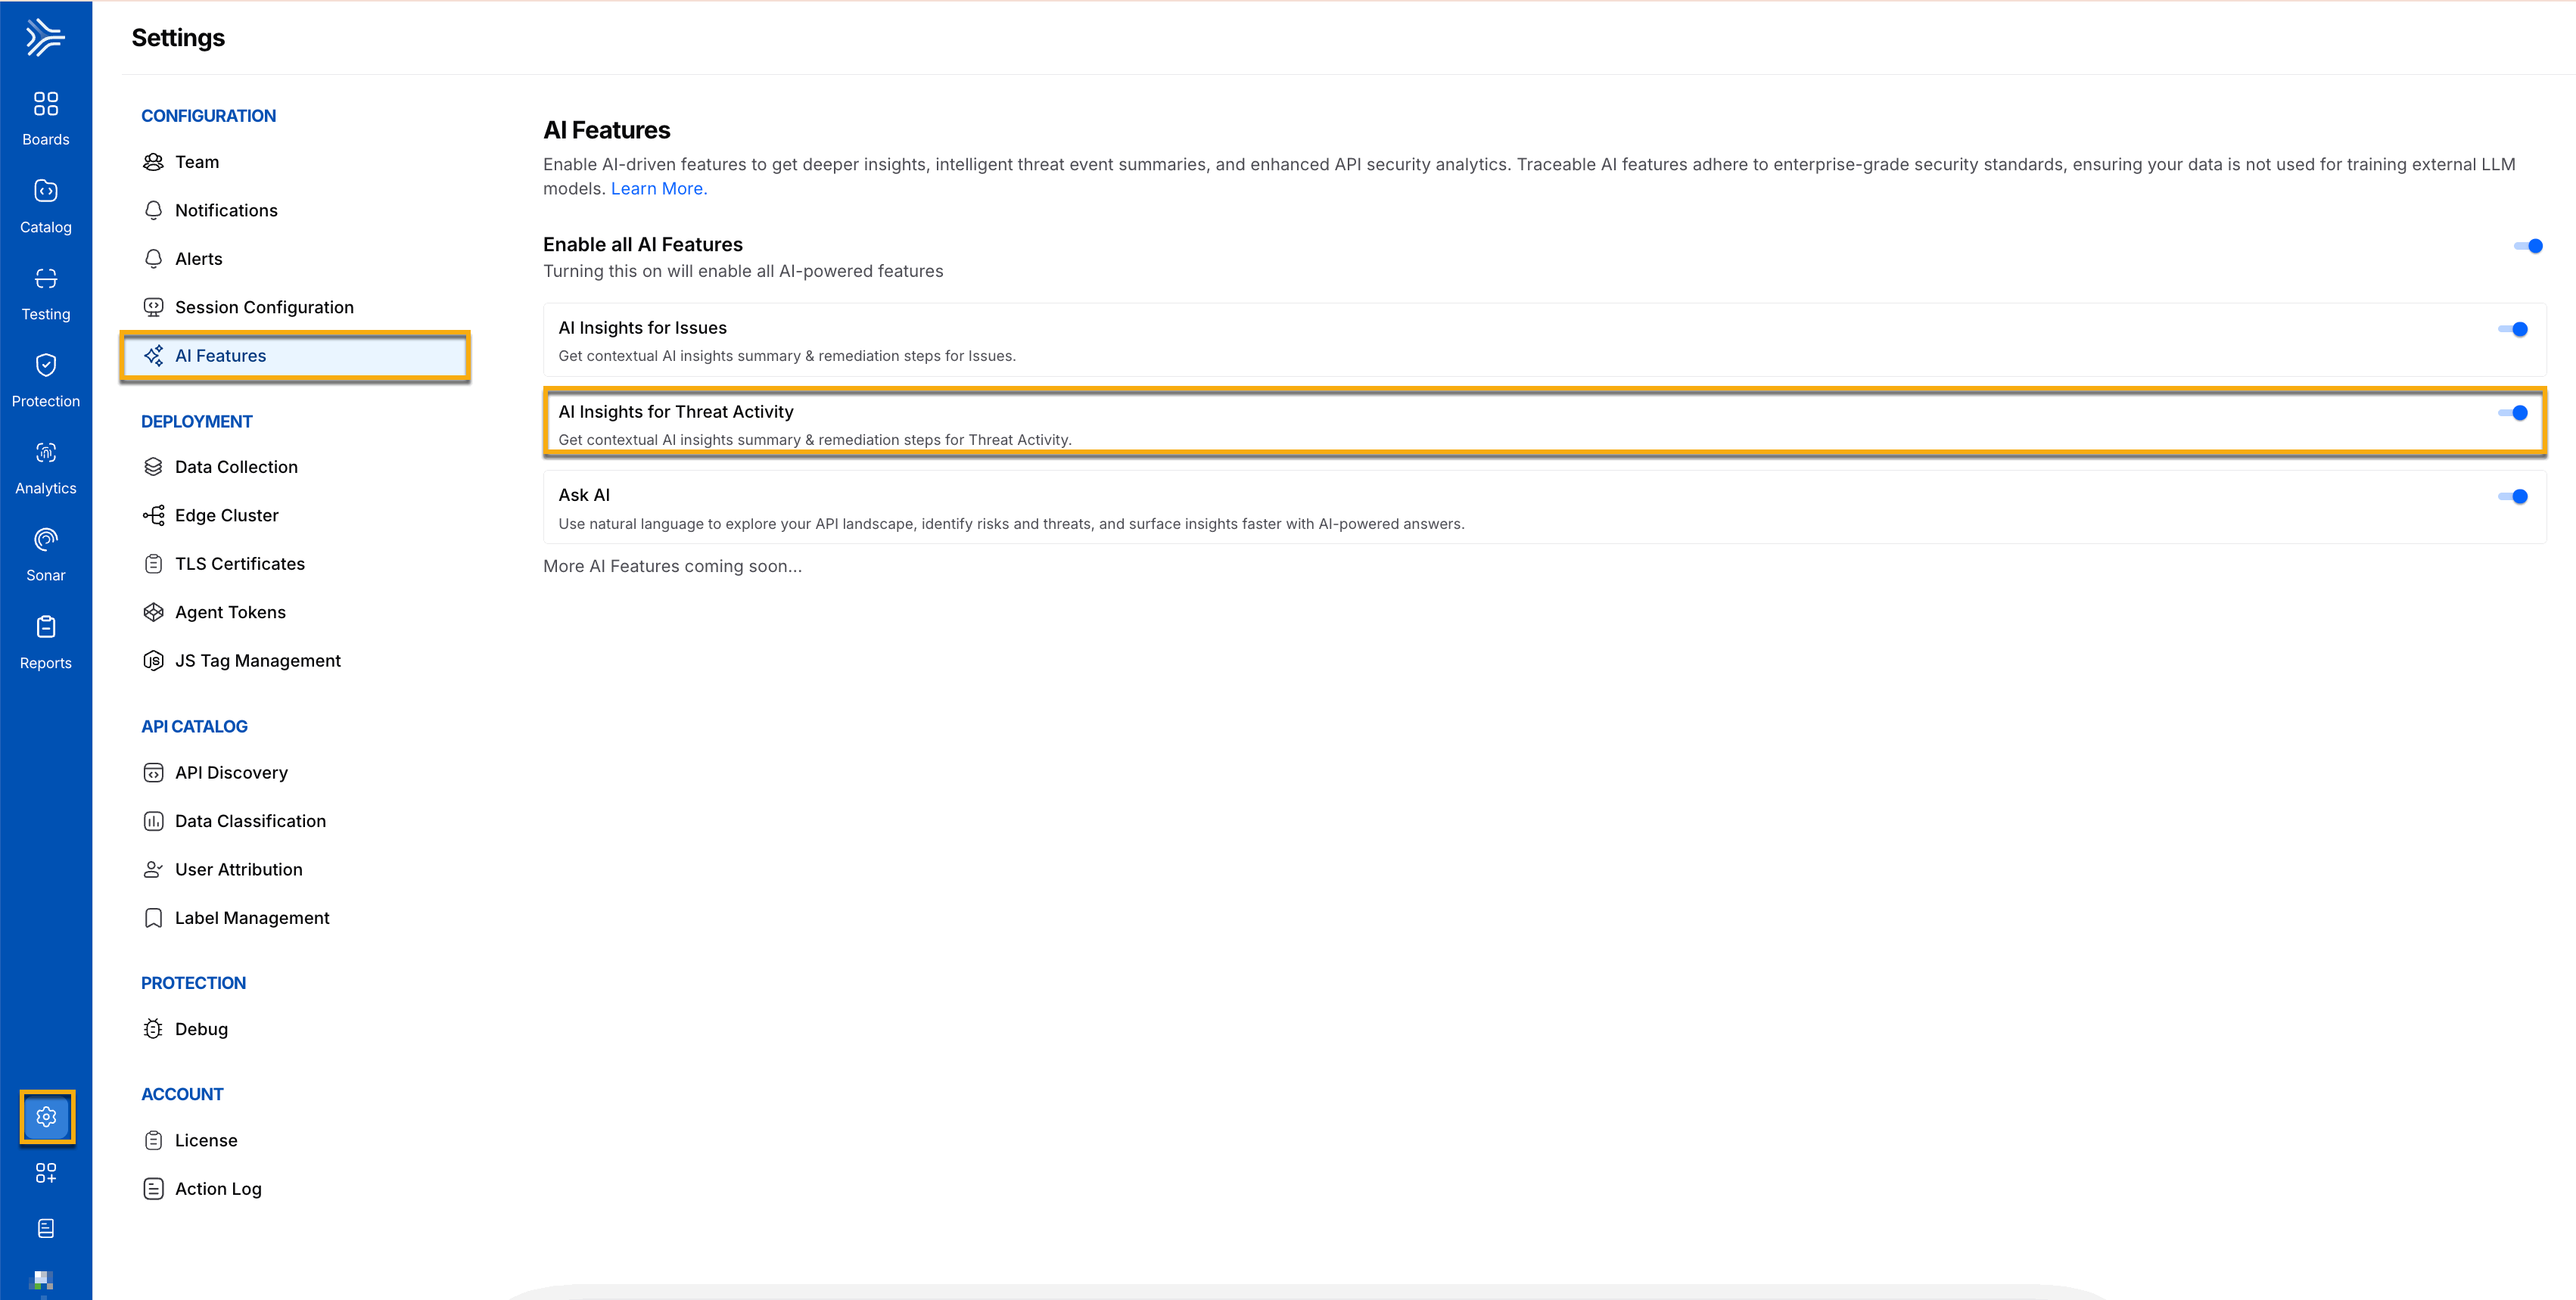
AI Generated Insights Toggle for Threat Activities
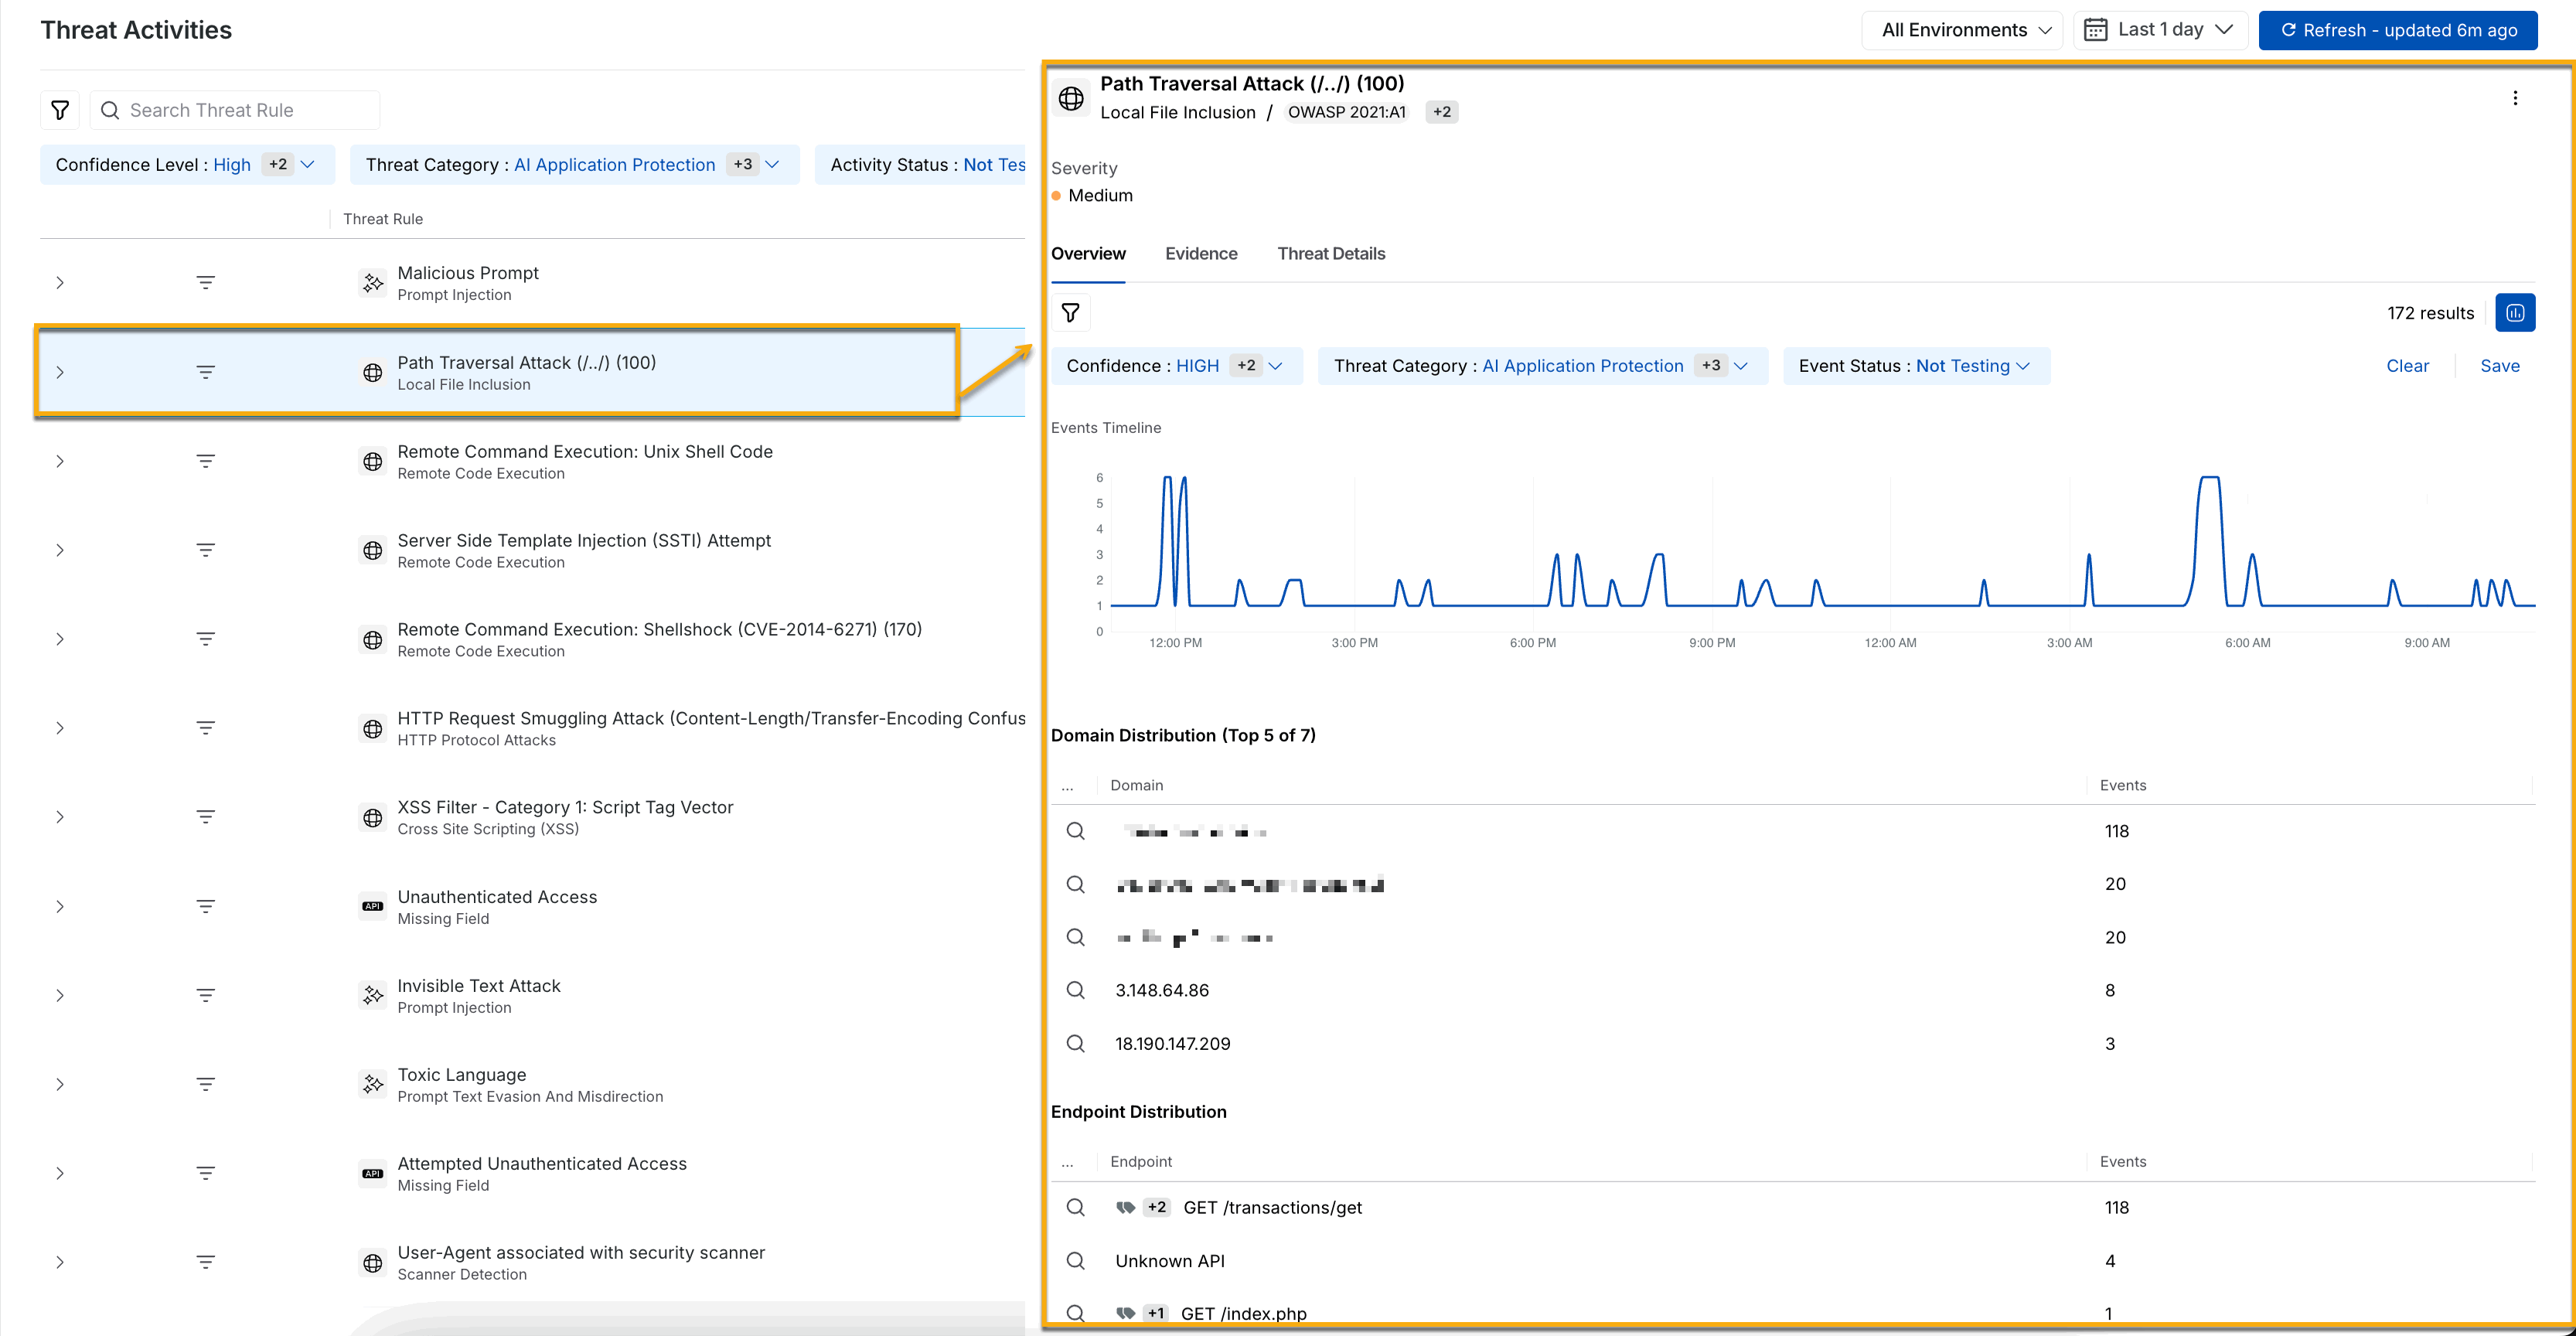
Selecting a threat — Once a threat is identified from the list, you can click the particular threat to access detailed information, including its sources, endpoint, and time of occurrence.
Event Timeline — The slide-out panel displays the Events Timeline, which visualizes when the malicious activity occurred, helping you understand whether it is an isolated incident or part of a more significant attack.
Distribution — You can view the Domain Distribution, Endpoint Distribution, Threat Param Distribution, and Actor Distribution for the threat rules at a group-by-level.
Threat Activity Indicator — You can mark a threat activity to indicate its current status. This is helpful as you can use these indicators to filter threats later. For example, retrieving all threat activities marked as False Threat in the past 1 week. You can choose among the following indicators from the drop-down corresponding to the Evidence button:
Open — Default status of all alerted threat activities.
Blocked Threat — Threat status of all blocked threat activities, which cannot be changed.
Under Review — Threat status of all activities under review by the security team in your organization.
False Threat — Threat status of activities marked as a false positive.
Accepted Threat — Threat status of activities accepted as valid threats.
Actionable Threat — Threat status of activities you believe are actionable at your end.
Note
You can change the status of a threat activity any number of times, except the ones marked as Blocked Threat.
3. Drilling Down into a Specific Threat on a Group By Level
You can also choose to view the detailed overview of the threat at a group-by level in the slide-out panel. The threat rules at a group by level show the threat actor distribution with the IP addresses (Actors) and their corresponding events in the slide-out panel for all the group by attributes except for group by actor.
.png)
Threat Activity group by filters
If you wish to see the threats on a group by level, such as Group by Threat Rule (default), you can select the appropriate group by attribute from the drop-down as shown above. To view detailed information in the slide-out panel, click any particular grouped threat rule.
Threat Activity Drill-down grouped by threat rules (default)
Traceable allows you to group your threat rules based on threat categories, such as AI Application Protection, API Protection, Custom Policies, and Web Application Protection, as shown below.
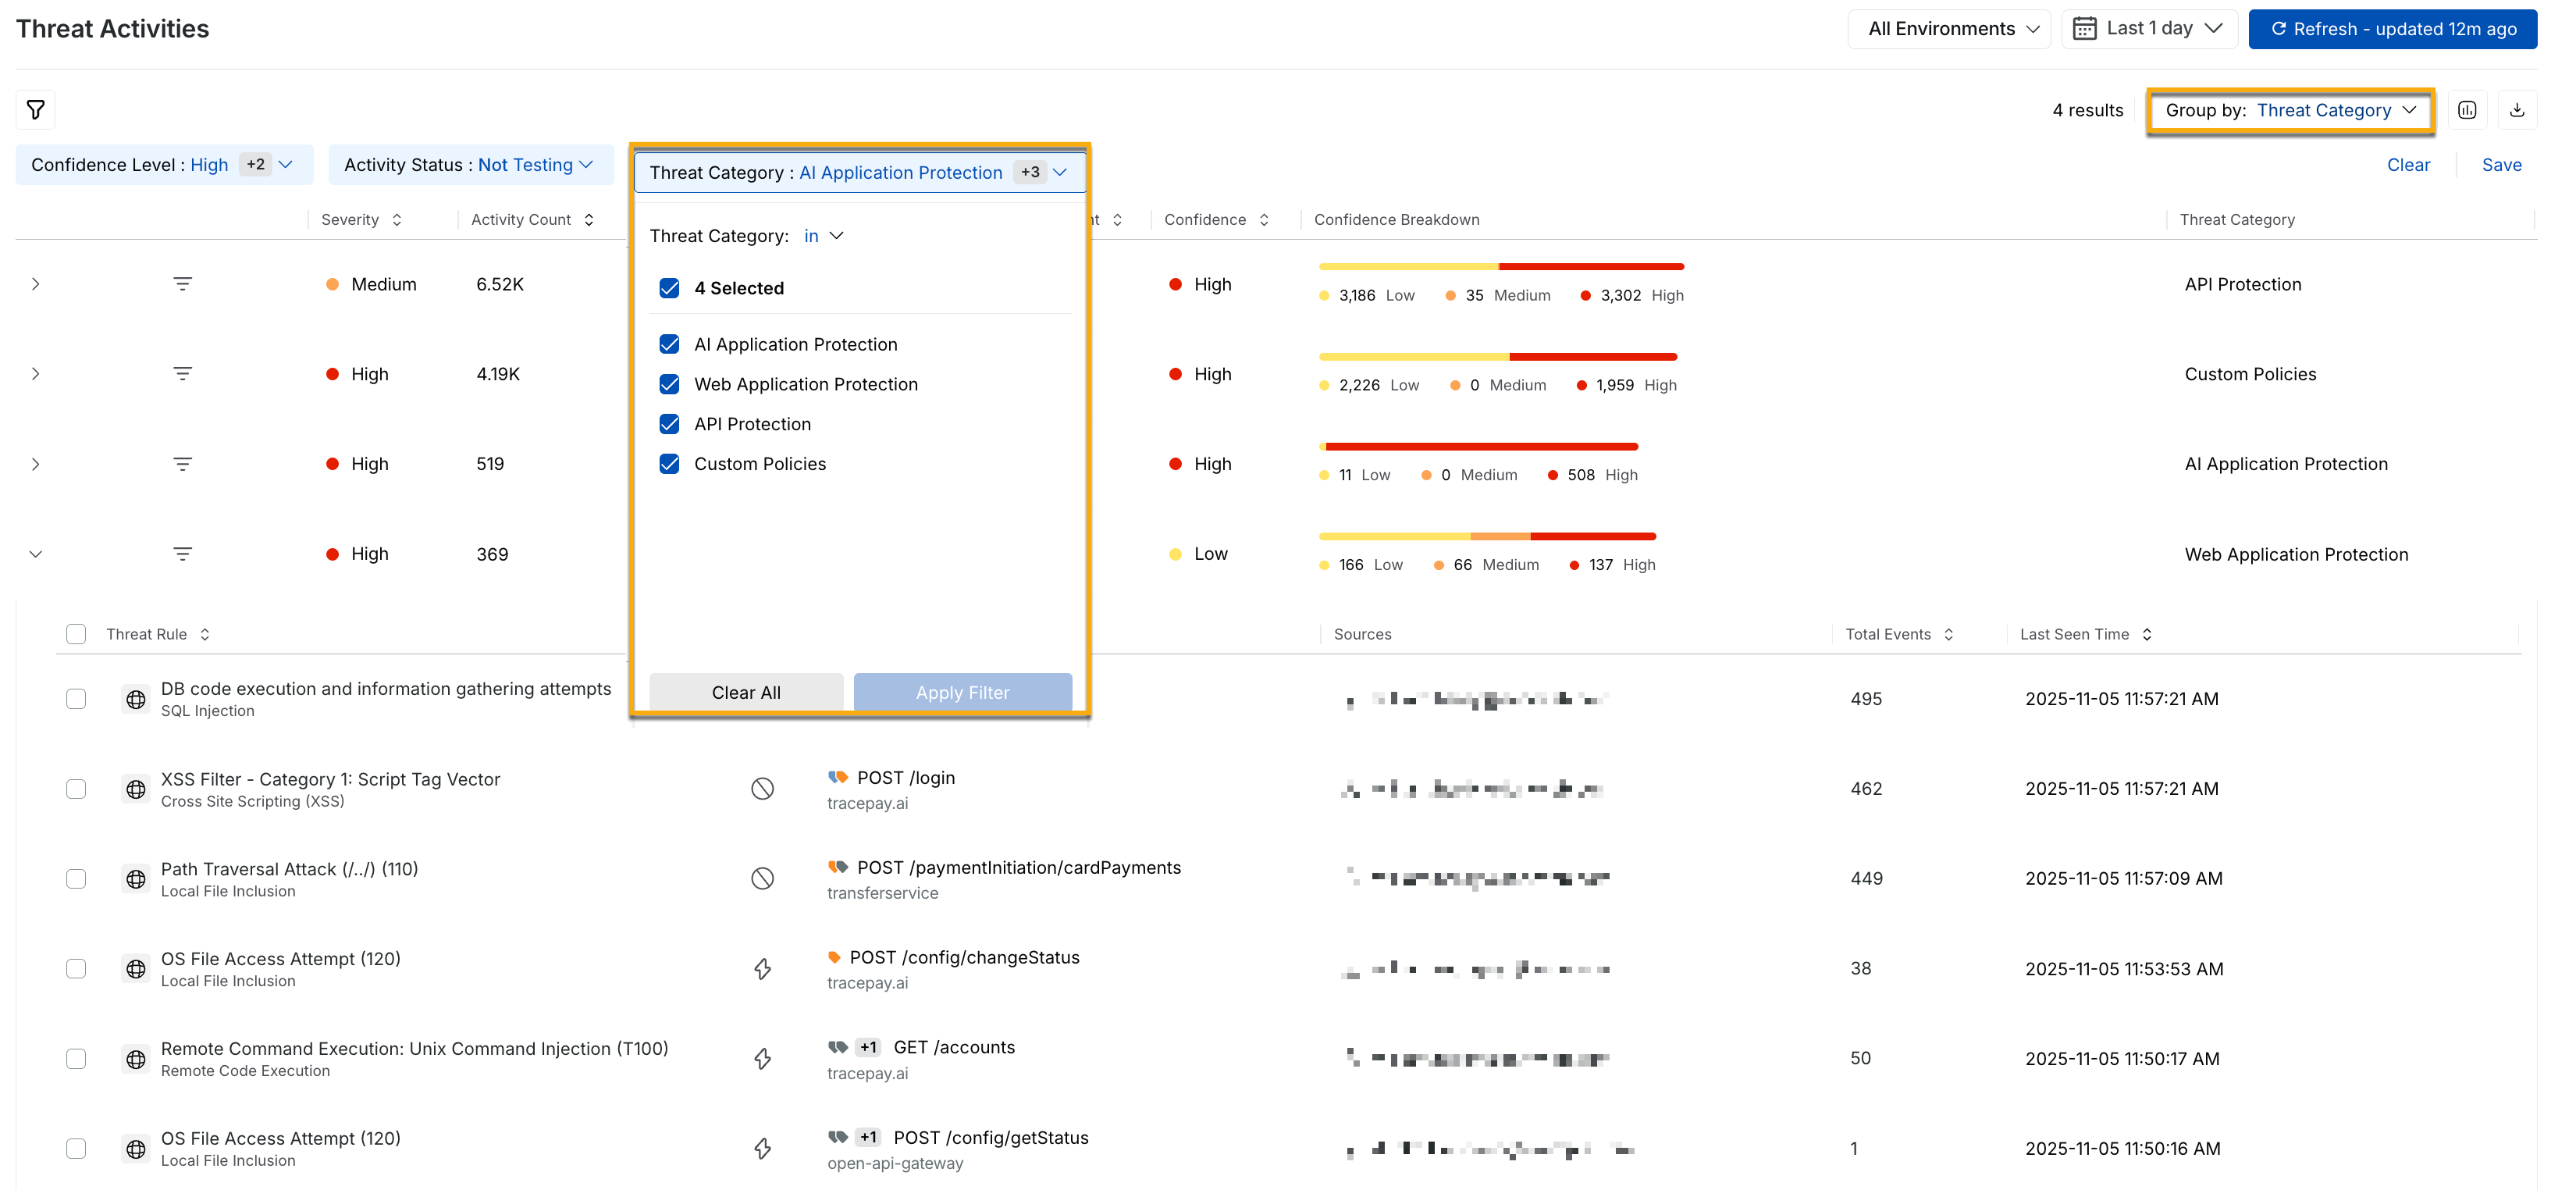
Threat activity drill-down grouped by threat category
When you click a particular threat rule grouped on the basis of Threat Categories, it is now segregated into the four above-mentioned threat categories. The slide-out panel shown below, for example, highlights the threat category API Protection and its various distributions, including Domain, Endpoint, Threat Rule, Threat Param, Actor, and Status Code.
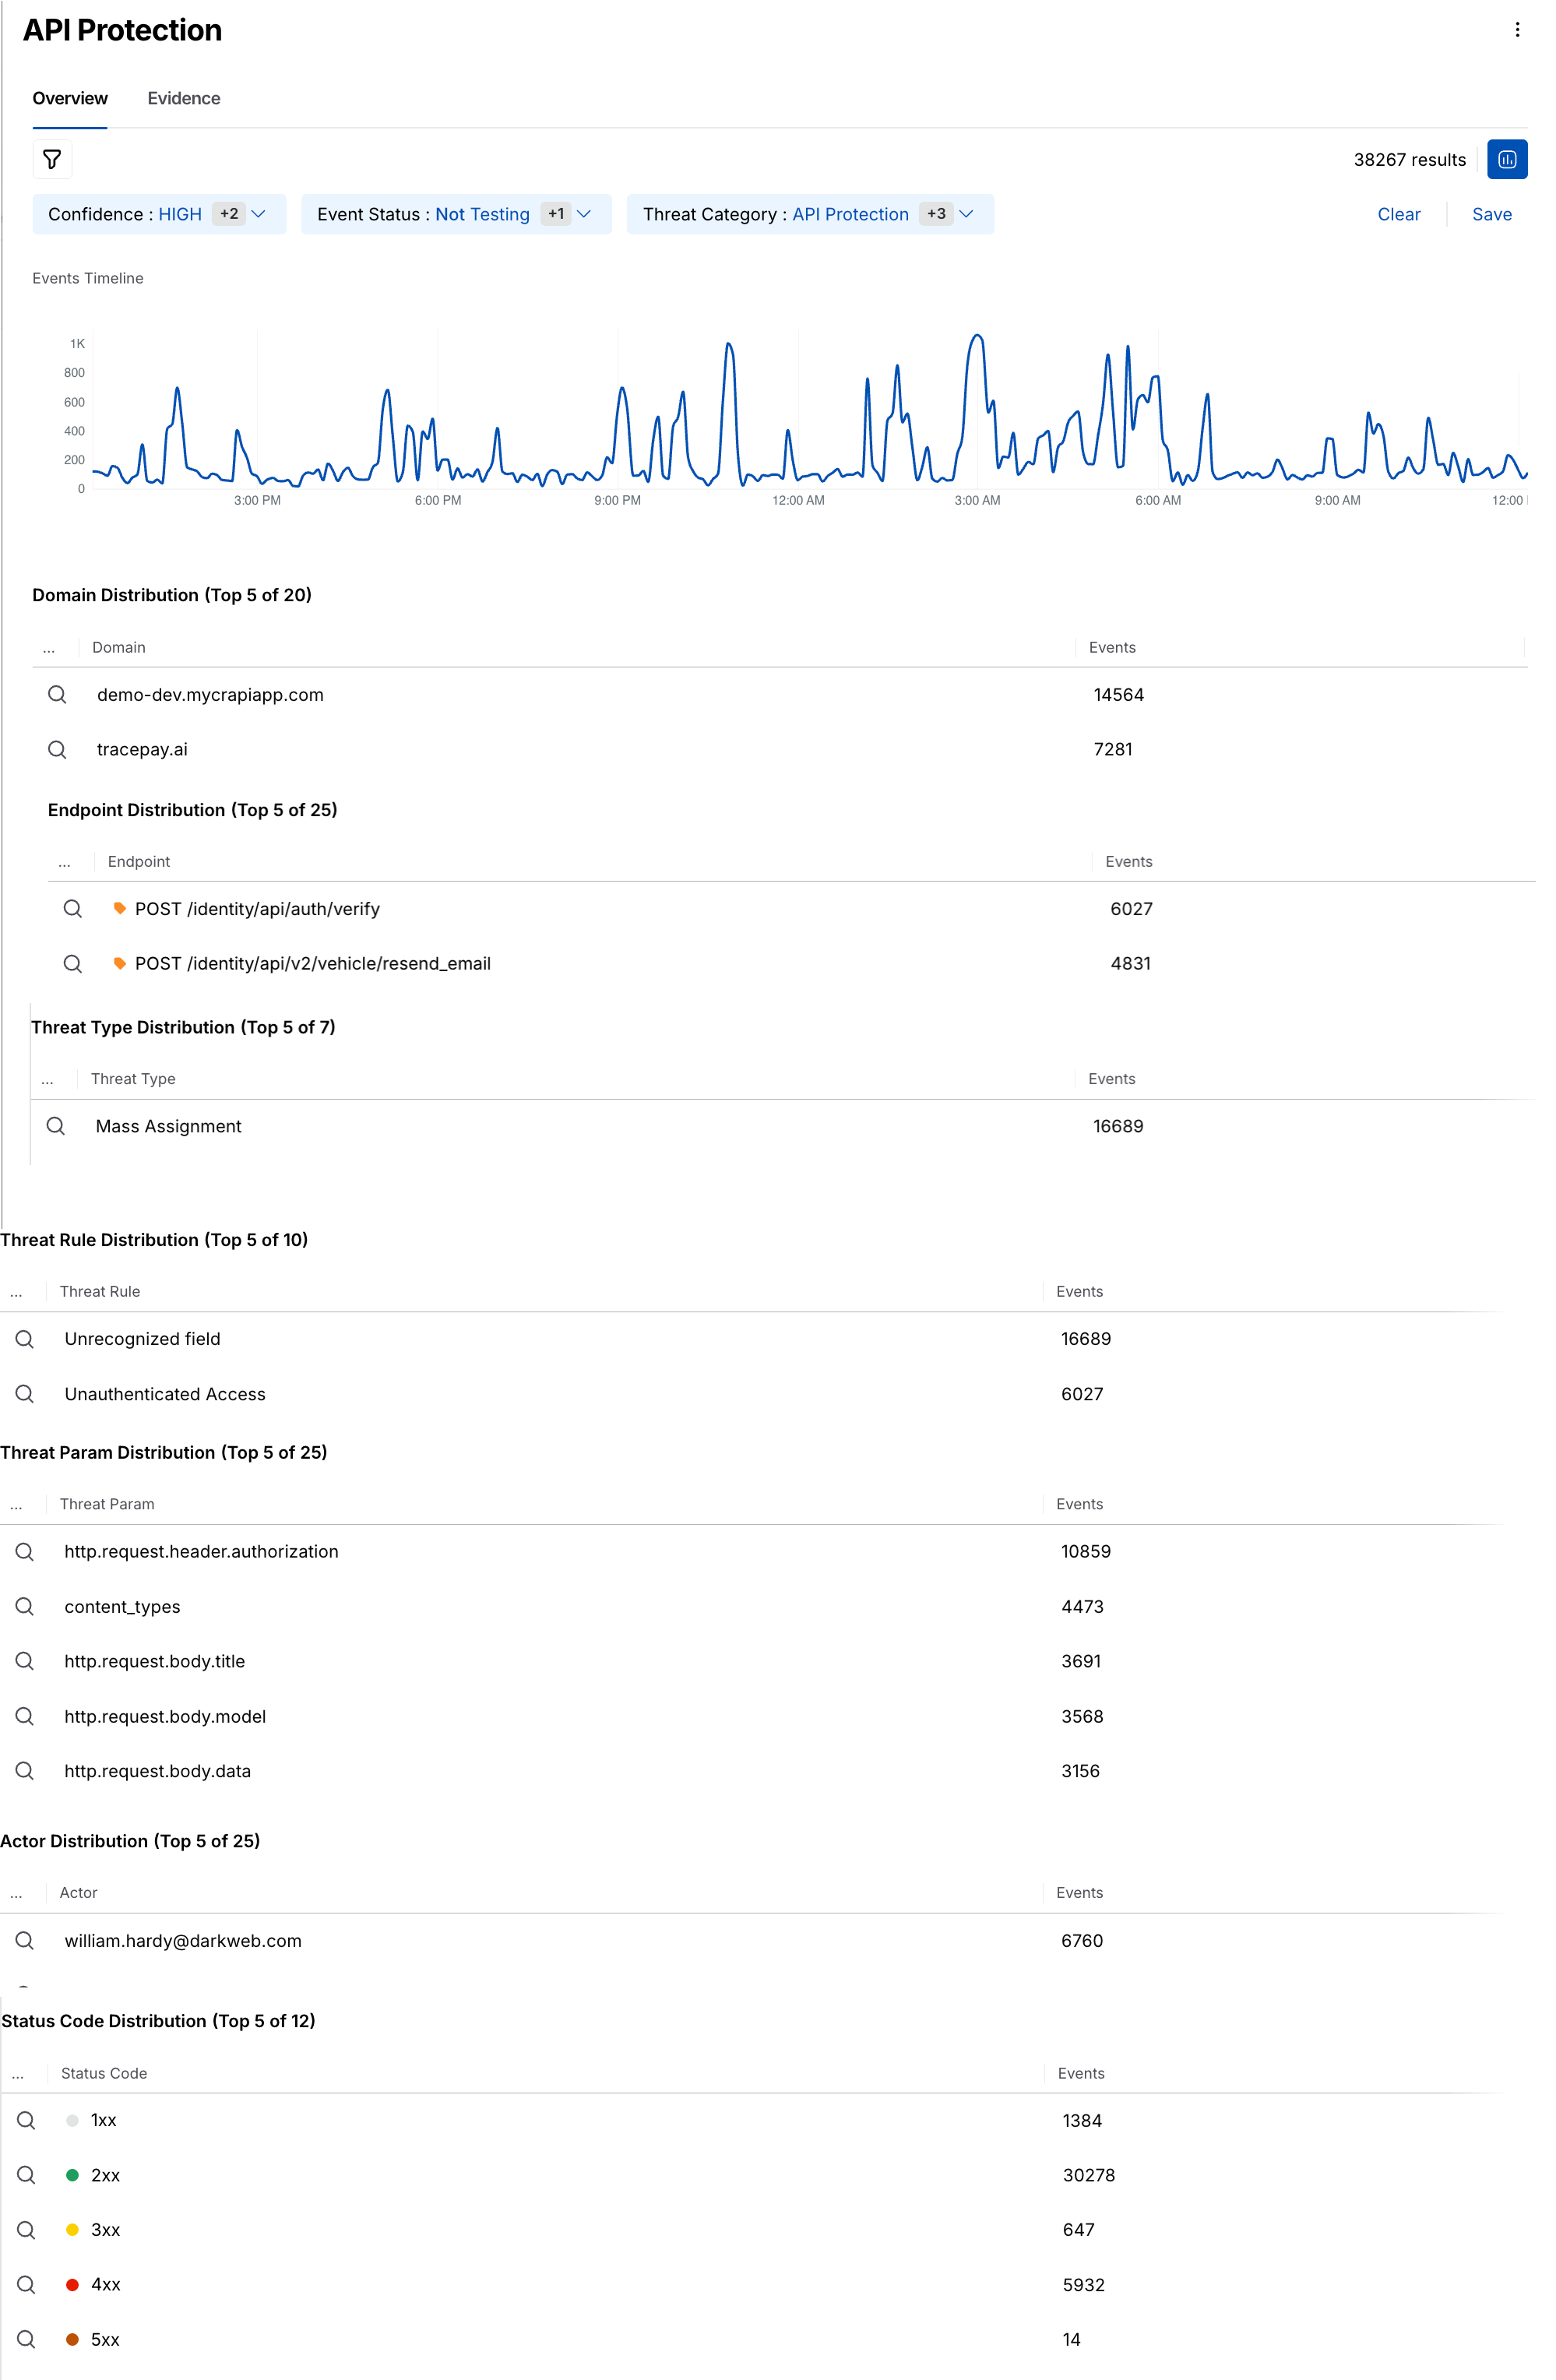
API protection Overview
Similarly, you can group your threat rules on the basis of endpoints, domains, services, threat actors, and view the details of each grouped type in the slide-out panel that opens when you click the grouped threat rule, according to your requirements.
4. Viewing the Evidence
After drilling down into a specific threat, the next step involves examining the Evidence associated with the attack. By switching to the Evidence tab, you gain access to critical data that allows you to assess the severity of the incident and plan an appropriate response:
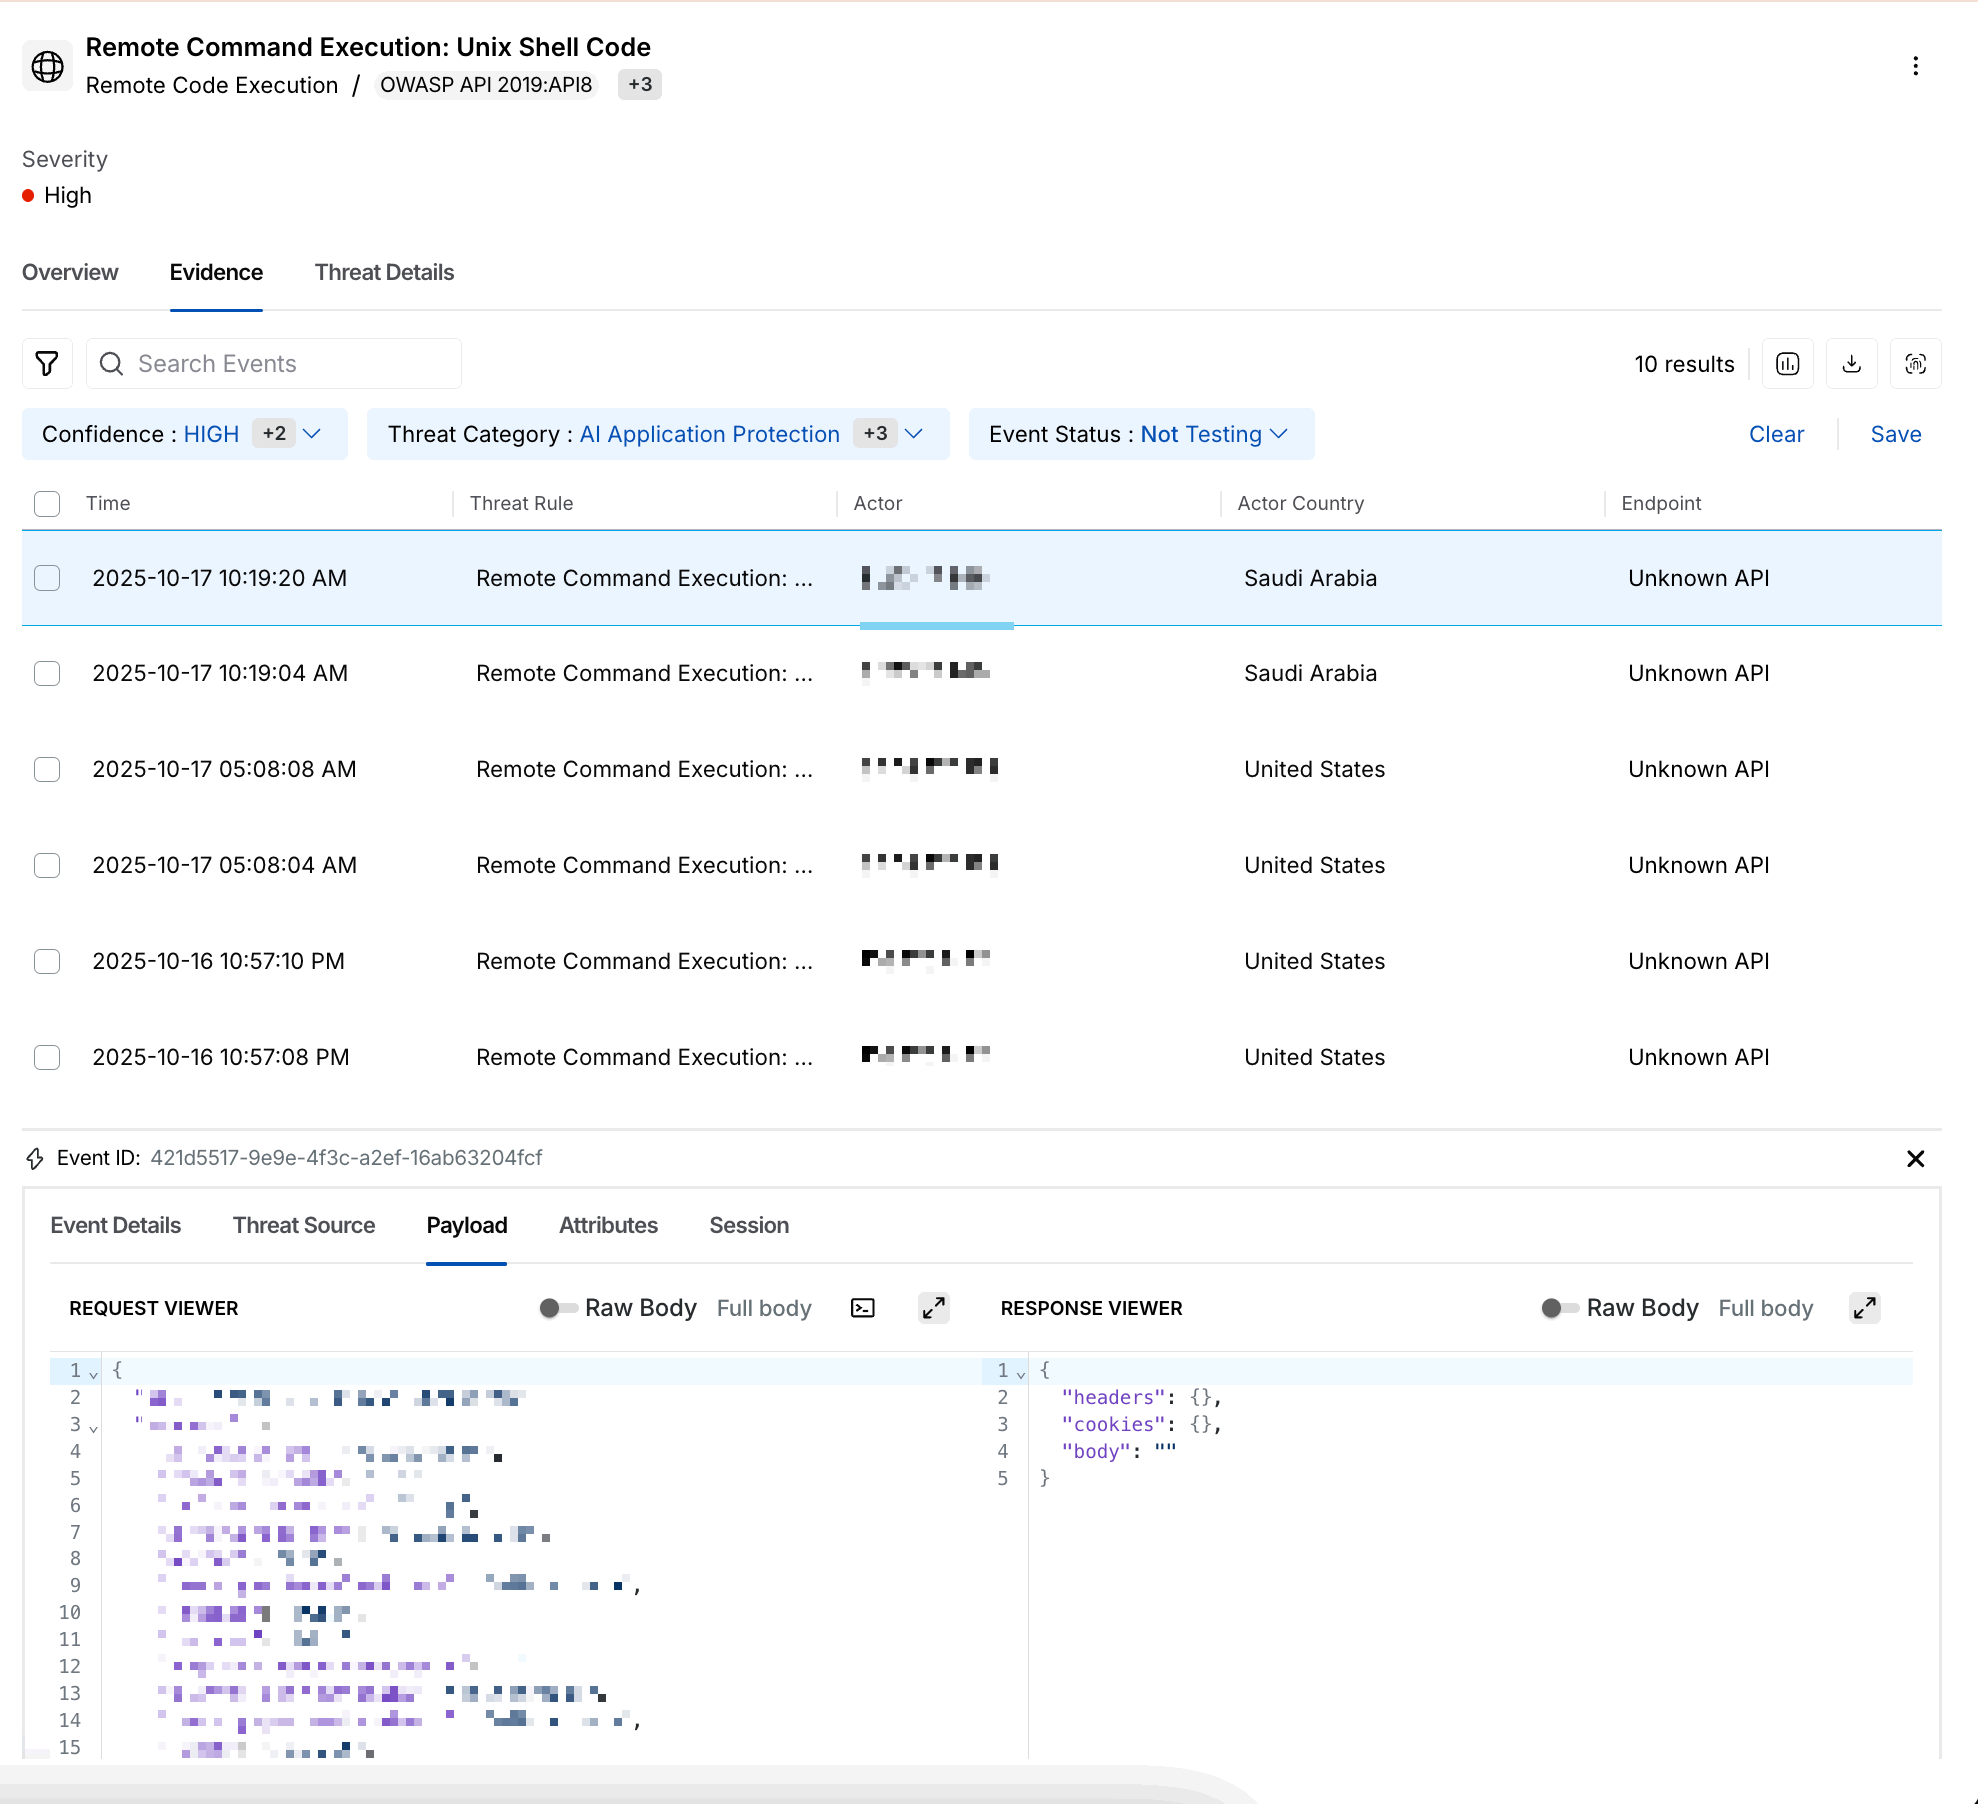
Threat Activity Evidence
Columns of Interest:
Time — Displays the time at which the param key triggered the threat.
Threat Rule — Provides the name of the threat rule that was detected.
Actor — Provides the identity or user responsible for the threat, for example, an email address or user ID.
Actor Country — Provides the country of the threat actor from where it is detected.
Endpoint — Provides the endpoint of the API that is detected under threat actors.
Service — Indicates the service name monitored or integrated with Traceable.
Event ID — Provides the unique ID generated for each event generated for that threat rule.
Additional Event Information:
Event Details — Lists unique identifiers like Event ID and Span ID for tracking purposes.
Threat Source — Provides detailed information on the attack's origin, such as IP address, domain, and actor.
Payload — Provides the detailed description of the following:
Request Viewer — This section displays the raw request associated with the threat. You can view all aspects of a request, including the URL, headers, query parameters, and body. This data is crucial for understanding how the attack was structured.
Response Viewer — This section displays the server’s response to the malicious request, including error messages or status codes. If the request was unsuccessful, the response data helps determine how the server reacted.
Attributes and Session — These tabs provide additional context by displaying metadata and information on related session activity, which helps track the attacker’s movements across the system.
Additionally, you can also do the following for each evidence:
Update Threat Status — You can update a threat’s status according to your requirements, for example, Open to False Threat. To do so, click the Status drop-down in the page’s top right corner and select the desired status.
Create an Exclusion Policy — You can create an exclusion policy for a specific threat activity to prevent it from being detected in the future. To do this, click the Ellipsis (
 ) icon in the page’s top right corner and click Exclude. Further, in the confirmation window, click Acknowledge, and in the Create Exclusion Policy window, specify the configurations and click Save Policy. For more information on these policies, see Exclusions.
Ticket Management — You can create and manage tickets using Jira (
 ), Azure DevOps, or ServiceNow ITSM for the same group of threat rules under different timestamps. For more information, see Project Management.
View Visualization — You can view the Events Timeline for the evidence, which visualizes the malicious activities over the selected time range. To view the graph, click the Visualization (
.png) ) icon in the page’s top right corner.
) icon in the page’s top right corner.Download Data — You can download the data displayed on the page in CSV format. To do so, click the Download (
.png) ) icon in the page’s top right corner and specify the number of rows you wish to download.
) icon in the page’s top right corner and specify the number of rows you wish to download.View Rule Triggers — You can view the Rule Triggers and their corresponding details based on the threat activity ID, in the Security Events page under Rule Triggers. To view this data, click the View Rule Triggers (
 ) icon in the page’s top right corner. For more information, see Security Events.
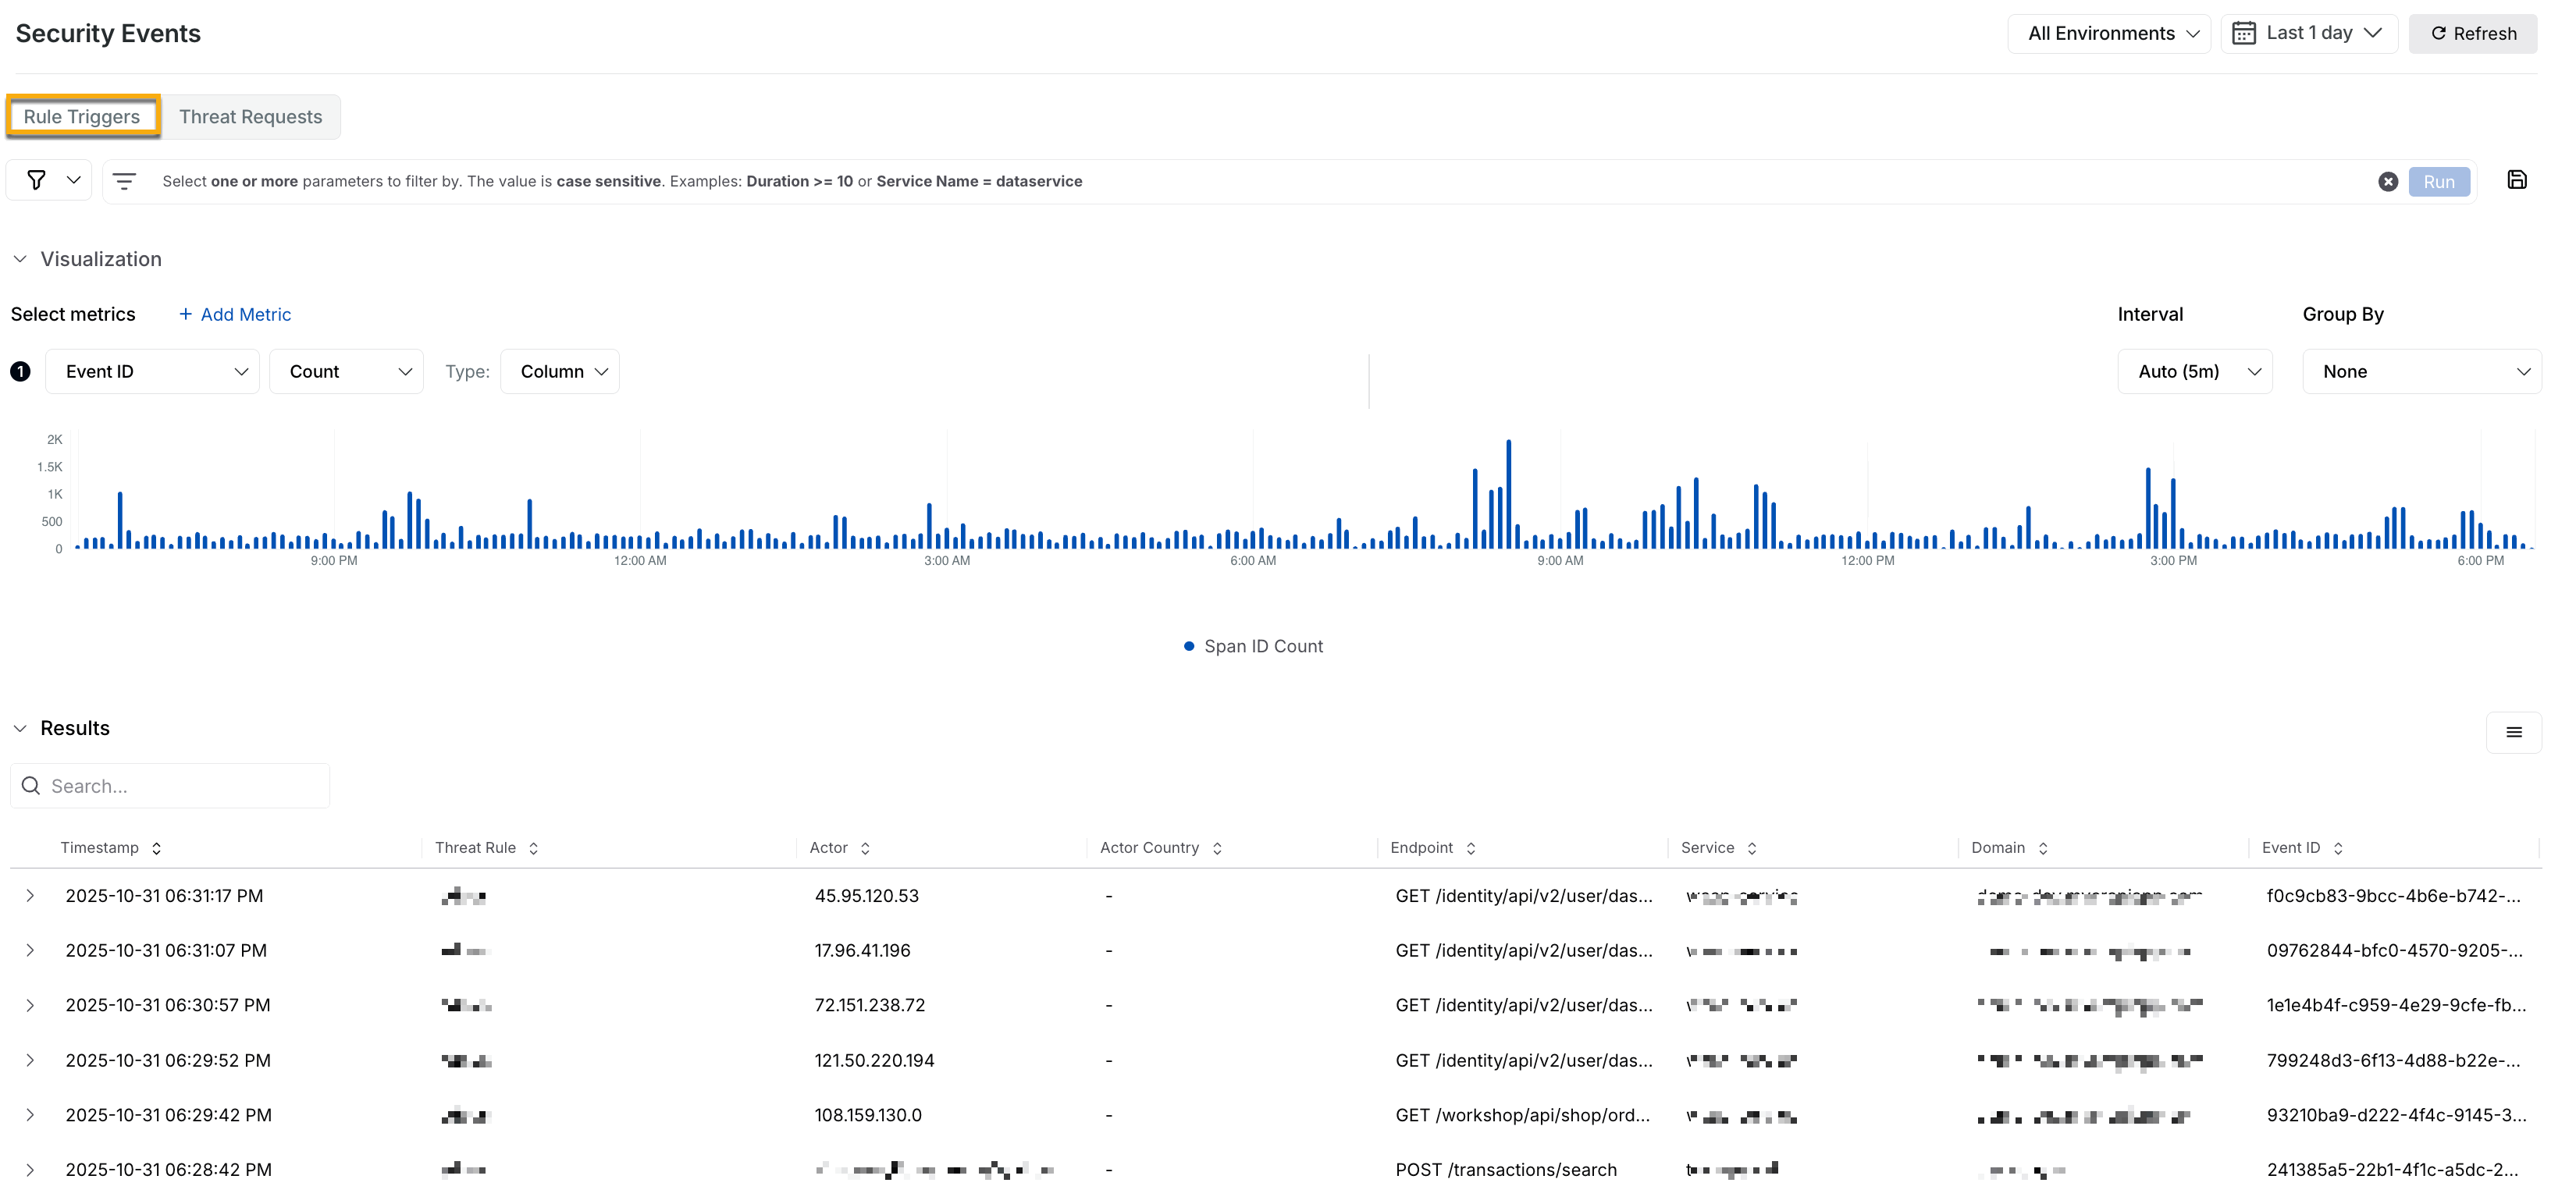
Traceable enables you to create, manage, and link issues in Jira for threat activities, keeping all issues in one place. In the Create Jira Issue window, the availability of the Components depend on the Issue Type that you select which in turn is dependent on the Project you select. You can also link your existing Jira tickets with the related threats, keeping track of all issues in one place with the Link Existing Jira feature.
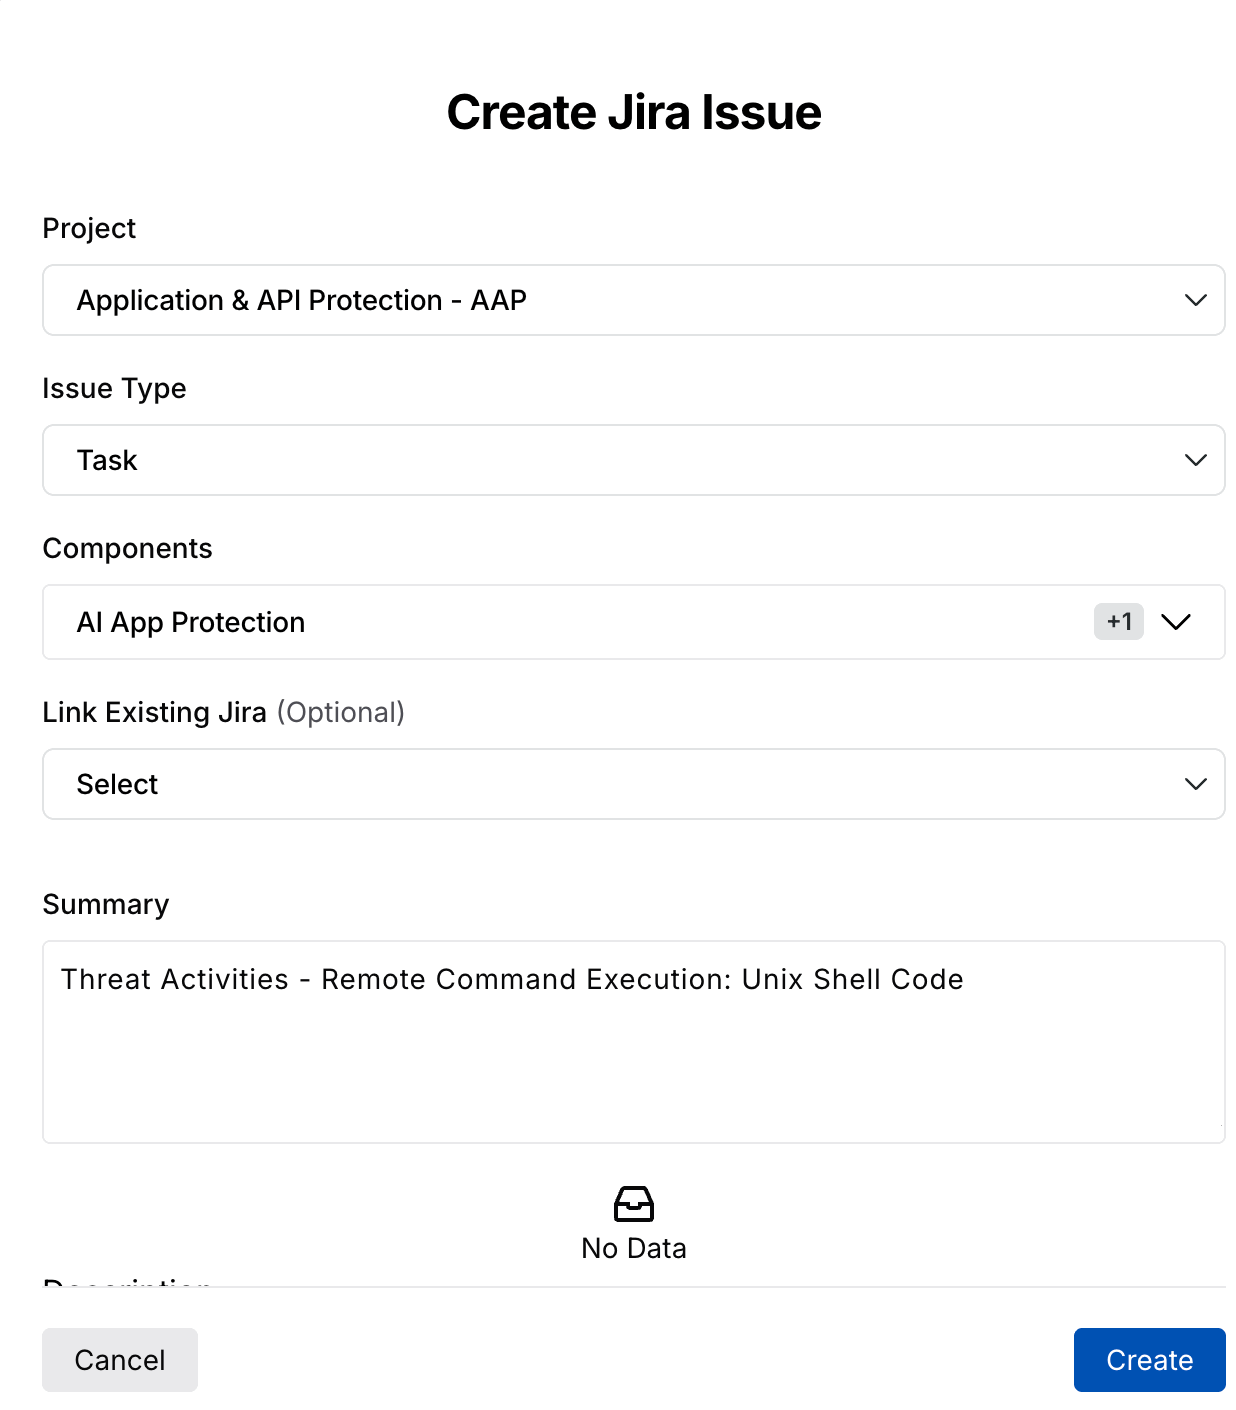
Create Jira Issue
The following interactive demo guides you through the steps to create and link Jira tickets for threats, both individually and on a group-by level.
Key Features of Threat Activity
Grouping and Filtering Options
One of the most powerful aspects of Threat Activity is the ability to group and filter data, allowing you to focus on the most relevant threats based on their security objectives. You can:
Group by categories — Organize threats based on threat rule, actor, threat category, endpoint, service, or domain to identify patterns or repeated attacks readily.
Apply filters — Narrow the threats by severity, status code, IP reputation, or environment, for example, production or development, ensuring that high-priority threats are addressed first.
Note
The filters applied on the Threat Activities Dashboard page also reflects on the slide-out panel of the grouped threat rules.
In addition to the above actions, you can click a column name to do the following:
Sort Ascending — Use this option to sort the data shown on the page in ascending order.
Sort Descending — Use this option to sort the data shown on the page in descending order.
Hide in view — Use this option to hide the column from the page.
Edit Columns — Use this option to add or remove columns according to your requirements.
Real-Time Alerts
You can monitor threats in real-time, flagging any suspicious activity immediately. The event timeline and severity indicators allow you to prioritize the most critical threats and begin mitigation without delay.
Detailed Mitigation and Impact
With access to detailed evidence, including raw request/response data, you can investigate the attack's origin, method, and intent. This enables security teams to swiftly take action by adjusting firewall rules, blocking IP addresses, or patching vulnerabilities. Additionally, Traceable provides clear mitigation steps tailored to each specific threat under the threat details tab.
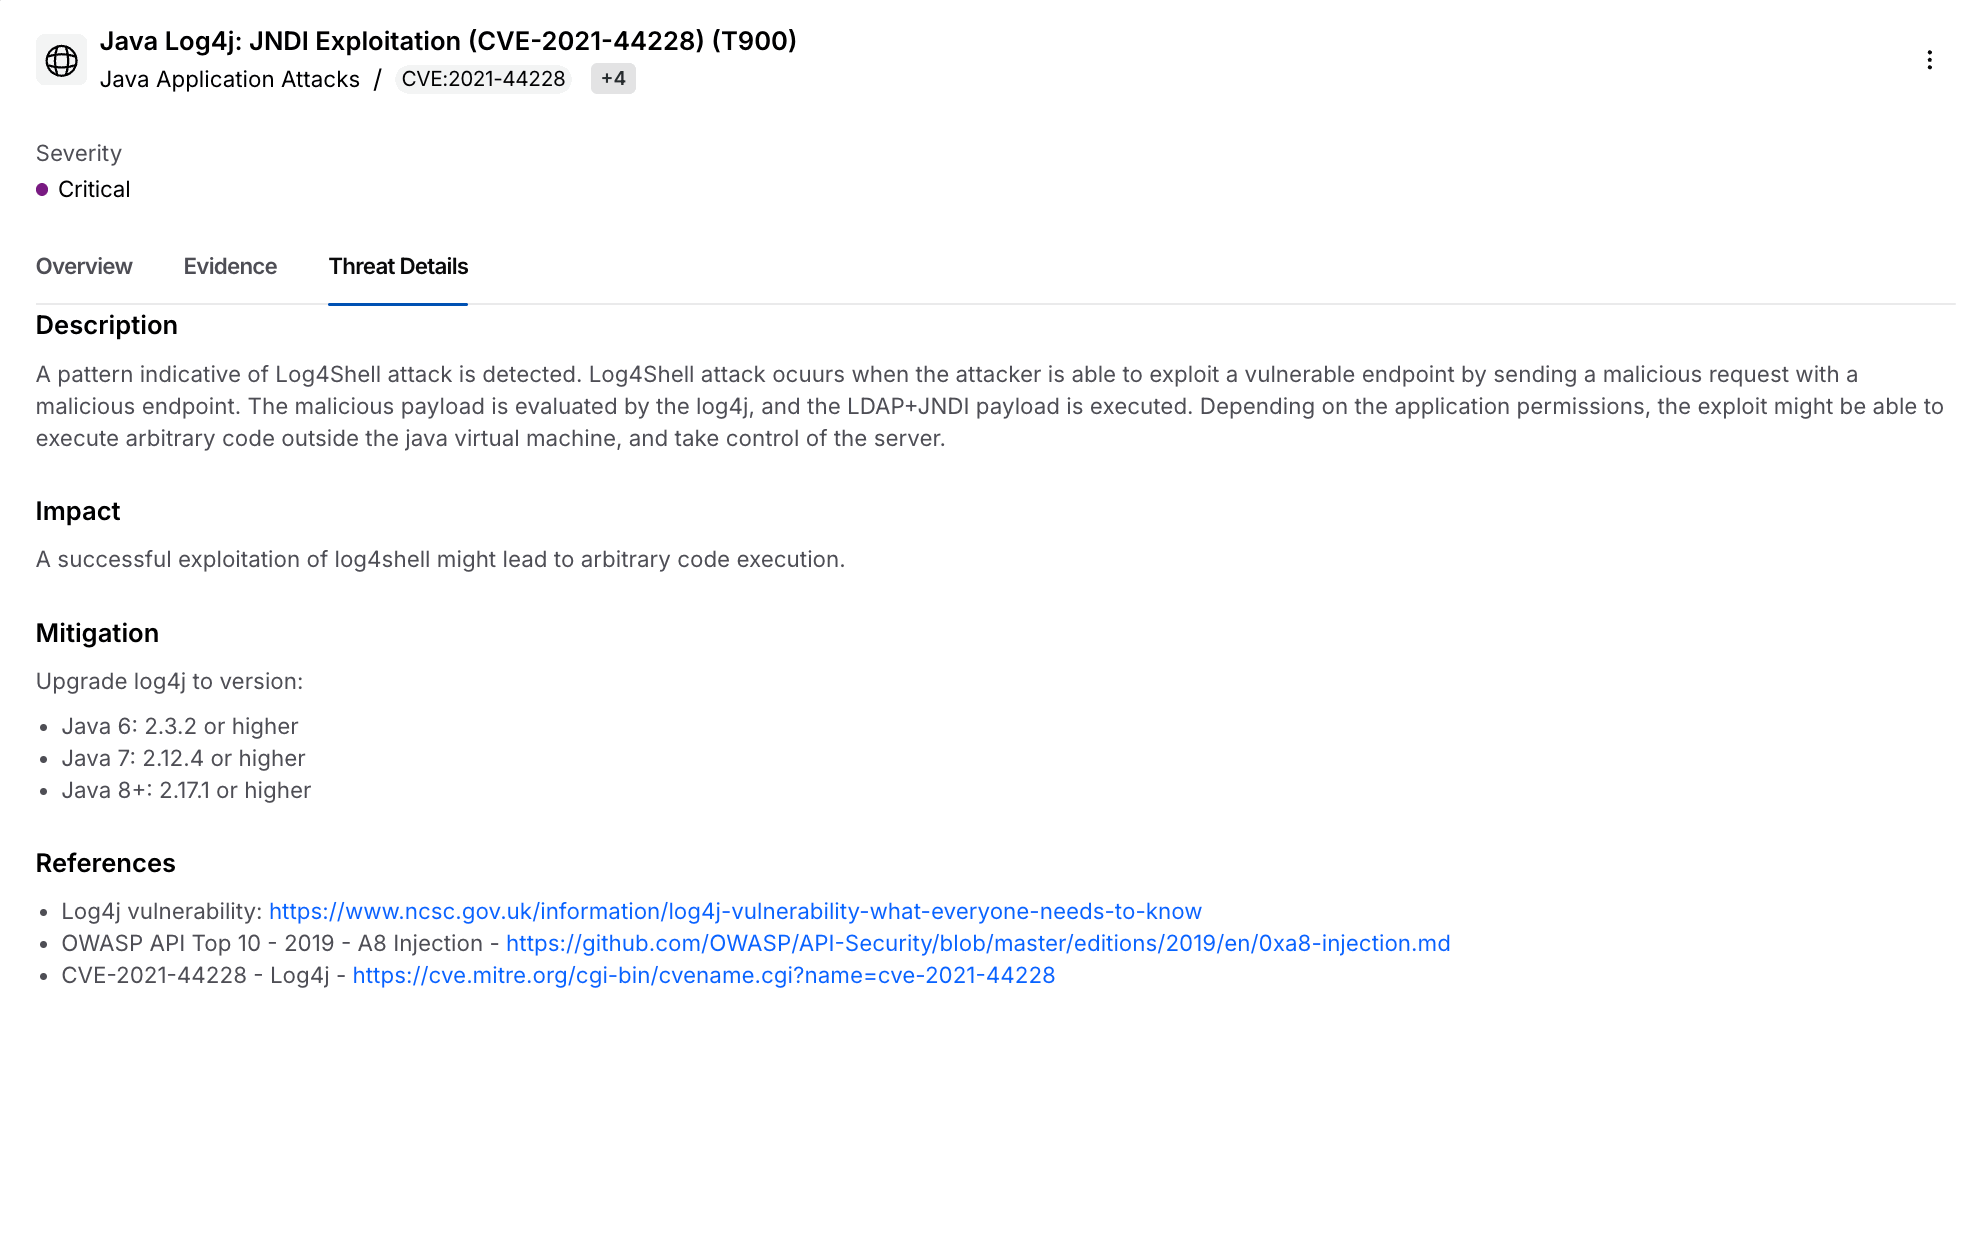
Threat Details Mitigation and Impact