Updates (April 2025 to June 2025)
May 2025 — Updated the page to add information about adding roles and scopes for API endpoints. For more information, see Adding Roles and/or Scopes.
Older Updates
February 2025 — Updated the page to add information about SOAP APIs and how Traceable names them.
An API Endpoint is a specific URL or address that clients or external systems use to interact with your application. It receives requests and sends responses, enabling data exchange and communication between applications.
What does Traceable do in the context of API Endpoints?
Traceable discovers the APIs and their authentications within your application ecosystem and monitors them for activities, vulnerabilities, security risks, and performance.
Note
Traceable discovers APIs only upon receiving successful status codes (between 2xx and 3xx).
What API types does Traceable discover and monitor?
Traceable supports and monitors the following API types:
REST
SOAP
gRPC
GraphQL
WebSocket
Note
For the WebSocket APIs, Traceable captures only the Handshake Call. As a result, sensitive data, vulnerability, compliance issue, and third-party API detection work based only on the handshake’s headers and parameters.
What API details are shown?
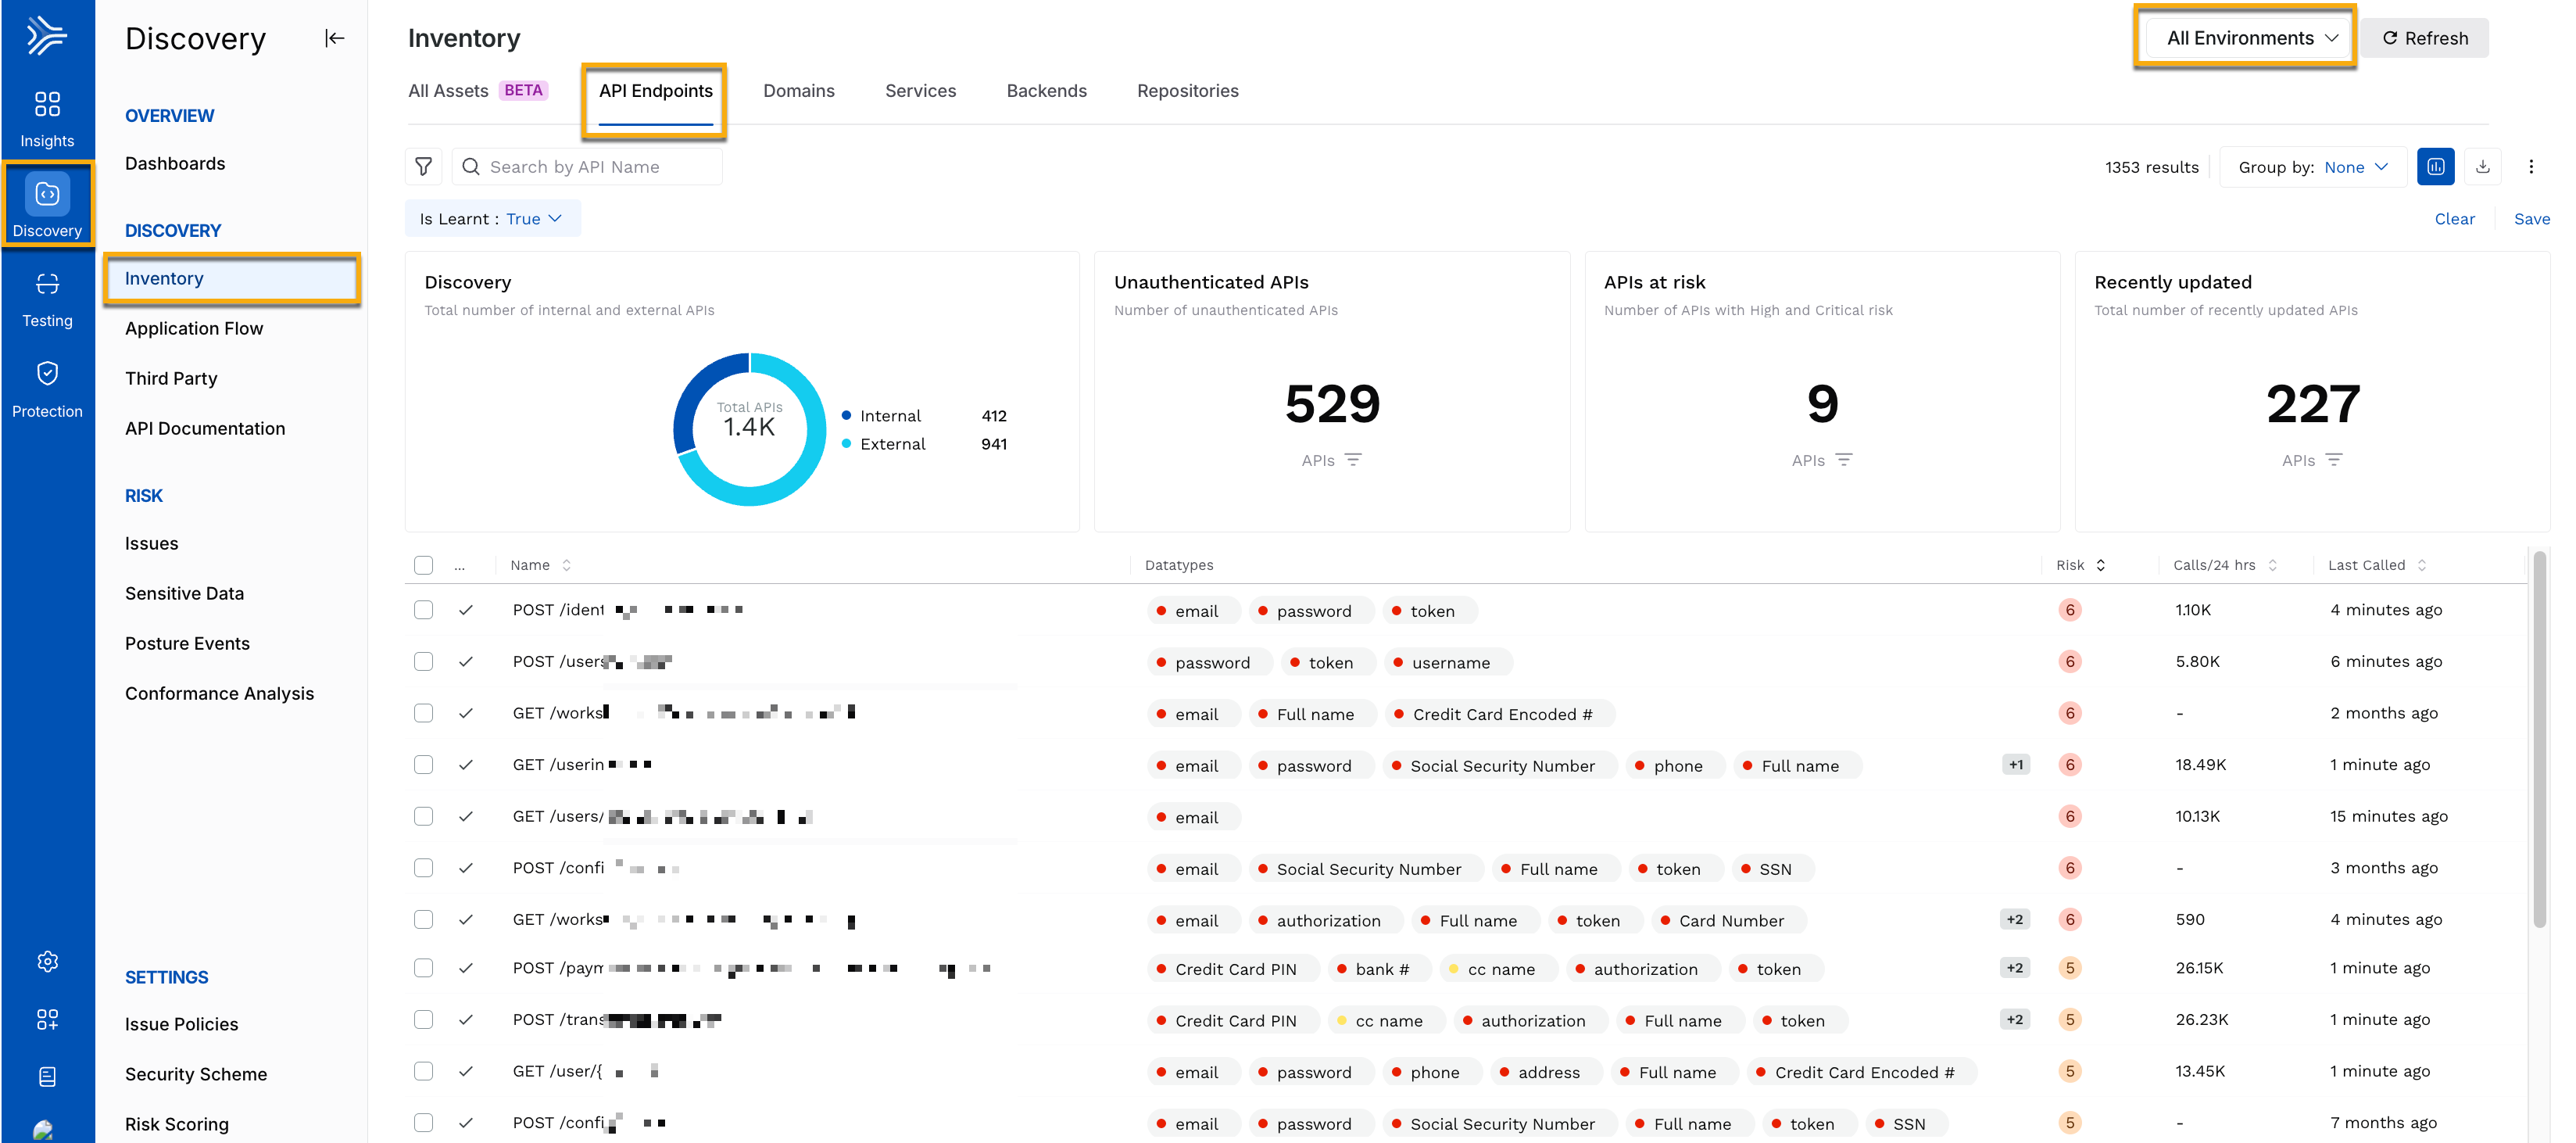
Traceable lists all the APIs discovered, learned, or under learning on the Inventory page, API Endpoints tab. By default, Traceable lists all learned APIs from your application. You can use this information to optimize and secure your APIs according to your requirements.
For what duration are the API details shown?
Traceable shows APIs and their details based on the traffic activity, delisting them after periods of inactivity: learnt APIs are retained for 90 days after their last observed traffic, while those under learning are retained for 30 days.
How to navigate the tab?
You can access the API Endpoints tab through the Discovery → Inventory → API Endpoints tab.
API Endpoints View

The API Endpoints tab lists the number of:
Internal and external APIs discovered. Traceable classifies these APIs in one of the following ways:
You label the API as External or Internal. For more information on managing labels, see Additional Features.
Identifying the IP address involved in the API traffic as private or public.
Unauthenticated APIs. For information on how Traceable identifies API authentication, see the section below.
APIs at risk. This number indicates the APIs that have high or critical risk scores.
Number of updated APIs. This number indicates the APIs updated in the last 1 day.
Note
When classifying APIs as authenticated or unauthenticated, the labels you apply take precedence over Traceable’s identification based on traffic. This ensures user-defined classifications are prioritized for accurate API categorization. For information on how Traceable identifies the authentication of APIs, see the section below.
The tab also lists the following:
API names
Note
SOAP API names are derived from the Operation in the API. For example, if the Operation is
Subtract, and the API name is/v1/calculatorwith the HTTP method asPOST, then the API is named asPOST /v1/calculator#Subtract.The data types found in each API
The risk score associated with the API
The number of calls to the APIs in the last 24 hours
The time at which the API was last called
Traceable lists the above details for All Environments by default. You can view these details for a specific environment by selecting it from the Environments drop-down in the page’s top right corner. You can also filter the data shown on the page according to your requirements. The following section explains these filters and how to use them.
How does Traceable identify API authentication?
Traceable determines API authentication by inspecting the headers, tokens, and other credentials associated with API traffic. It classifies APIs based on authentication status, identifying potential security threats in unauthenticated endpoints.
Filters
The API Endpoints tab provides multiple filters that you can use to fine-tune the results displayed on the page. You can open the filter pane by clicking on the Filter (![]() ) icon in the tab’s top left corner. The pane shows the following tabs:
) icon in the tab’s top left corner. The pane shows the following tabs:
Tabs | Description |
|---|---|
Filters | This is the list of filters that are available to you. |
Saved | This is the list of filters that you have saved for later use. |
Recent | This is the list of recently applied filters. |
You can apply filters based on the following categories:
Category | Description |
|---|---|
Security Posture | This category lists filters to view APIs based on sensitive datatypes, datasets, authentications, risk categories, etc. |
API Definition | This category lists filters to view APIs based on authentication types, encryptions, creation time, labels, domain names, etc. |
Traceable | These are Traceable’s custom filters to view APIs based on whether they are learned, their discovery state, etc. |
Deployment | This category lists filters to view APIs based on the environment and service. |
API Ownership | This category lists filters to view APIs based on their ownership across various functions, such as developers and quality assurance. |
Example — Let us say you want to view the APIs called in the past 3 days. The following demo illustrates how to do this.
You can follow steps similar to the above demo to add multiple filters. You can also remove a filter by hovering over it and clicking the X icon.
Traceable also allows you to do the following:

Action | Description |
|---|---|
Save filters for later use | You can save any applied filters (one or multiple) according to your requirements and use them later. Traceable shows them in the Saved tab of the Filters pane. To save the filters, complete the following steps:
|
Clear all filters at once | You can clear all filters at once by clicking Clear in the top right corner of the summary section. |
Additional Features
Apart from the above features, you can also do the following:
.png)
Group Data
You can use the Group By drop-down to group the data displayed on the page according to certain attributes such as auth types and labels.
Hide Visualizations
You can hide the visualizations displayed in the Summary bar by clicking on the Visualizations (![]() ) icon shown in the top right corner of the API Endpoints tab.
) icon shown in the top right corner of the API Endpoints tab.
Download Data
You can download the data shown on the page by clicking on the Download (![]() ) icon shown in the top right corner of the API Endpoints tab. While downloading the data, you can also specify the number of rows you want to download.
) icon shown in the top right corner of the API Endpoints tab. While downloading the data, you can also specify the number of rows you want to download.
Add or Remove Columns
While Traceable shows columns by default on the page, you can add or remove them according to your requirements. Traceable provides various columns from which you can choose. To add or remove columns, do the following:
Click the Ellipse (
 ) icon shown in the top right corner of the API Endpoints tab.
Click Edit Columns.
In the Edit Columns pop-up, select or deselect the columns you want to add or remove. Optionally, you can also reset the page to the default setting by clicking Reset to default.
Note
All columns except Name can be removed.
Click Apply.
Traceable shows the updated column setting on the page.
Manage Labels added to APIs
You can do the following to one or more APIs according to your requirements:
Add labels
Note
You can add up to 32 labels to an API.
Replace existing labels with new ones
Remove labels
To do this, complete the following steps:

Click the checkbox corresponding to the APIs where you want to manage labels.
At the bottom of the page, click Manage Labels.
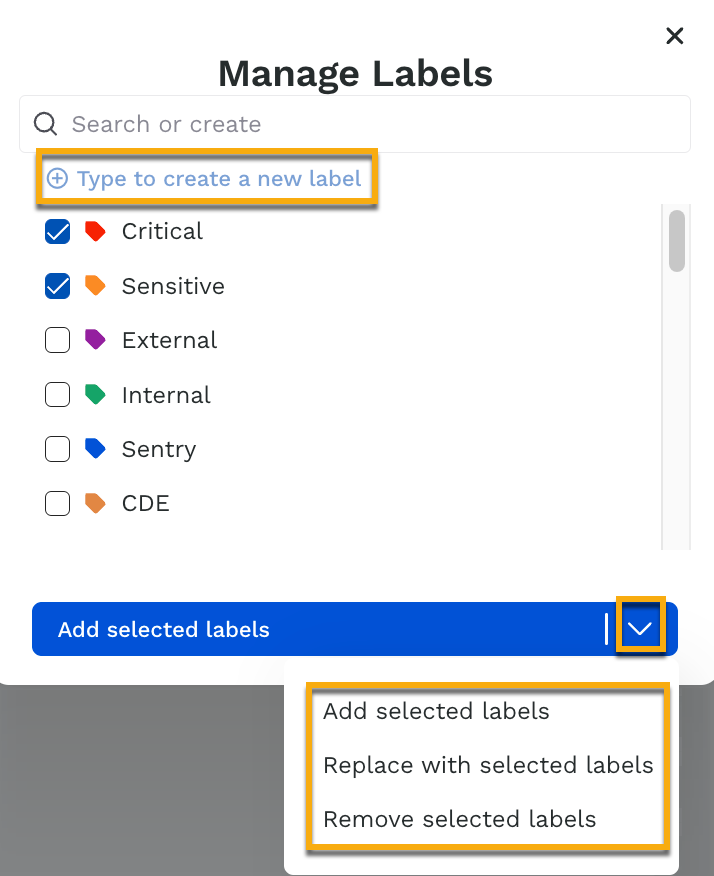
In the Manage Labels pop-up, select the checkbox corresponding to the labels you want to manage. You can also create a new label by specifying the label name in the Search or create field and clicking + Create <label name>.
Click the arrow icon corresponding to Add selected labels and select the option according to your requirements.
For more information on Labels, see Label Management.
Add Roles and/or Scopes
Traceable, through roles and scopes (security schemes), enables you to enhance your API security using role- and scope-based access control for the APIs in your application ecosystem. This enables you to enforce authorization rules and ensure authorized access only.
To add a role or scope, complete the following steps:

Adding Roles and/or Scopes
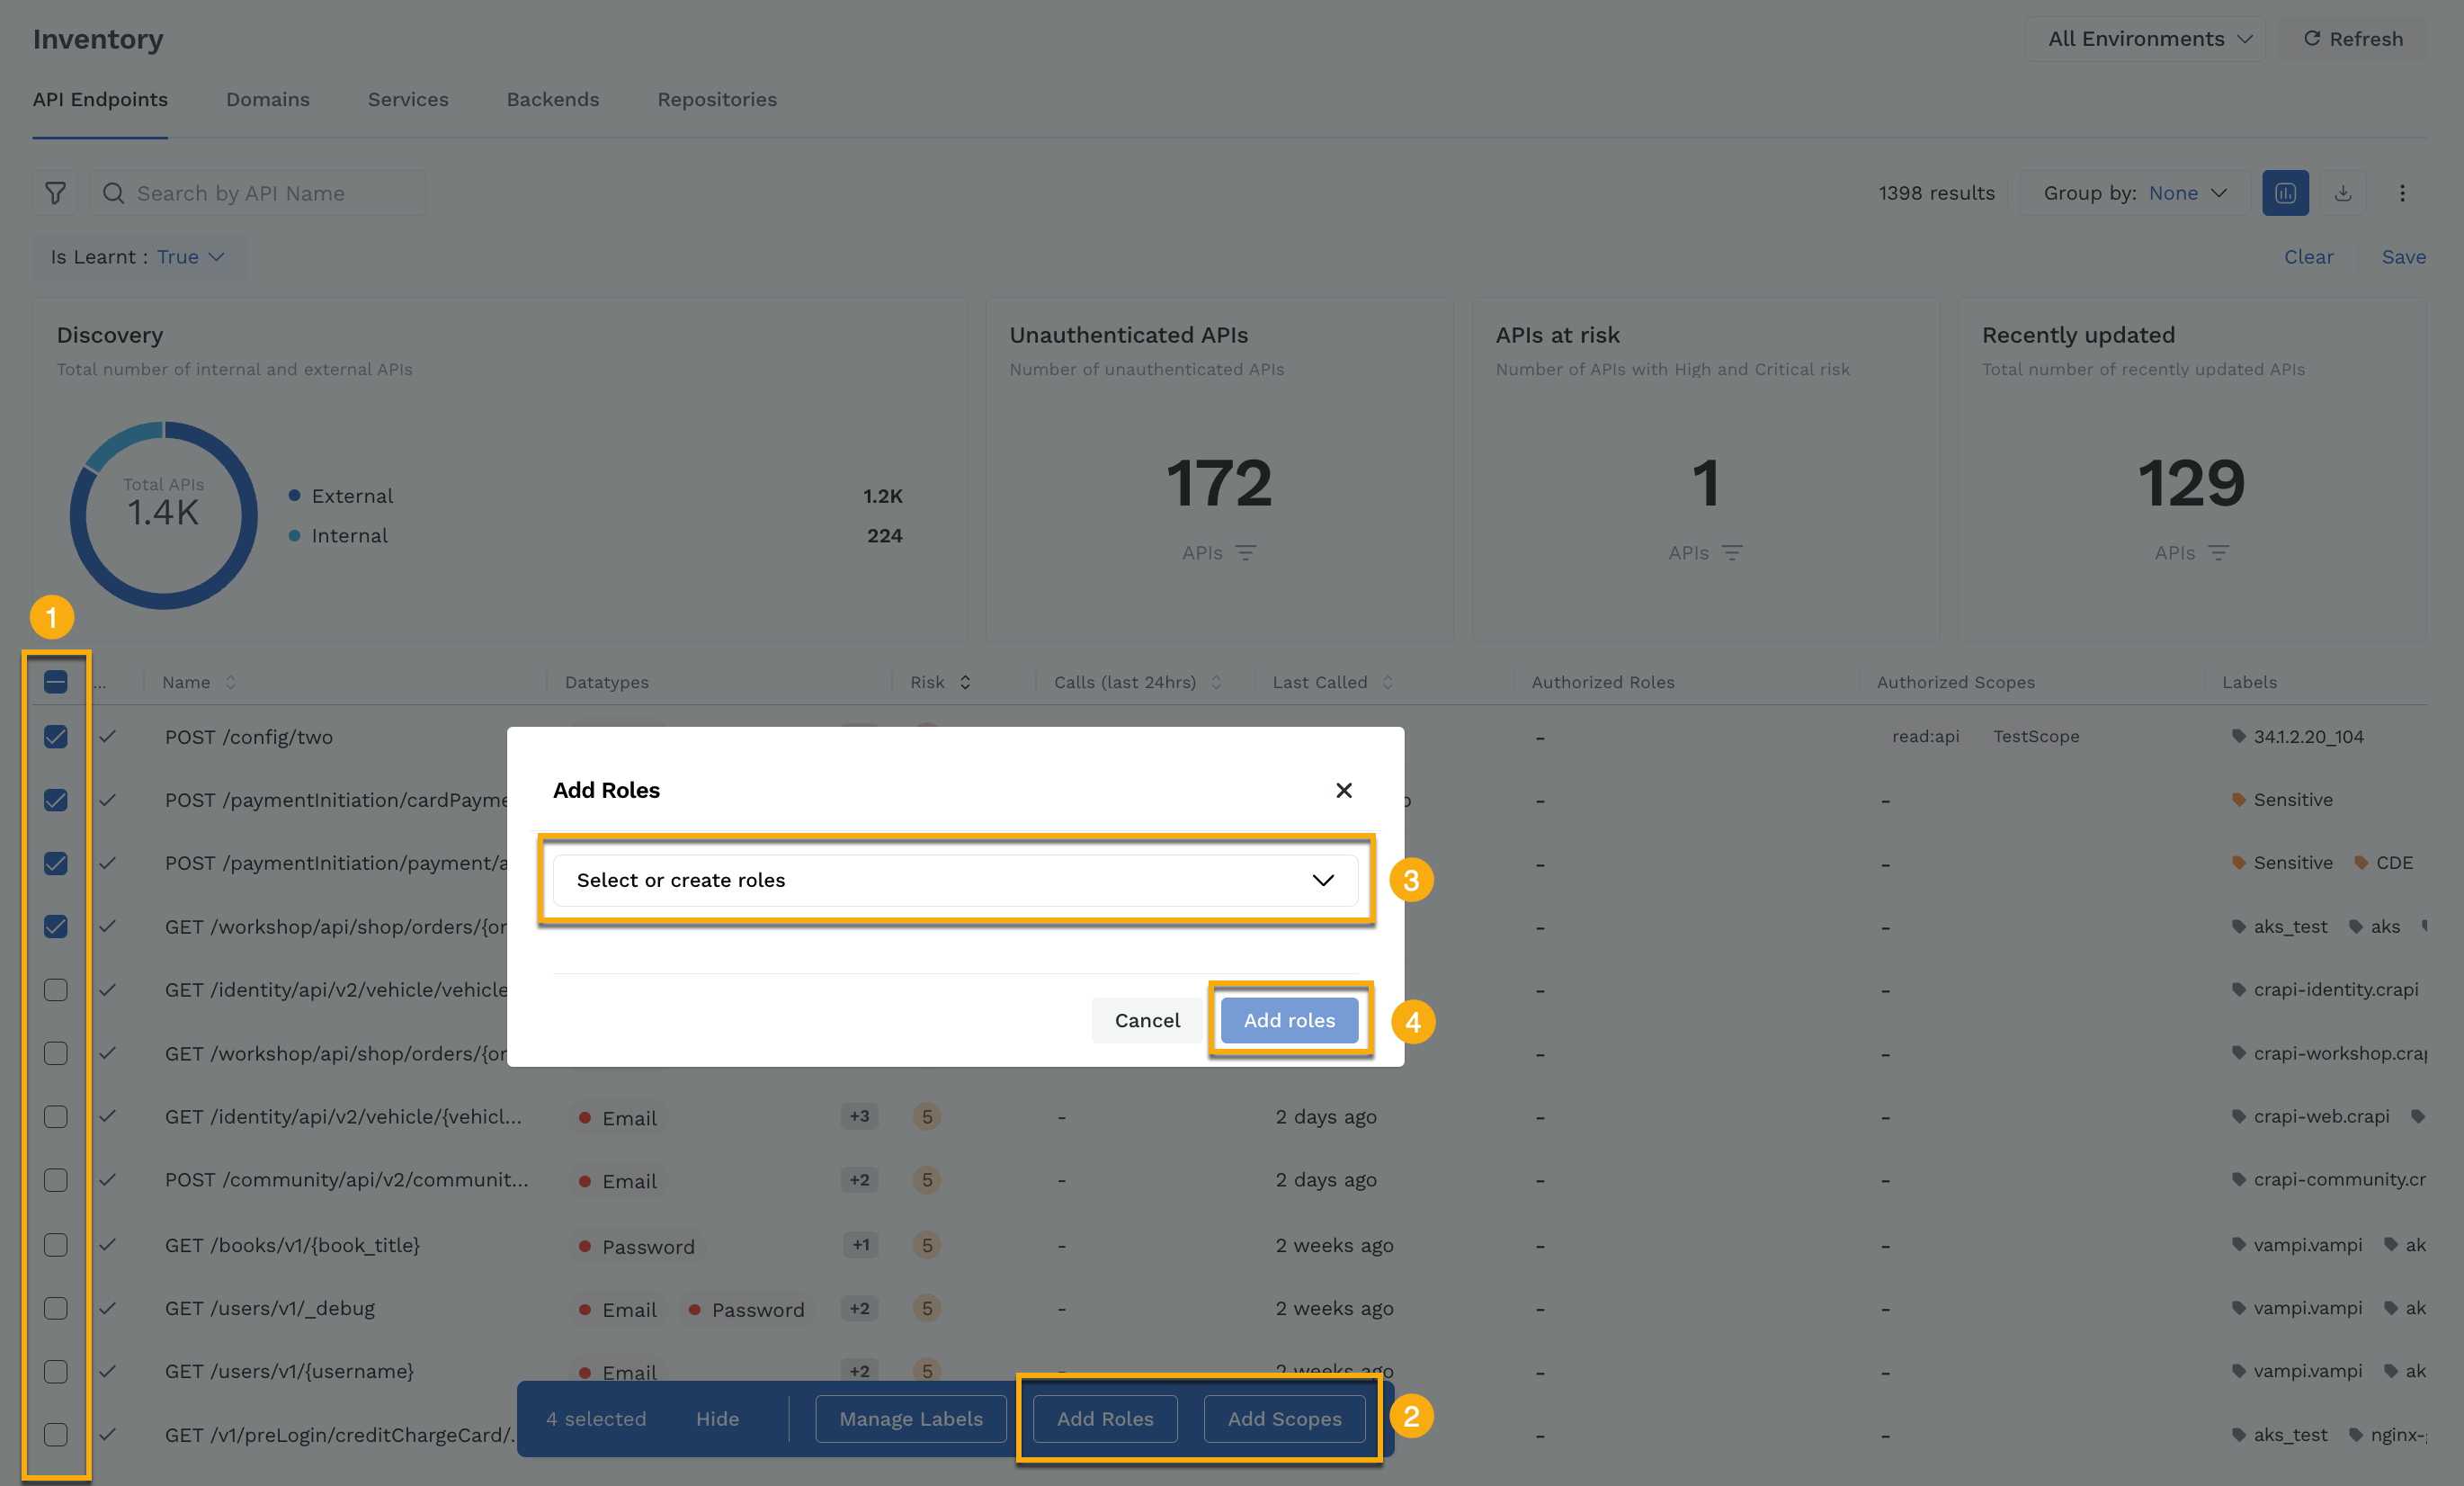
Click the checkbox corresponding to the APIs where you wish to add a role or scope.
At the bottom of the page, click Add Roles or Add Scopes according to your requirements.
In the Add Roles/Scopes pop-up, click the Search or create roles/scopes drop-down, and select the check-box corresponding to the roles/scopes you wish to assign. You can also create a new role/scope by specifying the name in the Search field and clicking + type to create new role/scope.
Click Add Roles/Scopes.
For more information on the roles and scopes, see Security Schemes.