Updates (January 2025 to March 2025)
February 2025 — Updated the page to add information about WSDL API specifications in the Overview tab.
January 2025 — Renamed the API DNA tab to Parameters. The tab has further been updated to highlight how to manage datatypes and create data classification rules directly from the Parameters tab.
What Endpoint Details are shown?
The API endpoint details page provides a comprehensive view of your API, including its activity, performance, and security. The page highlights malicious behaviors observed in the API, its OpenAPI specifications, and detailed trace information. It also provides API performance metrics, such as error and latency rates, along with detailed information about the parameters, which tracks the API’s behavior and structure over some time.
How does this help?
Using the Endpoint details page, you can monitor your APIs, analyze issues, and take measures to secure them effectively.
How to navigate the page?
To view this page, navigate to the Catalog → Inventory → API Endpoints tab and click the API for which you want to view the details.
Endpoint Details
Understanding the Endpoint Details
The following tabs discuss the information shown for each endpoint. Click the tab according to your requirements to understand about each endpoint.
The Overview tab shows detailed information about an API using the following sections:
Details — This section contains the following information:
Service and domain associated with the API.
The time at which the API was created and last updated.
The auth type, encryption, and type of API.
The source and environment of the API.
The ownership of the API.
Risk Score — This section highlights the risk score assigned to the API. This score is calculated based on various contributors. For more information on risk scoring, see Risk score. The section also highlights the contributors to the risk score. You can expand each contributor to view detailed information about it. You can also create Jira issues to remediate each issue. To do so, click Create corresponding to the contributor, specify the details in the pop-up, and click Create.
Note
You must integrate Jira with Traceable to be able to create Jira issues. For information on setting it up, see Jira integration.
User Roles — This section highlights the different user roles using your API. You can use this information to identify any unauthorized roles using the API. The section also displays a chart with the number of requests per user role and total requests to the API. For more information, see User Attribution.
Requests — This section highlights the total number of API requests and includes a time series chart showing the requests at a particular time. It also shows another time series chart with the active attack requests and blocked requests, along with the top 5 detected attack types and top 5 blocked attack types listed below it. You can use this information to block specific API requests quickly.
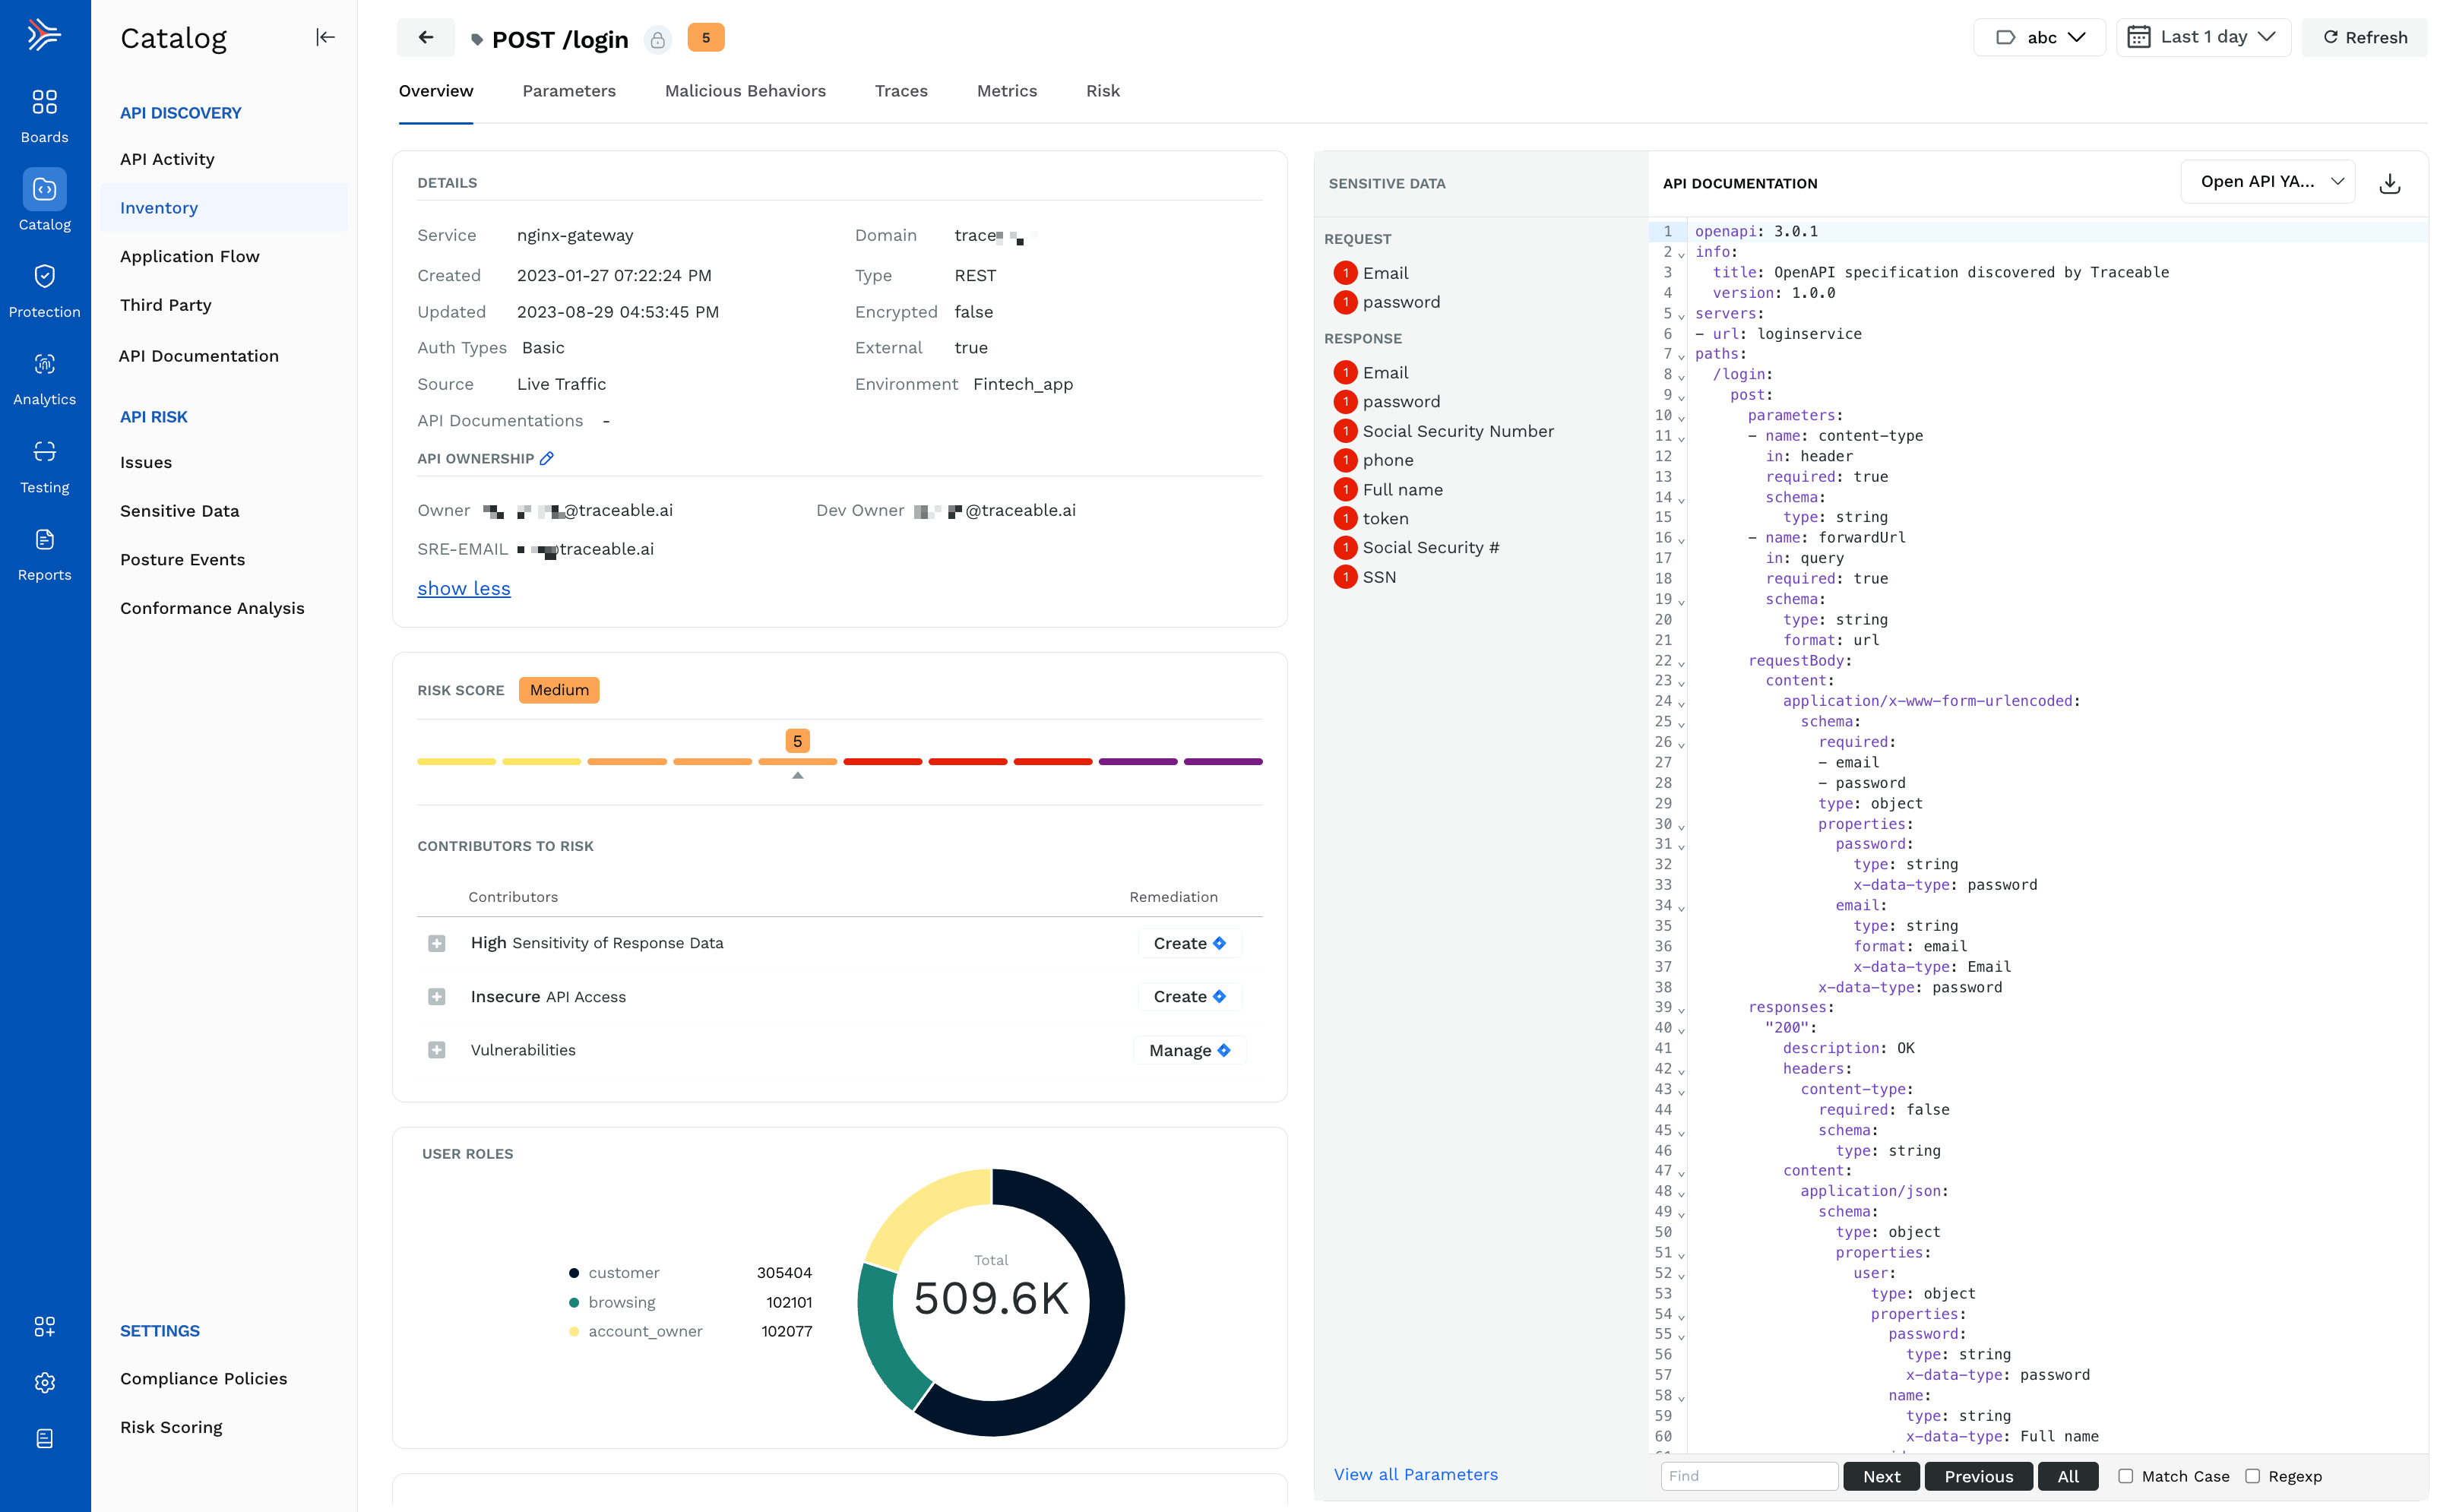
API Documentation — Traceable learns the API documentation throughout its discovery process and identifies sensitive data (parameters) in API requests and responses. This section shows the Traceable discovered documentation in detail, along with the sensitive data (parameters). You can click on a sensitive data type from the list, and Traceable highlights it in the documentation. You can also download the documentation in either of the following formats:
Open API YAML
Open API JSON
WSDL (for SOAP API types only)
To do this, click the Download (
.png) ) icon corresponding to the format drop-down. You can use the downloaded documentation with applications such as Postman.
) icon corresponding to the format drop-down. You can use the downloaded documentation with applications such as Postman.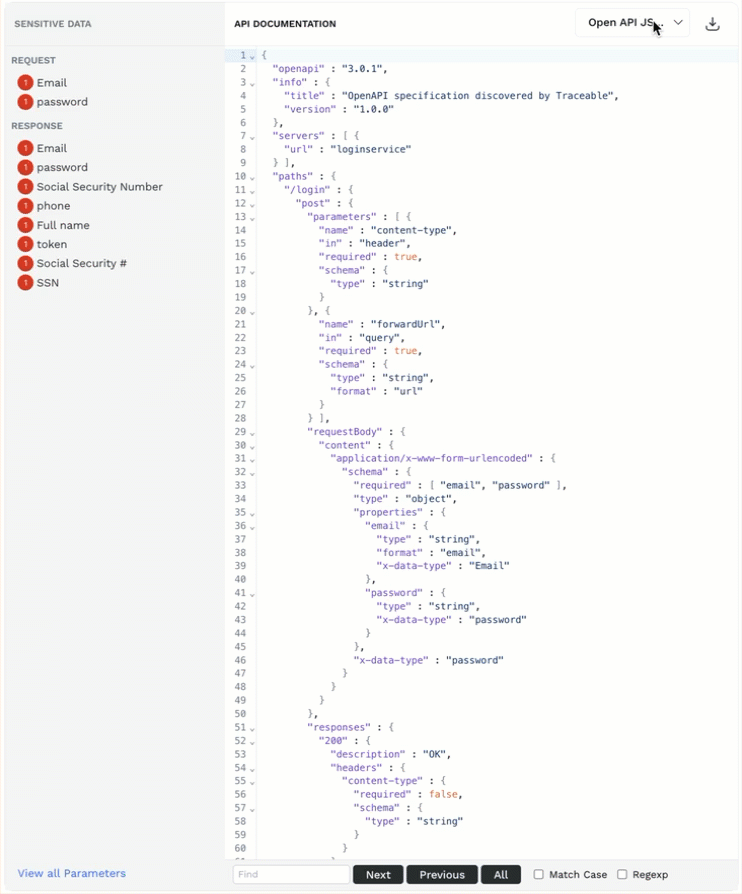
If you wish to download the OpenAPI or WSDL specifications for a domain, service, label, or environment, you can use the APIs provided by Traceable. For more information, see Downloading API Documentation.Note
API documentation is not generated for third-party APIs.
This tab provides an overview and details of the various parameters used in an API as well as their location and sensitivity. The Parameters tab also includes information about the datatypes and datasets associated with a parameter. This is useful for gaining in-depth insights into your API activity and understanding the criticality of parameters.
Note
Parameters are not generated for third-party APIs.
.png)
Parameters
The visualization section in the tab provides information about the following:
Parameters by Location — Displays a chart showing the total number of parameters discovered in different sections of an API request or response, with each location represented in a different color.
Parameters by Sensitivity — Displays a chart showing the total number of parameters discovered in an API request or response, grouped by sensitivity and represented in different colors.
Note
Parameters that are not associated with a datatype are not assigned a sensitivity (None) as shown above.
The tab also displays a list of parameters that Traceable has discovered in the API request and response. By default, Traceable displays the list of parameters that it has learned. The following details are shown for each parameter:
Parameter — The name of the parameter discovered by Traceable. Objects containing multiple child parameters or objects are represented by {}. You can click the Expand (
 ) icon corresponding to an object to view the parameters under it. The icon next to a parameter name indicates the type of value sent in that parameter. You can hover over the icon to view the type, for example, ABC, which represents a String.
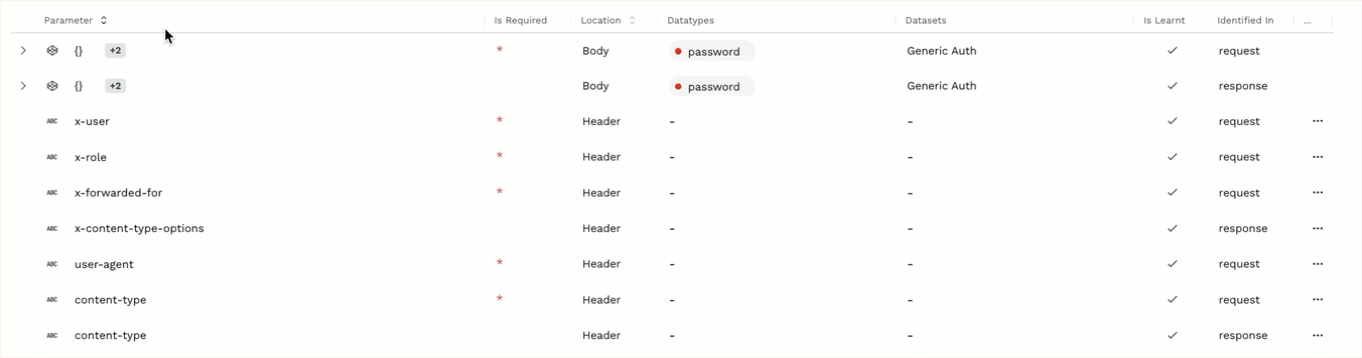
Is Required — Highlights whether the parameter is required or not. Traceable marks a parameter as required if it appears in 99% of API calls. Required parameters are highlighted with an asterisk (*) as shown above.
Location — The location within the request or response of the API where Traceable observed the parameter, for example, body, header, etc.
Datatypes — The Traceable datatype(s) associated with the parameter, for example, password and Email as shown above. You can also hover over a datatype to view its basic details.
You can add or edit datatypes for each parameter according to your requirements by clicking the Ellipse ( ) icon corresponding to a row and selecting Add Datatype or Manage Datatype, respectively. Specify or modify the datatype details in the respective pop-up window according to your requirements. For detailed information on these fields, see Data Classification.
Note
You can add or edit datatypes only at a parameter level and not at an object (
 ) level. Therefore, you must expand objects to be able to add or edit datatypes. For example, in the above screenshot, the object level is represented by {} in the first row, and upon expanding, the parameter level is represented by the child rows password and email.
A datatype can belong to one or more datasets. Make sure that the dataset to which you want to add the datatype is available in the Dataset drop-down list. If it is not listed, then create a dataset from Settings (
 ) → API Catalog → Data Classification → Datasets tab. For more information, see Data Classification.
Datasets — The Traceable dataset(s) associated with the parameter, for example, Generic Auth and HIPAA as shown above. You can also hover over a dataset to view the corresponding datatypes under it.
Is Learnt — Highlights whether the parameter is learned or not. While Traceable shows learned parameters by default, you can remove the Is Learnt filter at the top of the tab to view both learned and under-learning parameters. The learned and under-learning parameters are highlighted using the
 and
and  icons respectively.
Identified In — The API component (request or response) where Traceable observed the parameter.
Note
As Traceable keeps monitoring both learned and under-learning APIs continuously, the parameters visible in the tab may change with time.
You can also do the following in the tab:
Search for a specific parameter using the Search bar.
Filter data to view parameters based on certain conditions by clicking the Filter (
 ) icon.
This tab highlights the malicious activities observed in the API within your selected time duration. The page contains the following information:
The type of malicious behavior observed in the API.
The description of the malicious behavior.
The category to which the behavior belongs.
The timestamp at which the behavior was observed.
You can click on a specific behavior to view its details. Traceable redirects you to the Threat Activity page under Protection, where you can view information such as event details, description, mitigation, impact, etc.
When a user sends a request, it creates a trace in the system. A trace may traverse through multiple services to fulfill the user’s request. The Traces tab displays detailed information about each request, its response, and its associated attributes. Traceable also shows the related cookies.
One crucial piece of information the Traces tab provides is the Exit Calls. This information lets you identify the backend or third-party services your API is calling, which can be especially helpful for detecting unauthorized third-party calls. You can also click on the + icon corresponding to a row to view more details about the trace.
The Metrics tab displays detailed statistical information about the performance of the API Endpoint. By default, this information is shown for the past 5 minutes; however, you can change it to view data for up to 6 hours. The following information is displayed for an API:
Performance information, such as P50, P95, and P99 latency numbers. These metrics help identify the API performance for different user groups. If you see unexpected latency numbers, you may want to check the APIs for resource consumption, performance bottlenecks, and network issues.
The error rate and error percentage during the selected time period. The error rate is the number of failed requests per second, while the error percentage is the number of failed requests relative to the total number of requests converted into a percentage format. These values help detect issues and monitor the API’s reliability. If you see unexpected numbers, you may want to check the APIs for network problems, security, and configuration issues.
The number of calls per minute to the API during the selected period. If you see an unexpected number of calls for an API, it may indicate API abuse or a DDoS attack.
The data transfer rate in the selected period can also give you insights about the API’s usage. If you see an unexpected data transfer rate for an API for which the rate should be low, it may point to a possible breach in API security.
The top status codes that you can monitor to infer the health of the API. You may want to check the API for issues if you see many error status codes.
The Risk score is calculated based on the likelihood and impact of a probable security breach. The Risk tab shows the current risk score based on various sub-components of likelihood and impact. For detailed information on how Traceable calculates the score, see Risk Score.