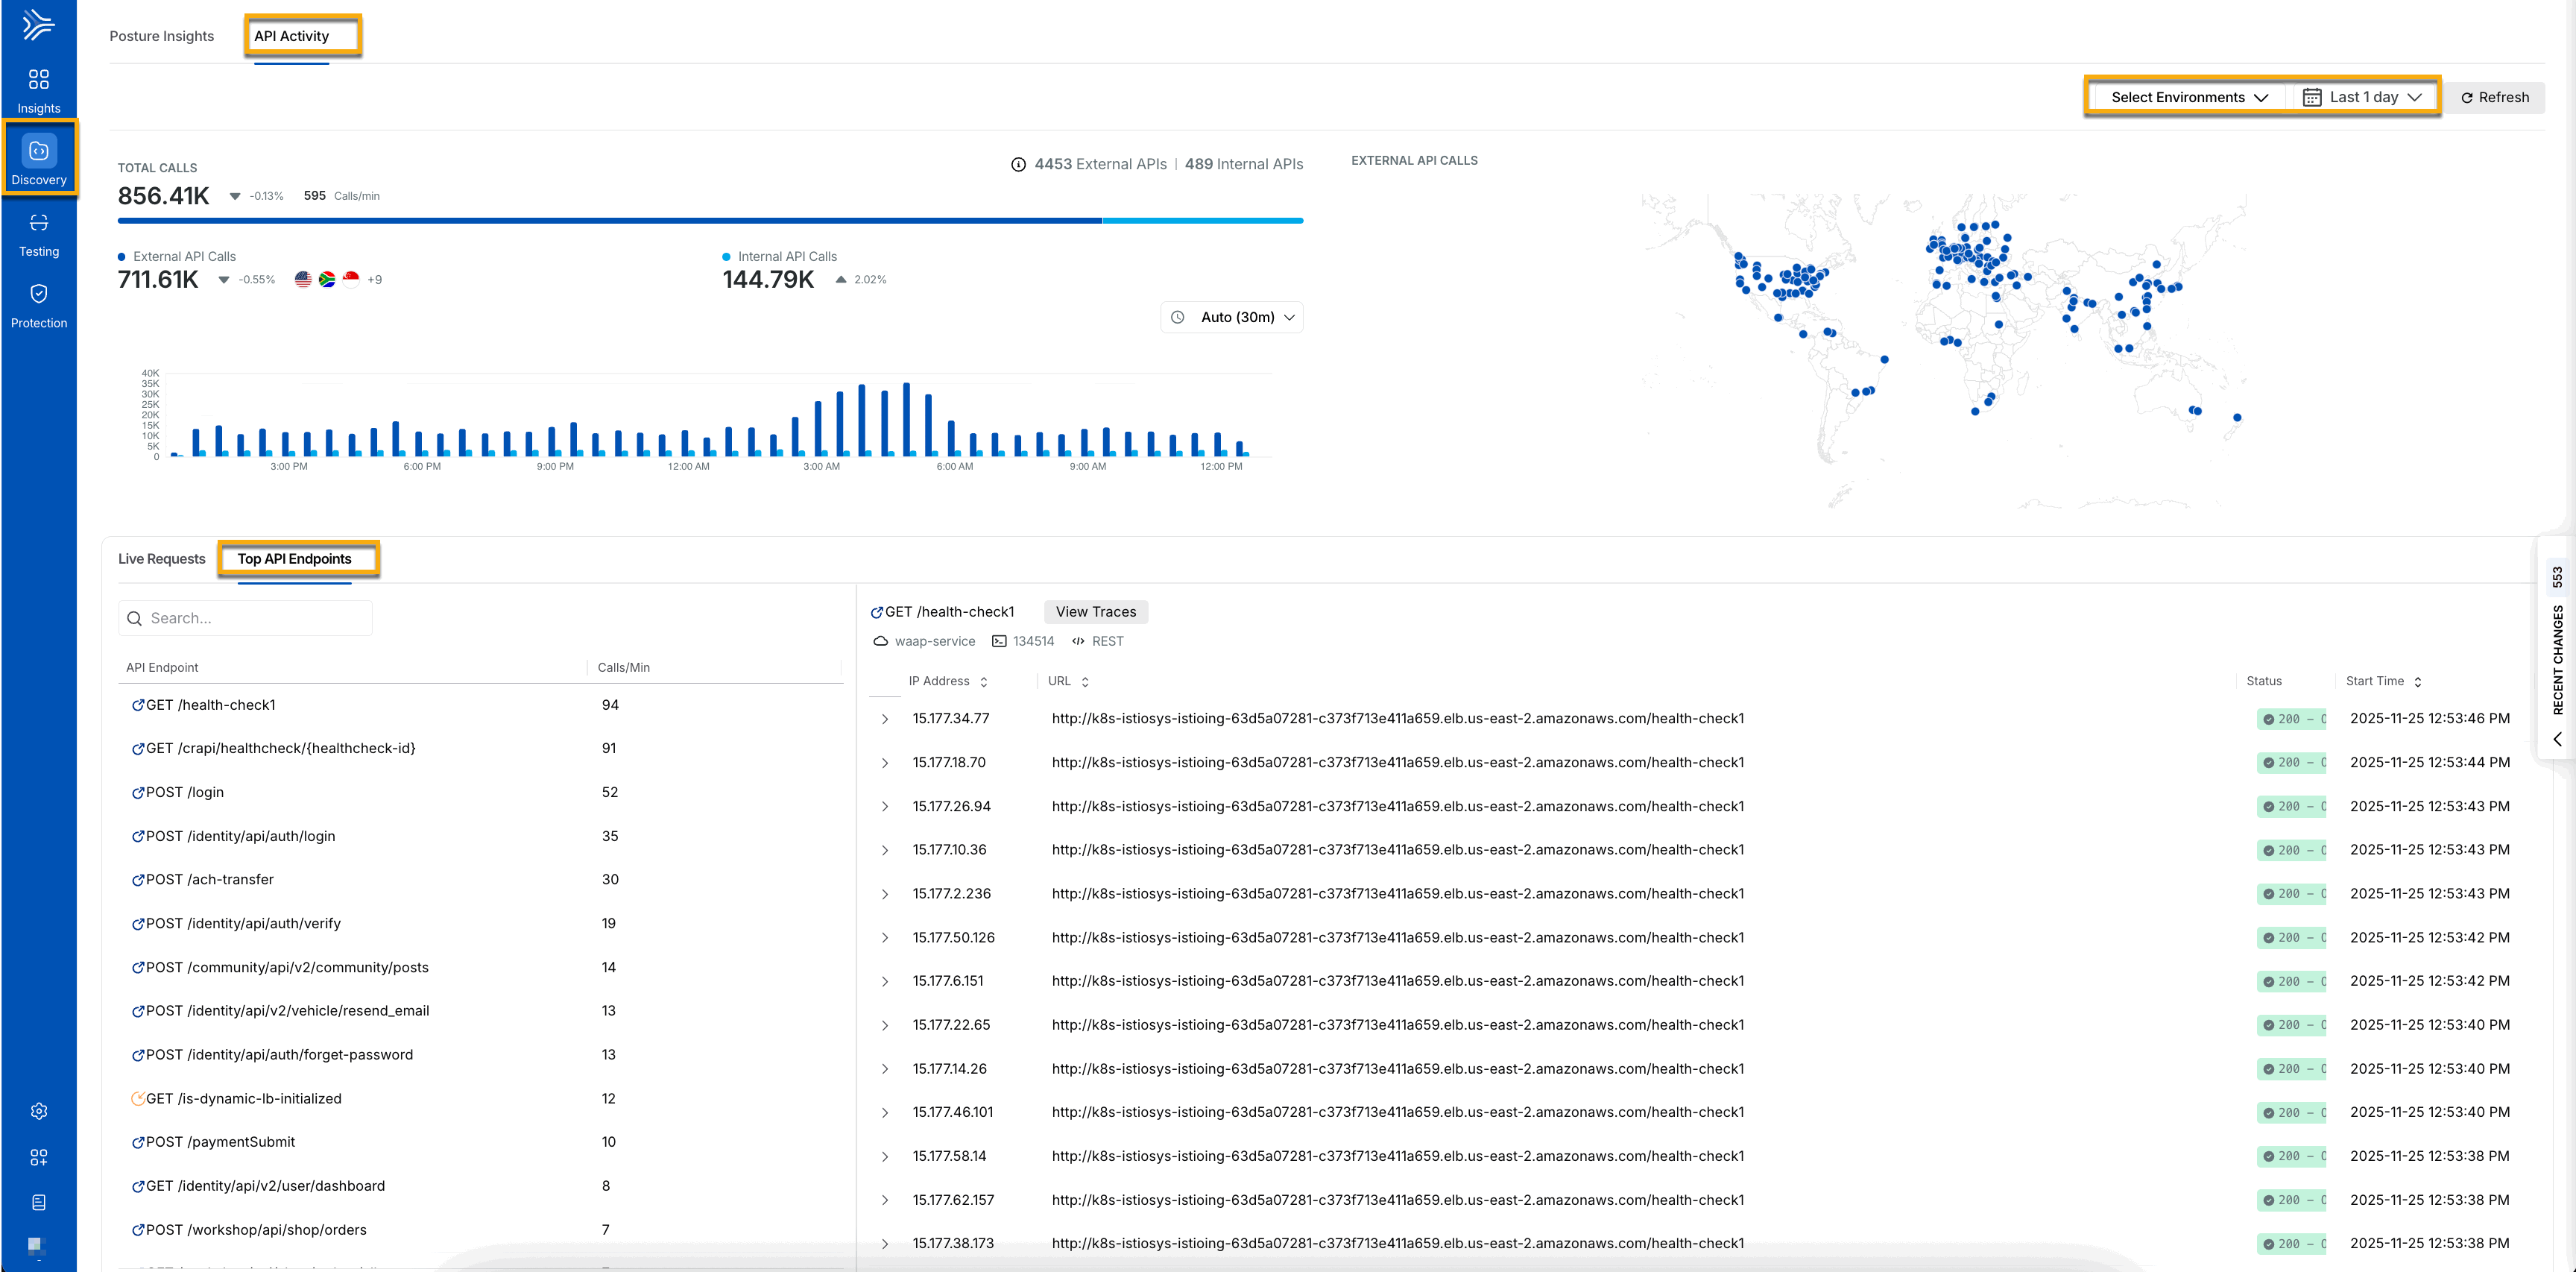
The API activity page provides a high-level view of API traffic within your infrastructure. It includes information about the Total number of calls in the selected period, the number of internal or external calls, Live Requests, Top API Endpoints, and a live map that displays where requests originate. The API activity page also summarizes the recent changes made to the APIs.

API Activity
You can choose the Environment and period for which you wish data to be displayed.
Live requests
Live requests are among the most valuable data in API activity. Traceable displays live requests for your chosen Environment along with their IP addresses. The live requests are a combination of internal and external calls. Monitoring live requests provides real-time information about what resources are accessed by APIs.
Top Endpoints
Traceable lists the Top Endpoints based on the number of calls/minute during the selected period. Click the particular API Endpoint to view more details about the API. You can view all the IP addresses that accessed the API Endpoint, along with the URL, status code, and the start time. Hovering the mouse over the graph displays the number of calls during a minute, as shown below.

Top API Endpoints
The External Calls widget displays the number of calls originating from a specific geographical location, along with the city's name. If you receive more calls from a specific geographic area, you may want to investigate further. When you click a particular geographic location, Traceable displays detailed traces from that place. This is another actionable forensic information provided by Traceable to protect your API infrastructure.
Total calls
Traceable provides the total of internal and external calls in the chosen period. The screenshot below displays a bar graph that separates internal and external calls. You can select the time period you'd like to view the total number of calls. By default, the number of calls is shown for 30 minutes, with a maximum of 6 hours. The Total Calls section also displays the number of internal and external API calls.

Total Calls
Recent changes
Traceable offers another powerful option for viewing new and updated APIs within the selected time range. The screenshot below shows that the recent changes section lists all the latest and updated APIs. When you hover the mouse over Update, a pop-up window displays the number of new parameters and the parameters being learned. These parameters are divided into request and response parameters as shown below.
.gif)
Recent Changes