Updates (April 2026 to June 2026)
April 2026 — Updated the topic to add information about evidence for sensitive data discovery-related events.
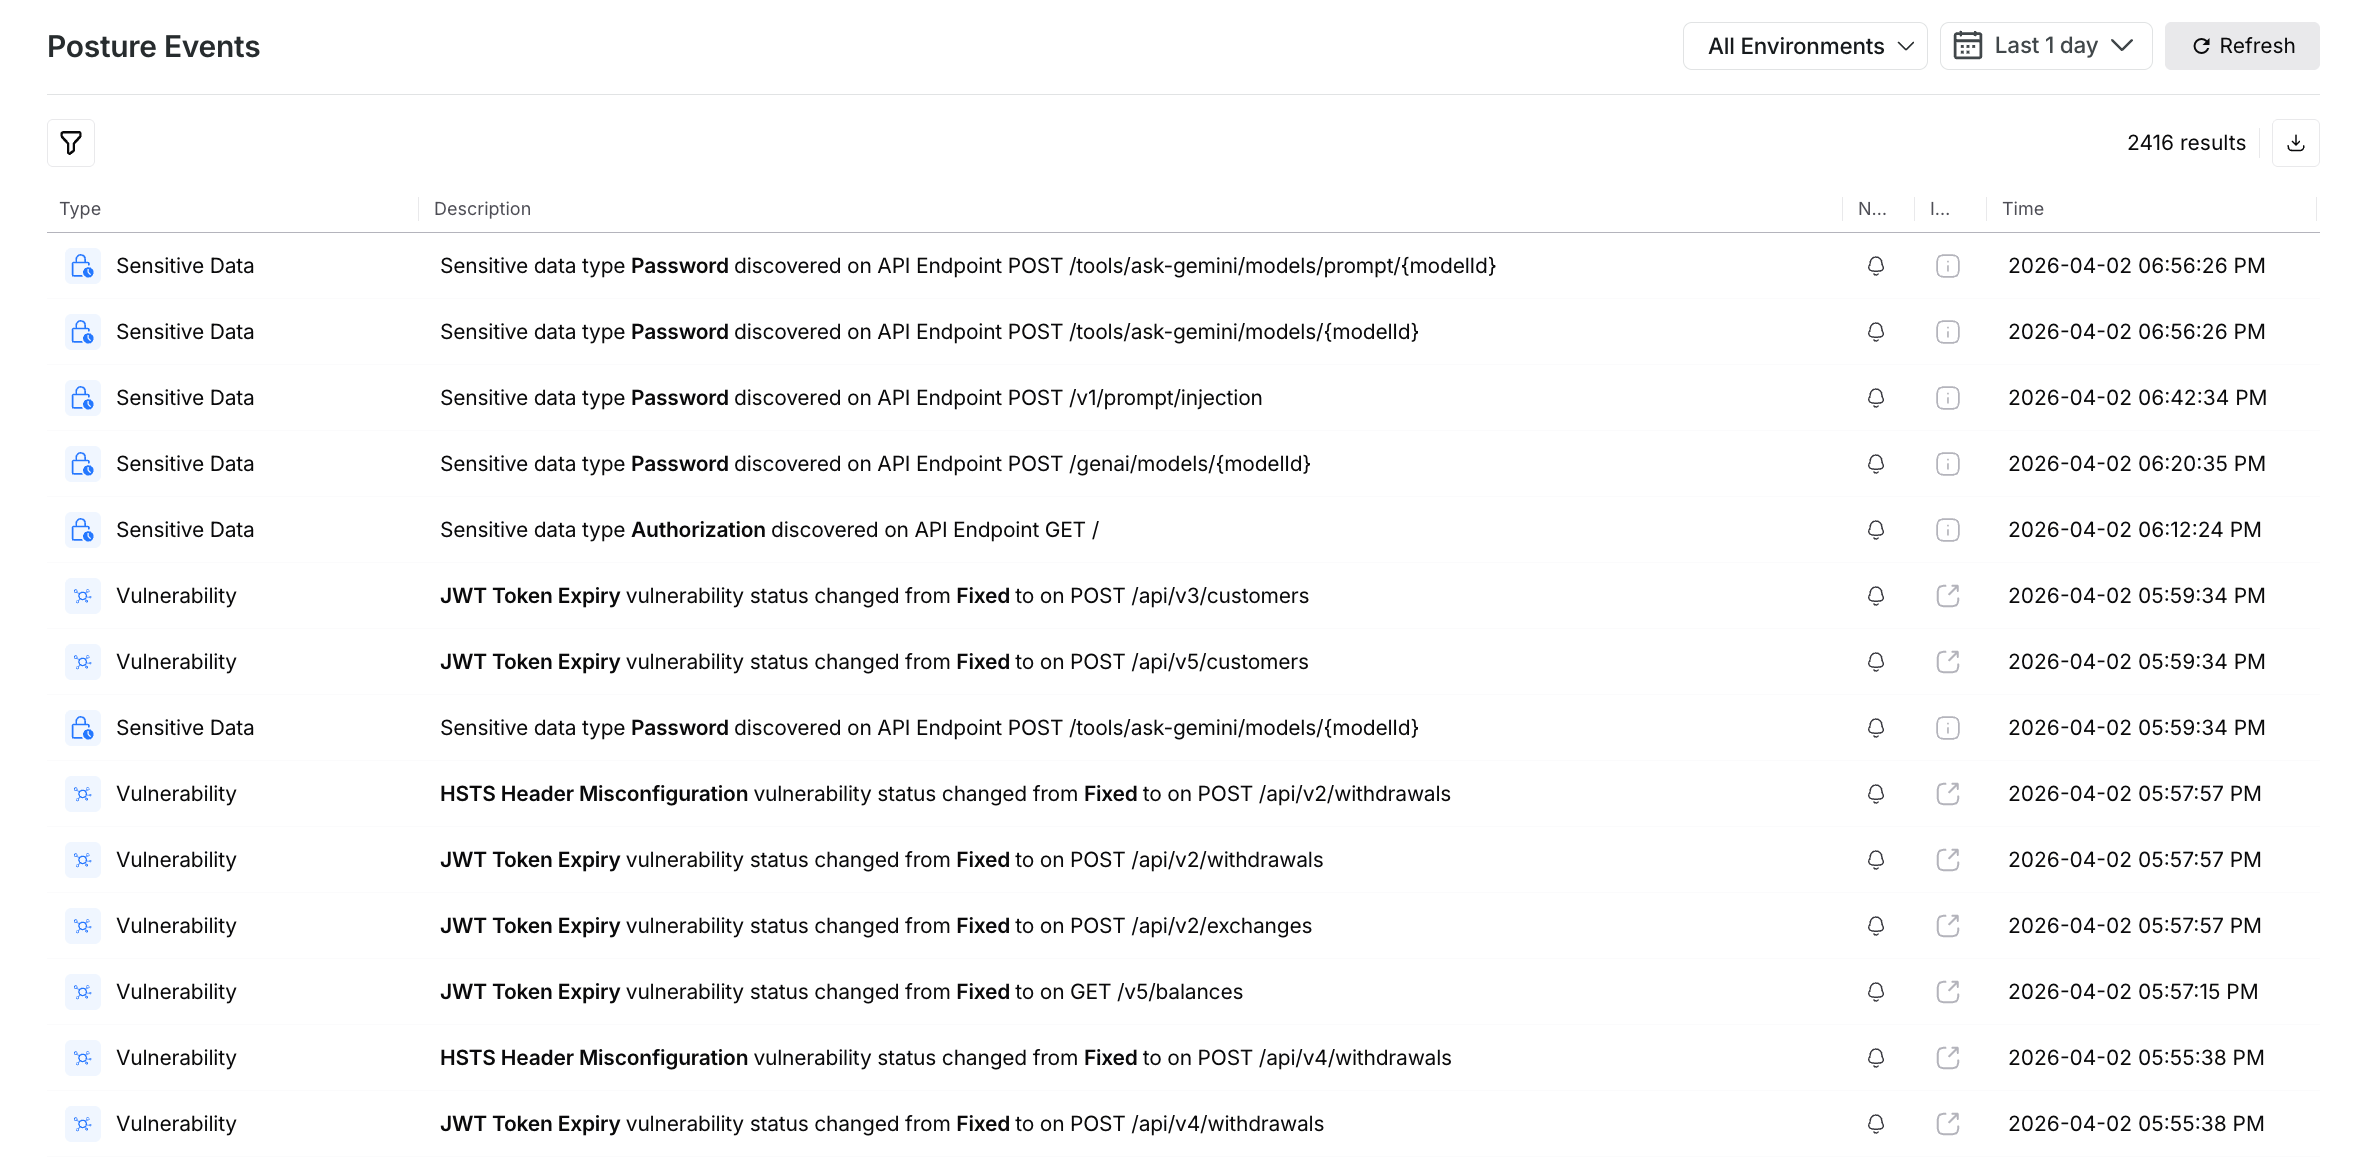
Posture Events in Discovery capture specific events, including issue (vulnerability) discovery, API discovery, changes to an API’s risk score, and sensitive data discovery, among others. You can see these events in the Posture Events page for your selected time duration and environment. The page represents the following:
Component | Description |
|---|---|
Type | The type of change event occurring in your application. For example, Sensitive Data discovery. |
Description | The description of the event. |
Notification | The icon indicates whether notifications are enabled for that event type. For example, the notification icon corresponding to a Sensitive Data event shown in the screenshot below. |
Info | The link to view detailed information about the event. For sensitive data discovery events, Traceable also displays evidence, such as the Request URL, Location, and Timestamp. |
Time | The time at which Traceable observed the event. |
The events are displayed in reverse-chronological order by default, with the most recent at the top.
Posture Events
The following table lists the events that Traceable captures:
Event | Description |
|---|---|
Risk Score Change | If the risk score category of an API changes. For example, the risk score of an API changes from 2 to 3, making it a Medium risk API from a Low one. |
Service Discovery | If Traceable discovers a new service in your application. For more information, see Domains and Services. |
Vulnerability Discovery | If Traceable discovers a new issue (vulnerability) in your APIs. For example, the Lack of Encryption vulnerability in an API. For more information, see Issues. |
Domain Discovery | If Traceable discovers a new domain in your application. For more information, see Domains and Services. |
Backend Discovery | If Traceable discovers a new backend in your application. |
Third Party Domain Discovery | If Traceable discovers a new third-party service in your application. For more information, see Third-party. |
Third Party API Discovery | If Traceable discovers a new third-party API in your application. For more information, see Third-party. |
Sensitive Data Discovery | If Traceable discovers sensitive data flowing through your APIs that was not flowing earlier. For example, Credit Card PIN. For more information, see Sensitive Data. |
API Discovery | If Traceable discovers learned API endpoints in your application. For more information, see API Endpoints. |
Sensitive Data sent to 3rd Party APIs | If Traceable discovers that sensitive data is being sent to a third-party. For example, Credit Card details. For more information, see Third Party. |
Vulnerability Status Change | If Traceable discovers any change in the vulnerability status. For example, a vulnerability status change from Open to Under Review. |
You can click the icon in the Info column for any event to view its details; however, the details depend on the event type you select. For example, upon clicking on a Vulnerability Discovery event type, the page displays the issue along with its details, such as source, severity, CVSS score, the API endpoint where it was found, and its mitigation suggestions.
For Sensitive Data Discovery events, the details panel also displays evidence that you can use to drill down into a specific event. Each row in this evidence displays the Request URL, Location (component and key), Status, and Timestamp. You can also click a row to view the request, response payload, and its attributes.
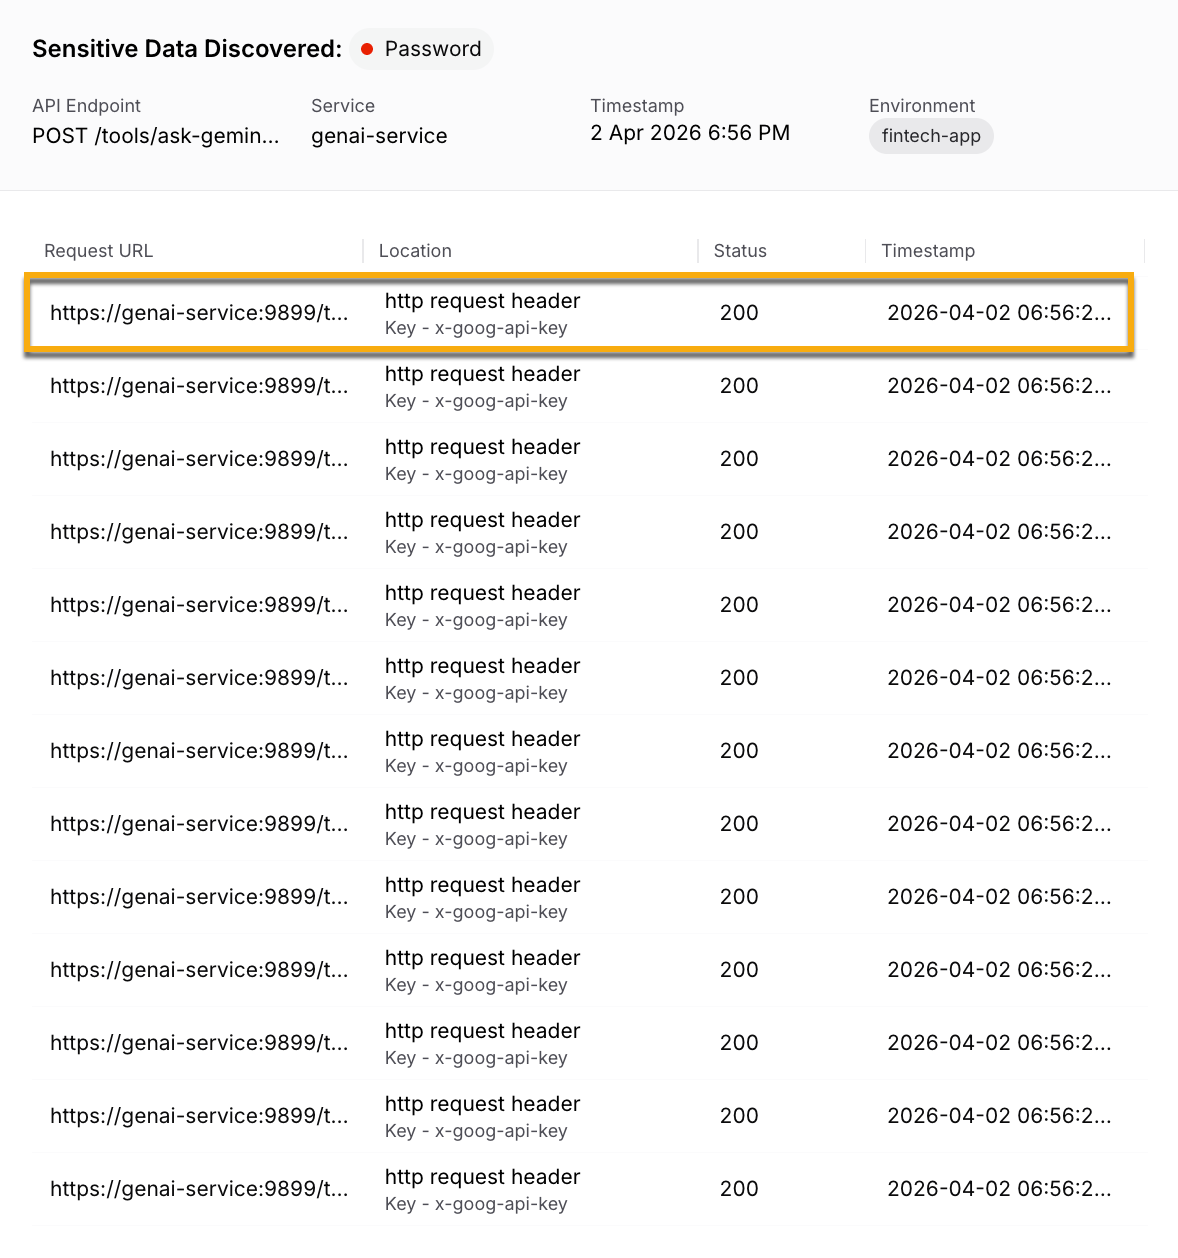
Sensitive Data Discovery Event Evidence
Traceable also allows you to drill down into the events displayed on the Posture Events page by filtering the data according to your requirements, such as event type, endpoint name, and more. You can add as many filters as you wish to drill down or search for a specific event. Once you have filtered the events based on your search criteria, you can view detailed information for each event by clicking on it. You can also click the Download icon (![]() ) in the page’s top right corner to download the list of events as a CSV file. While downloading, you can also select the number of rows you want to download from the list.
) in the page’s top right corner to download the list of events as a CSV file. While downloading, you can also select the number of rows you want to download from the list.
In addition to the above features, you can also set up custom notifications for specific event types that you wish to receive. For the steps to do this, see Notification. Once done, Traceable displays the notification icon for the event type, as shown in the screenshot above.