Traceable provides a comprehensive view of your API ecosystem by automatically discovering and categorizing your application’s domains, services, and backends. It tracks API traffic, monitors performance metrics, and identifies security threats in real-time. The platform enables you to view detailed information about your APIs, including endpoints, latency, call activity, and errors.
Traceable provides an extensive view of your applications by automatically discovering and categorizing the domains, services, and backends within your application. It tracks the data flowing through your APIs, monitors performance, and identifies security threats in real-time. The Traceable platform provides comprehensive information about your APIs, including a list of endpoints, latency, call activity, and errors.
With Traceable, you can:
Analyze the interactions between APIs across Domains, which represent logical groups of APIs.
Drill down into Services, representing specific components or microservices within your application ecosystem.
Monitor Backends, which are external systems or databases with which your APIs interact.
Traceable also provides traces of API requests for each domain, service, and backend, showing detailed information such as protocols, status, duration, and start time. This enables you to conduct a detailed analysis of the API's behavior. Additionally, the time-series charts on latency, error rates, and call volumes help track the overall performance of the APIs and optimize your system.
Traceable lists the data for domains, services, and backends across All Environments by default. You can view these details for a specific environment by selecting it from the Environments drop-down in the page’s top right corner. Additionally, Traceable provides you with filters that allow you to fine-tune the results displayed on the page. You can open the filter pane by clicking the Filter (![]() ) icon in the page’s left top corner. The pane shows the following tabs:
) icon in the page’s left top corner. The pane shows the following tabs:
Filters — This is the list of filters available for you to choose from.
Saved — This is the list of filters that you have saved for later use.
Recent — This is the list of recently applied filters.
While Traceable shows some columns for the domains, services, and backends by default, you can edit the layout to add or remove columns according to your requirements. To do so, click the Ellipse (![]() ) icon in the page’s top right corner and click Edit Columns. Add or remove columns in the pop-up window, adjust the layout according to your requirements, and click Apply.
) icon in the page’s top right corner and click Edit Columns. Add or remove columns in the pop-up window, adjust the layout according to your requirements, and click Apply.
Domains
The Domains tab under Inventory lists the domains Traceable has discovered in your application. The page displays the following information for a domain:
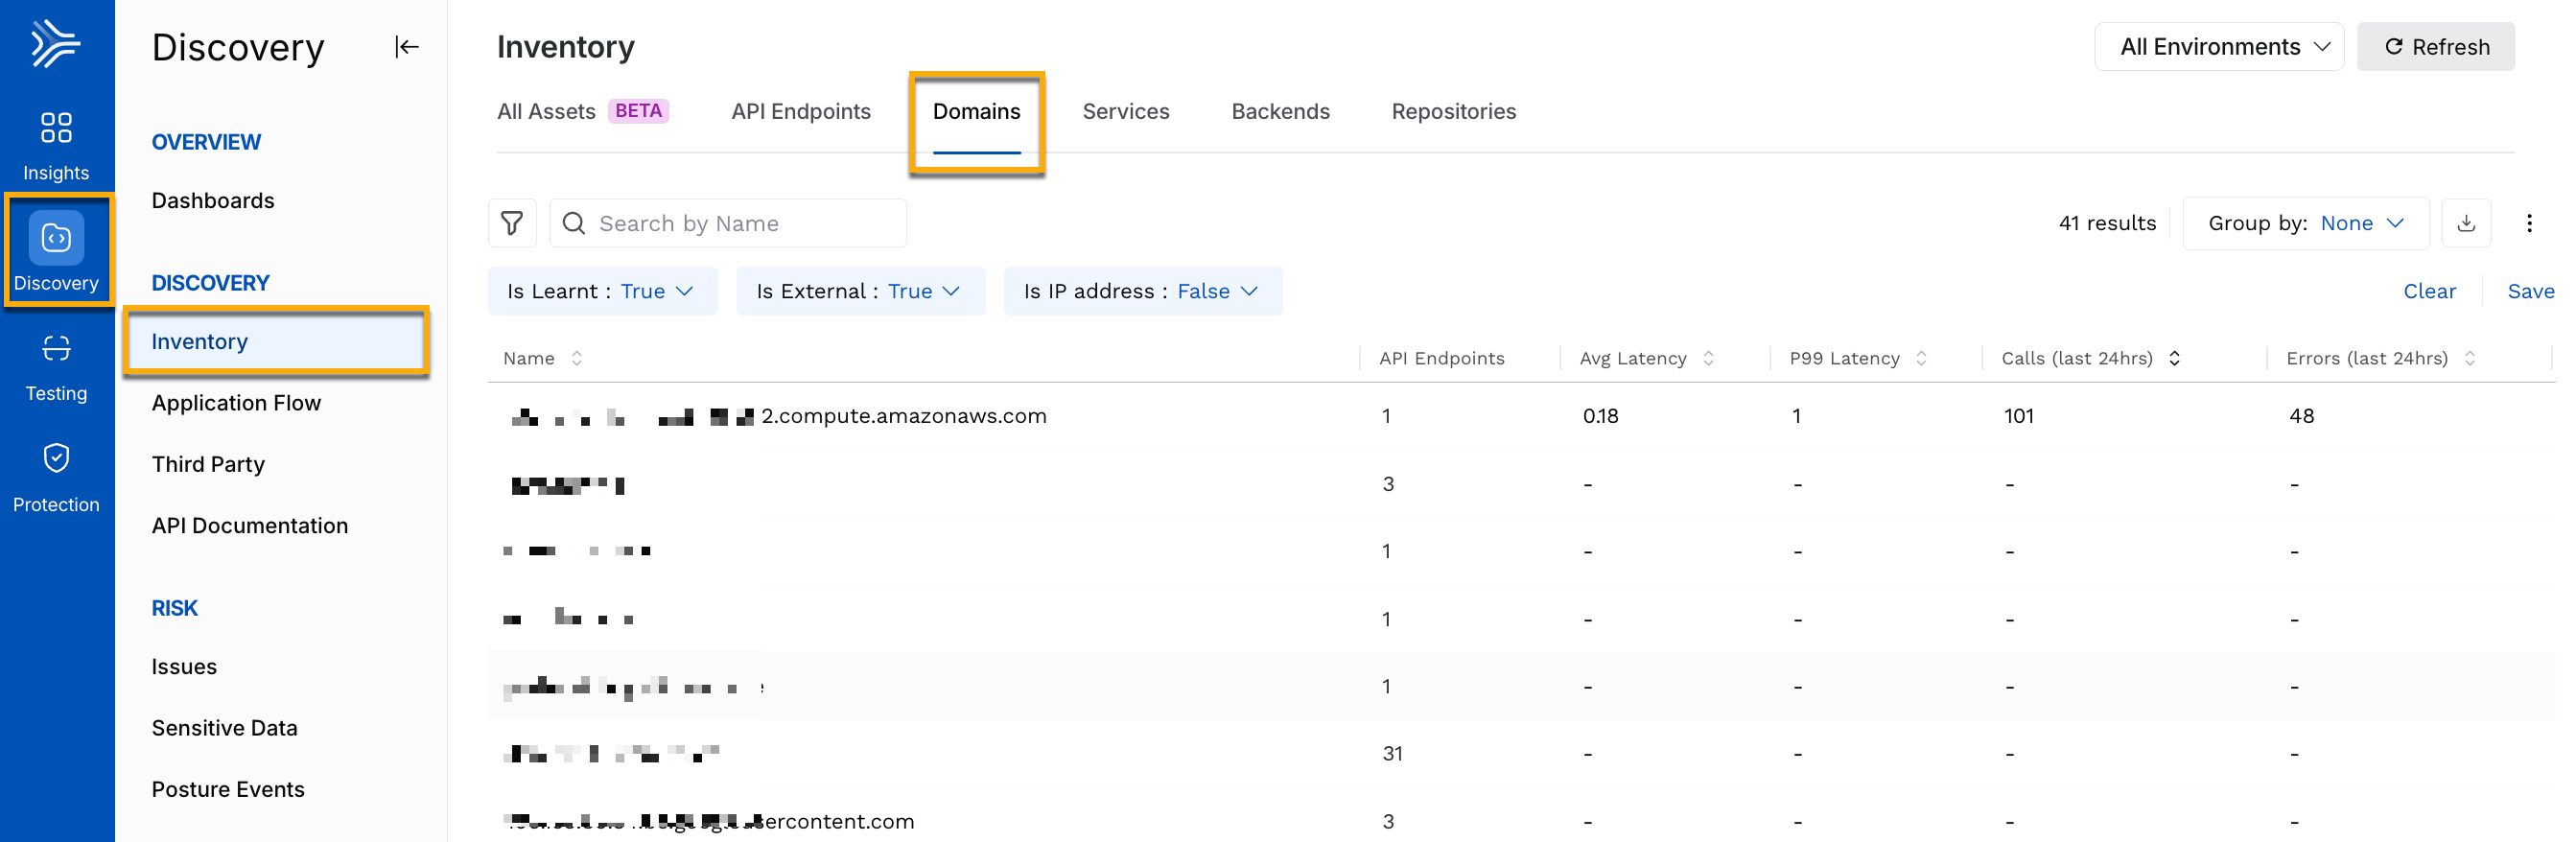
Name
API Endpoints
Avg (Average) Latency
P99 latency
Calls in the last 24 hours
Errors in the last 24 hours
The Domains tab displays data with the Is Learnt, Is External, and Is IP Address filters applied by default. However, you can also use the following filters on the page:
Domain name — Displays data based on the name of the domain Traceable has discovered.
Is External — Displays data based on whether the domain is discovered from external or internal sources.
Is IP address — Displays data based on whether it is an IP address or not.
Is Learnt — Displays data based on whether the domain is learned or not.
Note
A domain is deemed learned if it has at least one learned API under it.
You can click on the domain name to view detailed information for it. The following tabs are displayed for each domain:
.png)
Overview
Endpoints
Events
Traces
Metrics
Services
The Services tab under Inventory lists the active services Traceable has discovered in your application. The page displays the following information for a service:
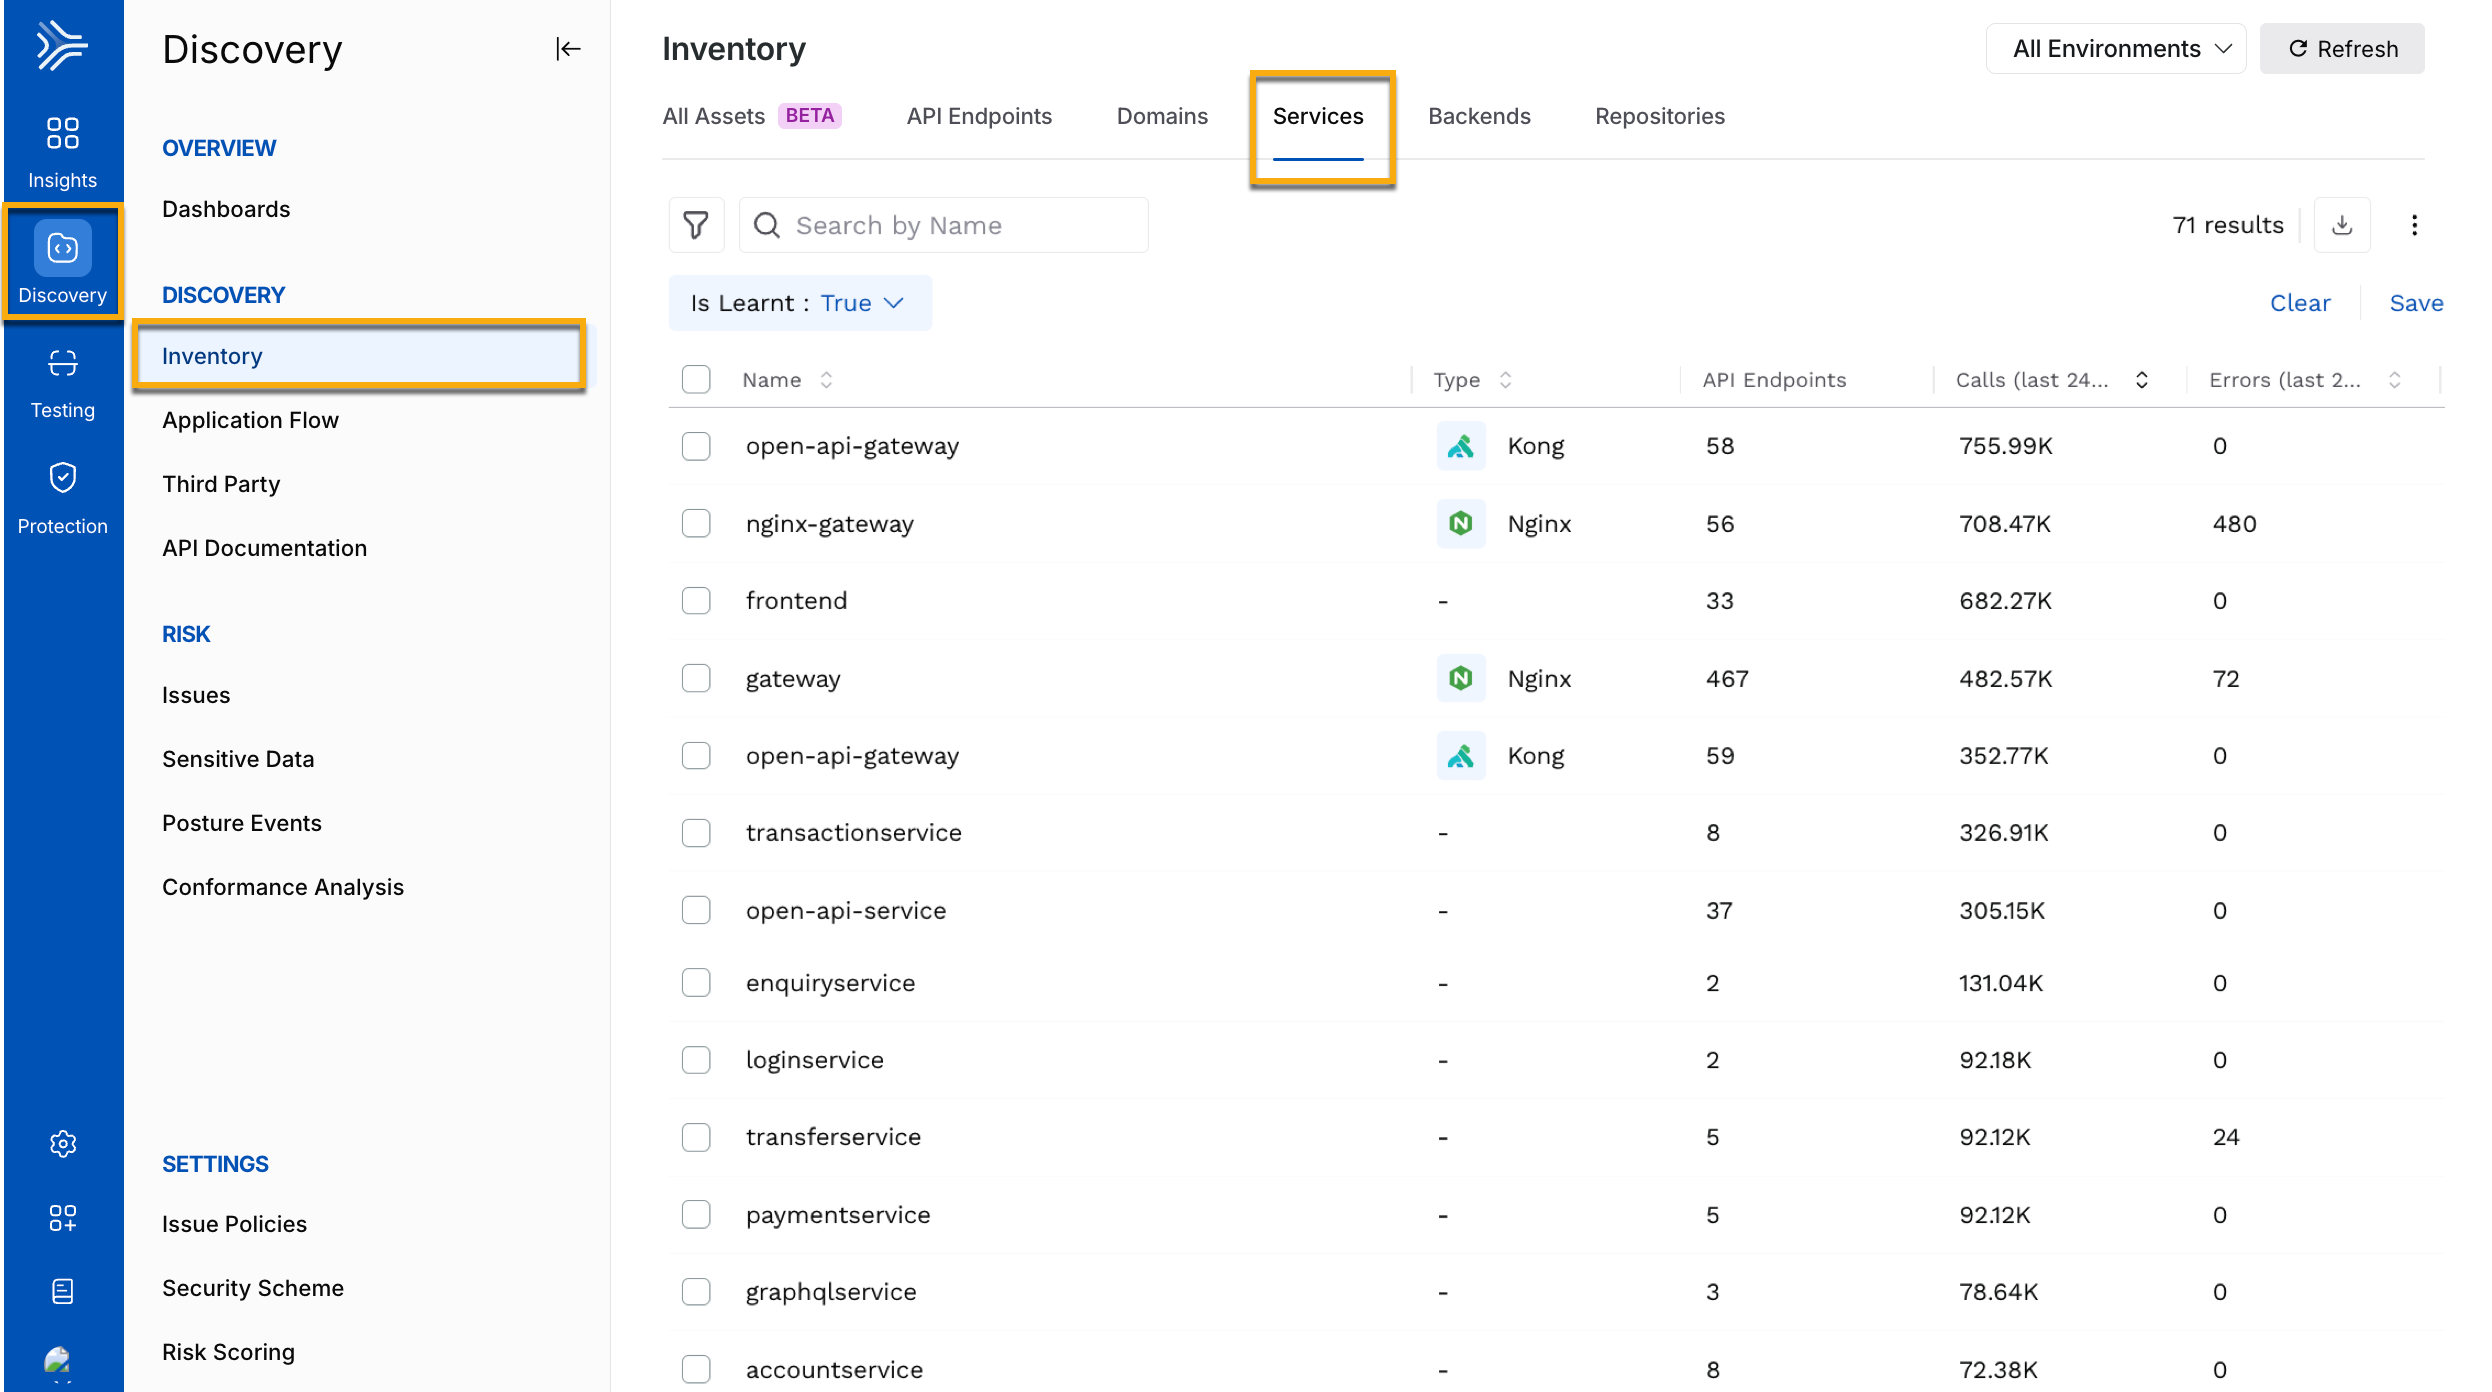
Name
Type
API Endpoints
Calls in the last 24 hours
Errors in the last 24 hours
The Services tab displays data with the Is Learnt filter applied by default. However, you can also apply the following filters on the page:
Is Learnt — Displays data based on whether the service is learned or not.
Note
A service is deemed learned if it has at least one learned API under it.
Labels — Displays data based on labels assigned to services.
Service Name — Displays data based on the name of the service Traceable has discovered.
Service Type — Displays data based on the type of service discovered.
You can click on the service name to view the detailed information for it. The following tabs are displayed for each service:
Overview
Endpoints
Malicious Behaviors
Traces
Metrics
Backends
The Backends tab under Inventory lists the backends Traceable has discovered in your application. The page displays the following information for a backend:
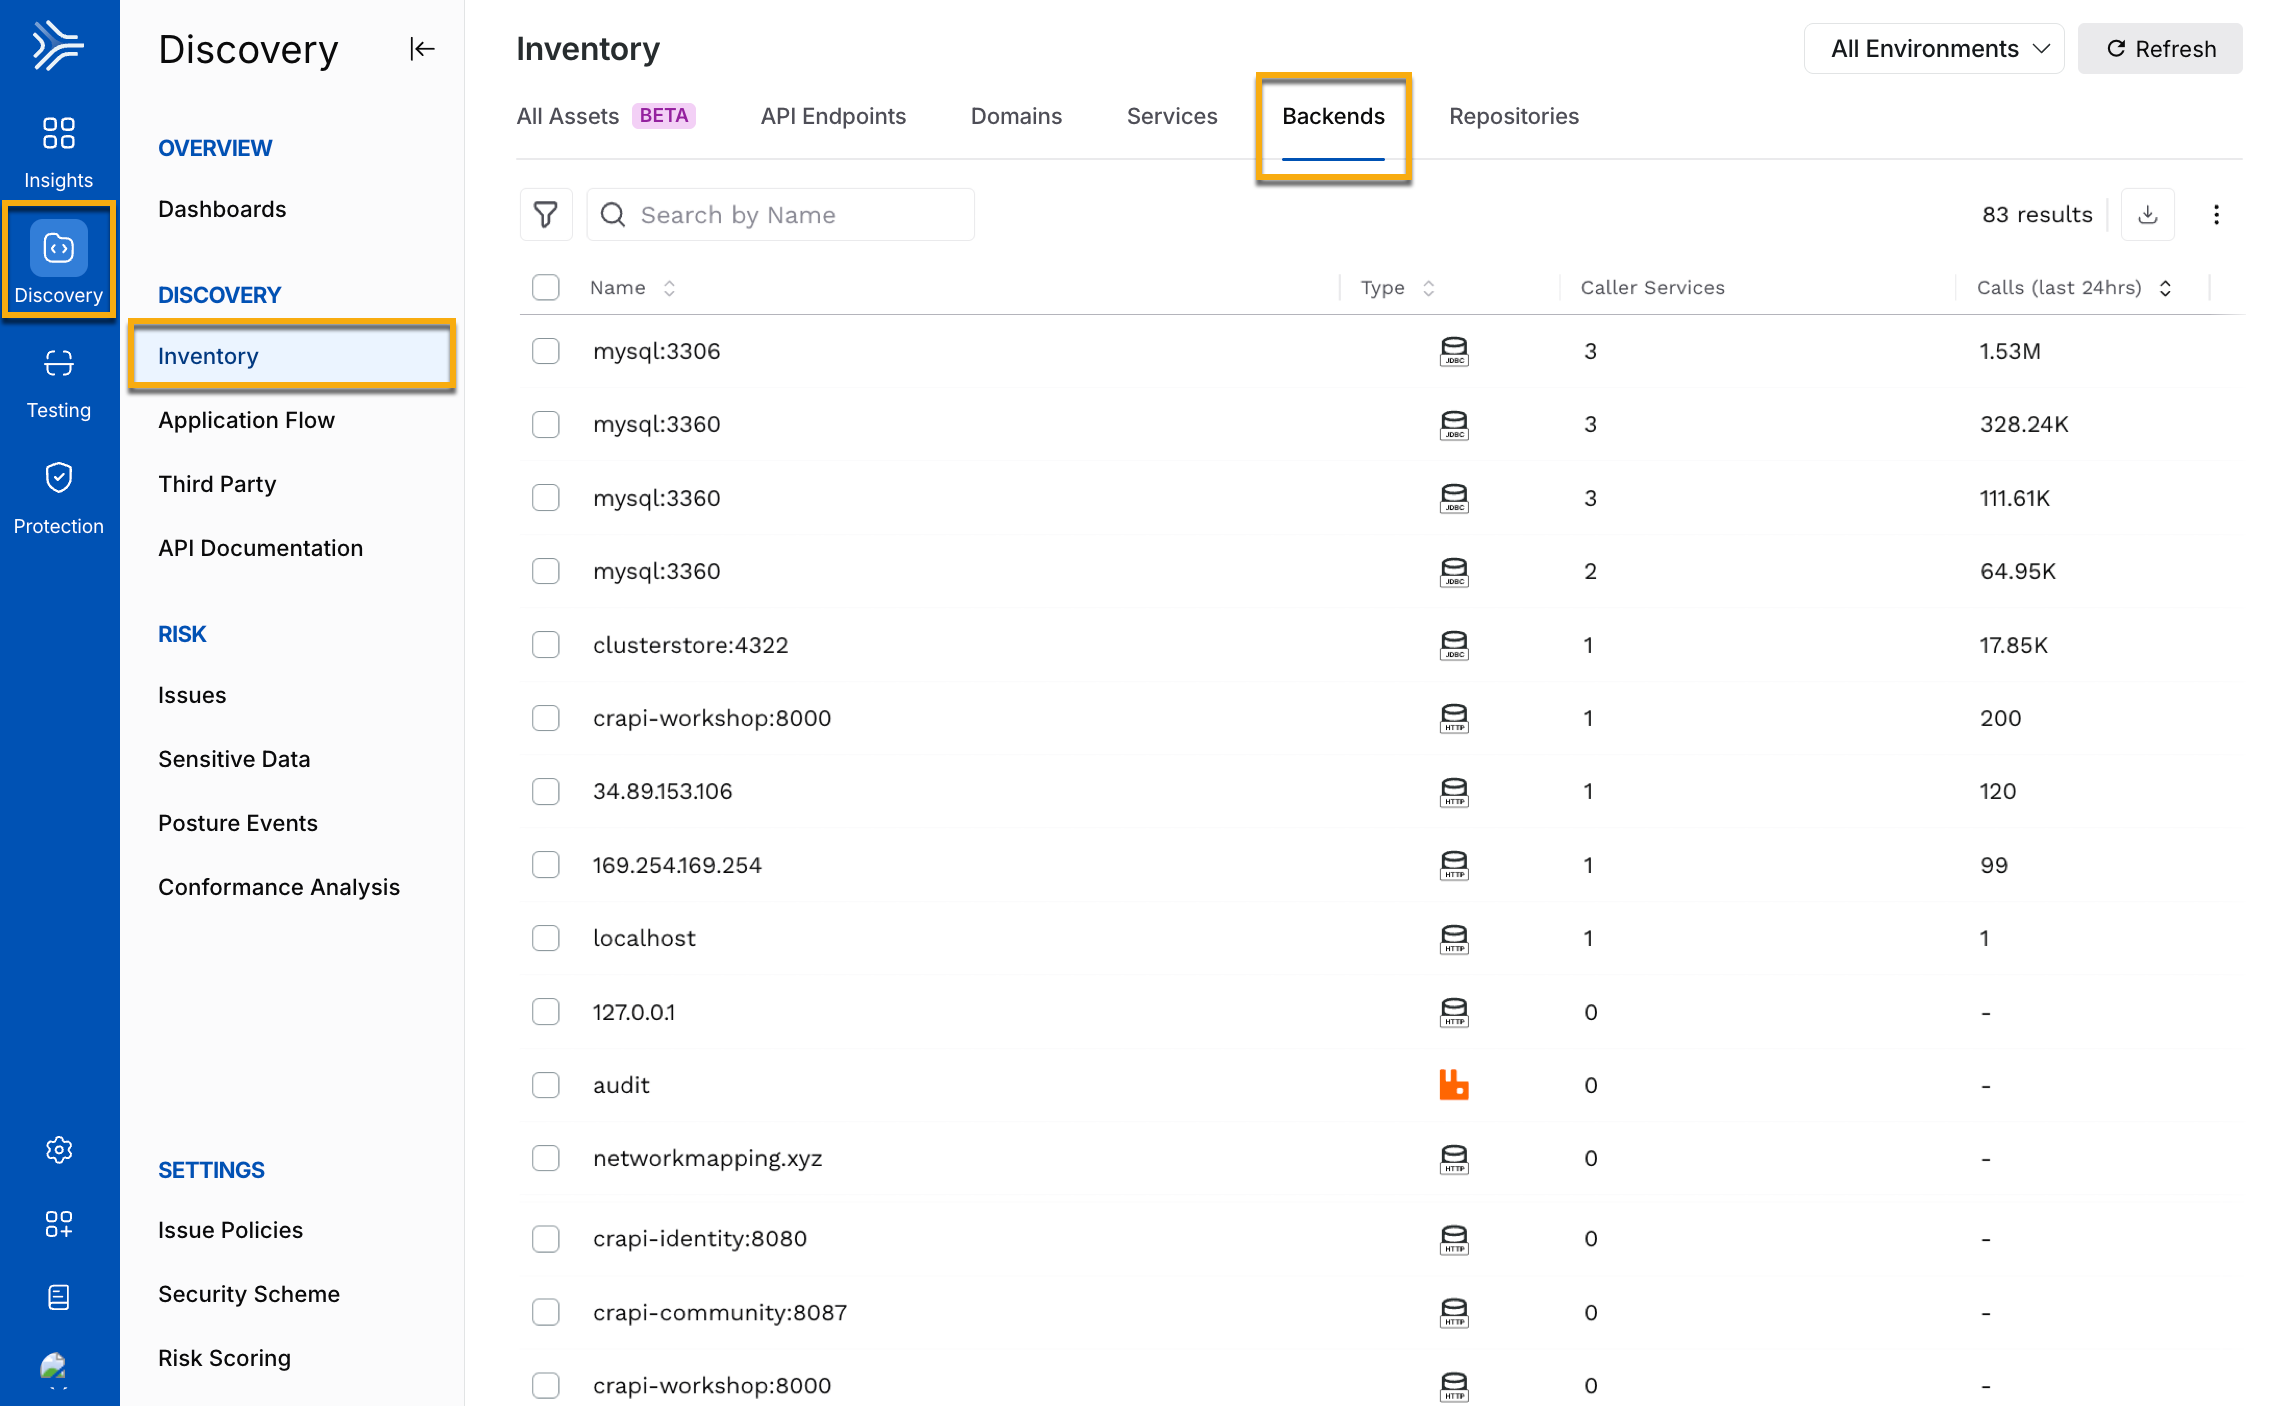
Name
Type
Caller Services
Calls in the last 24 hours
The Backends tab provides the following filters on the page:
Backend Name — Displays data based on the name of the backend Traceable has discovered.
Backend Type — Displays data based on the type of backend discovered.
Labels — Displays data based on labels assigned to backends.
You can click on the backend name to view the detailed information for it. The following tabs are displayed for each backend:
Overview
Events
Traces
Metrics
The following sections explain the various tabs displayed for each domain, service, and backend:
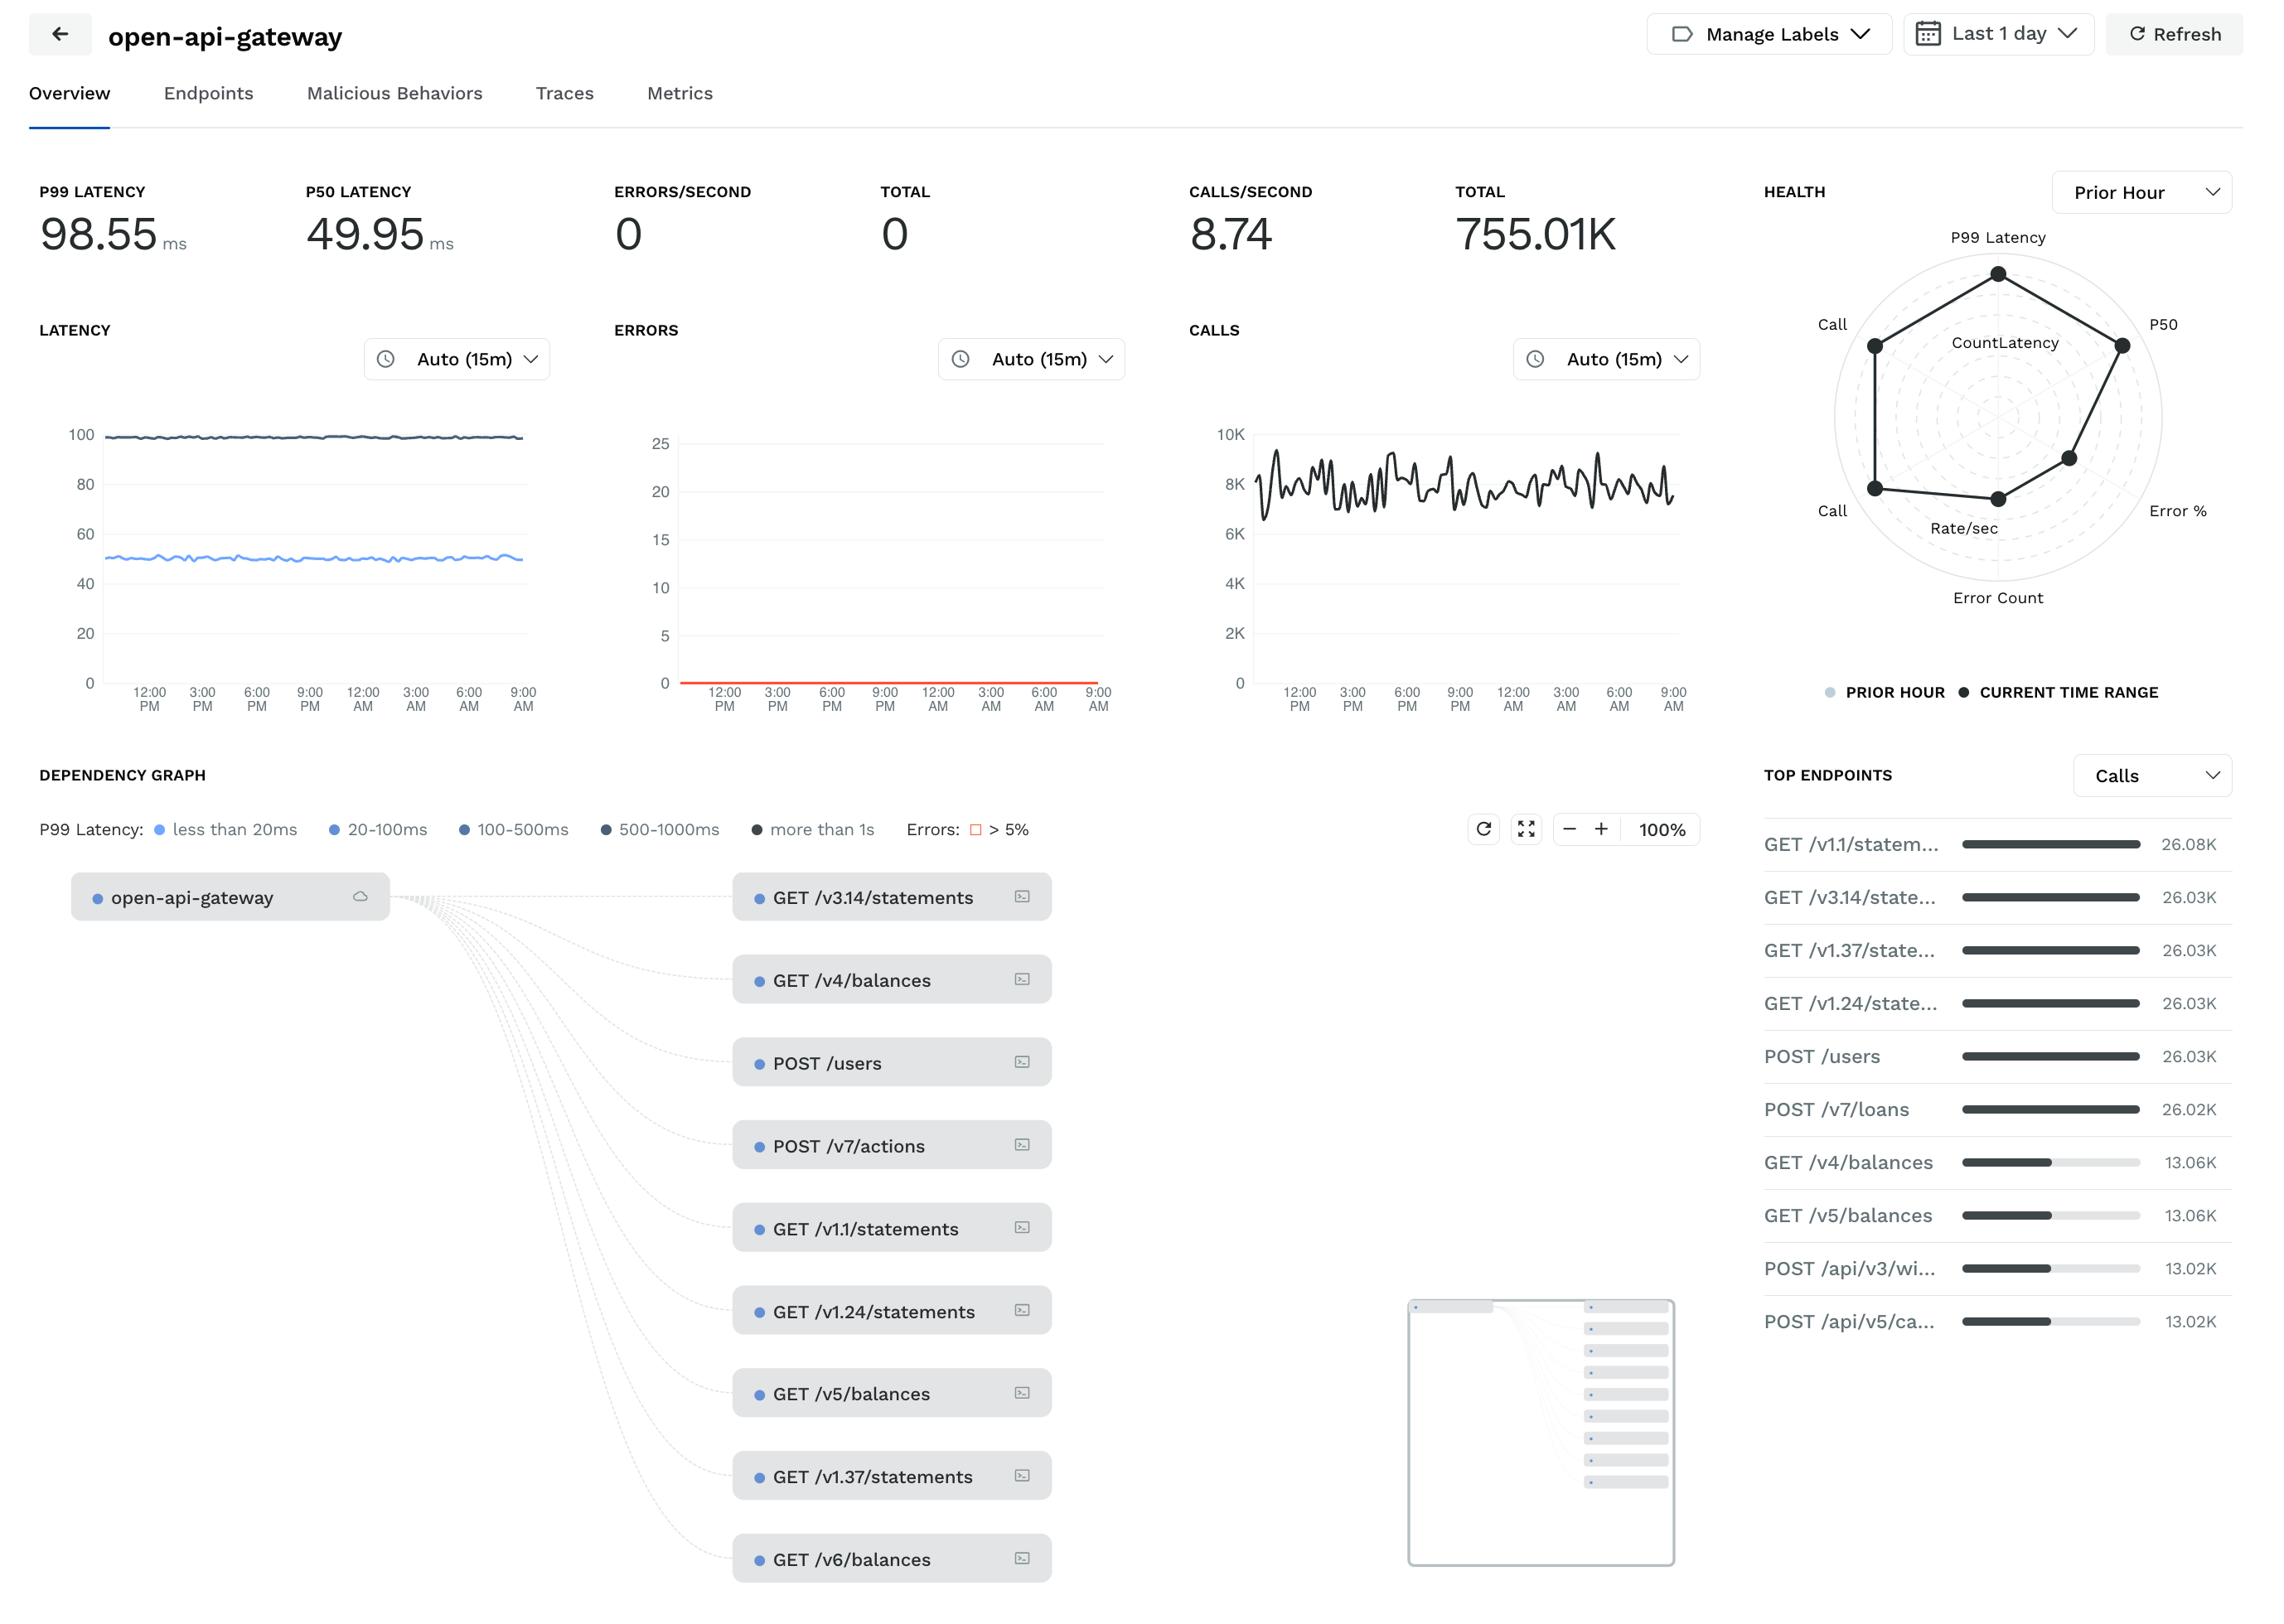
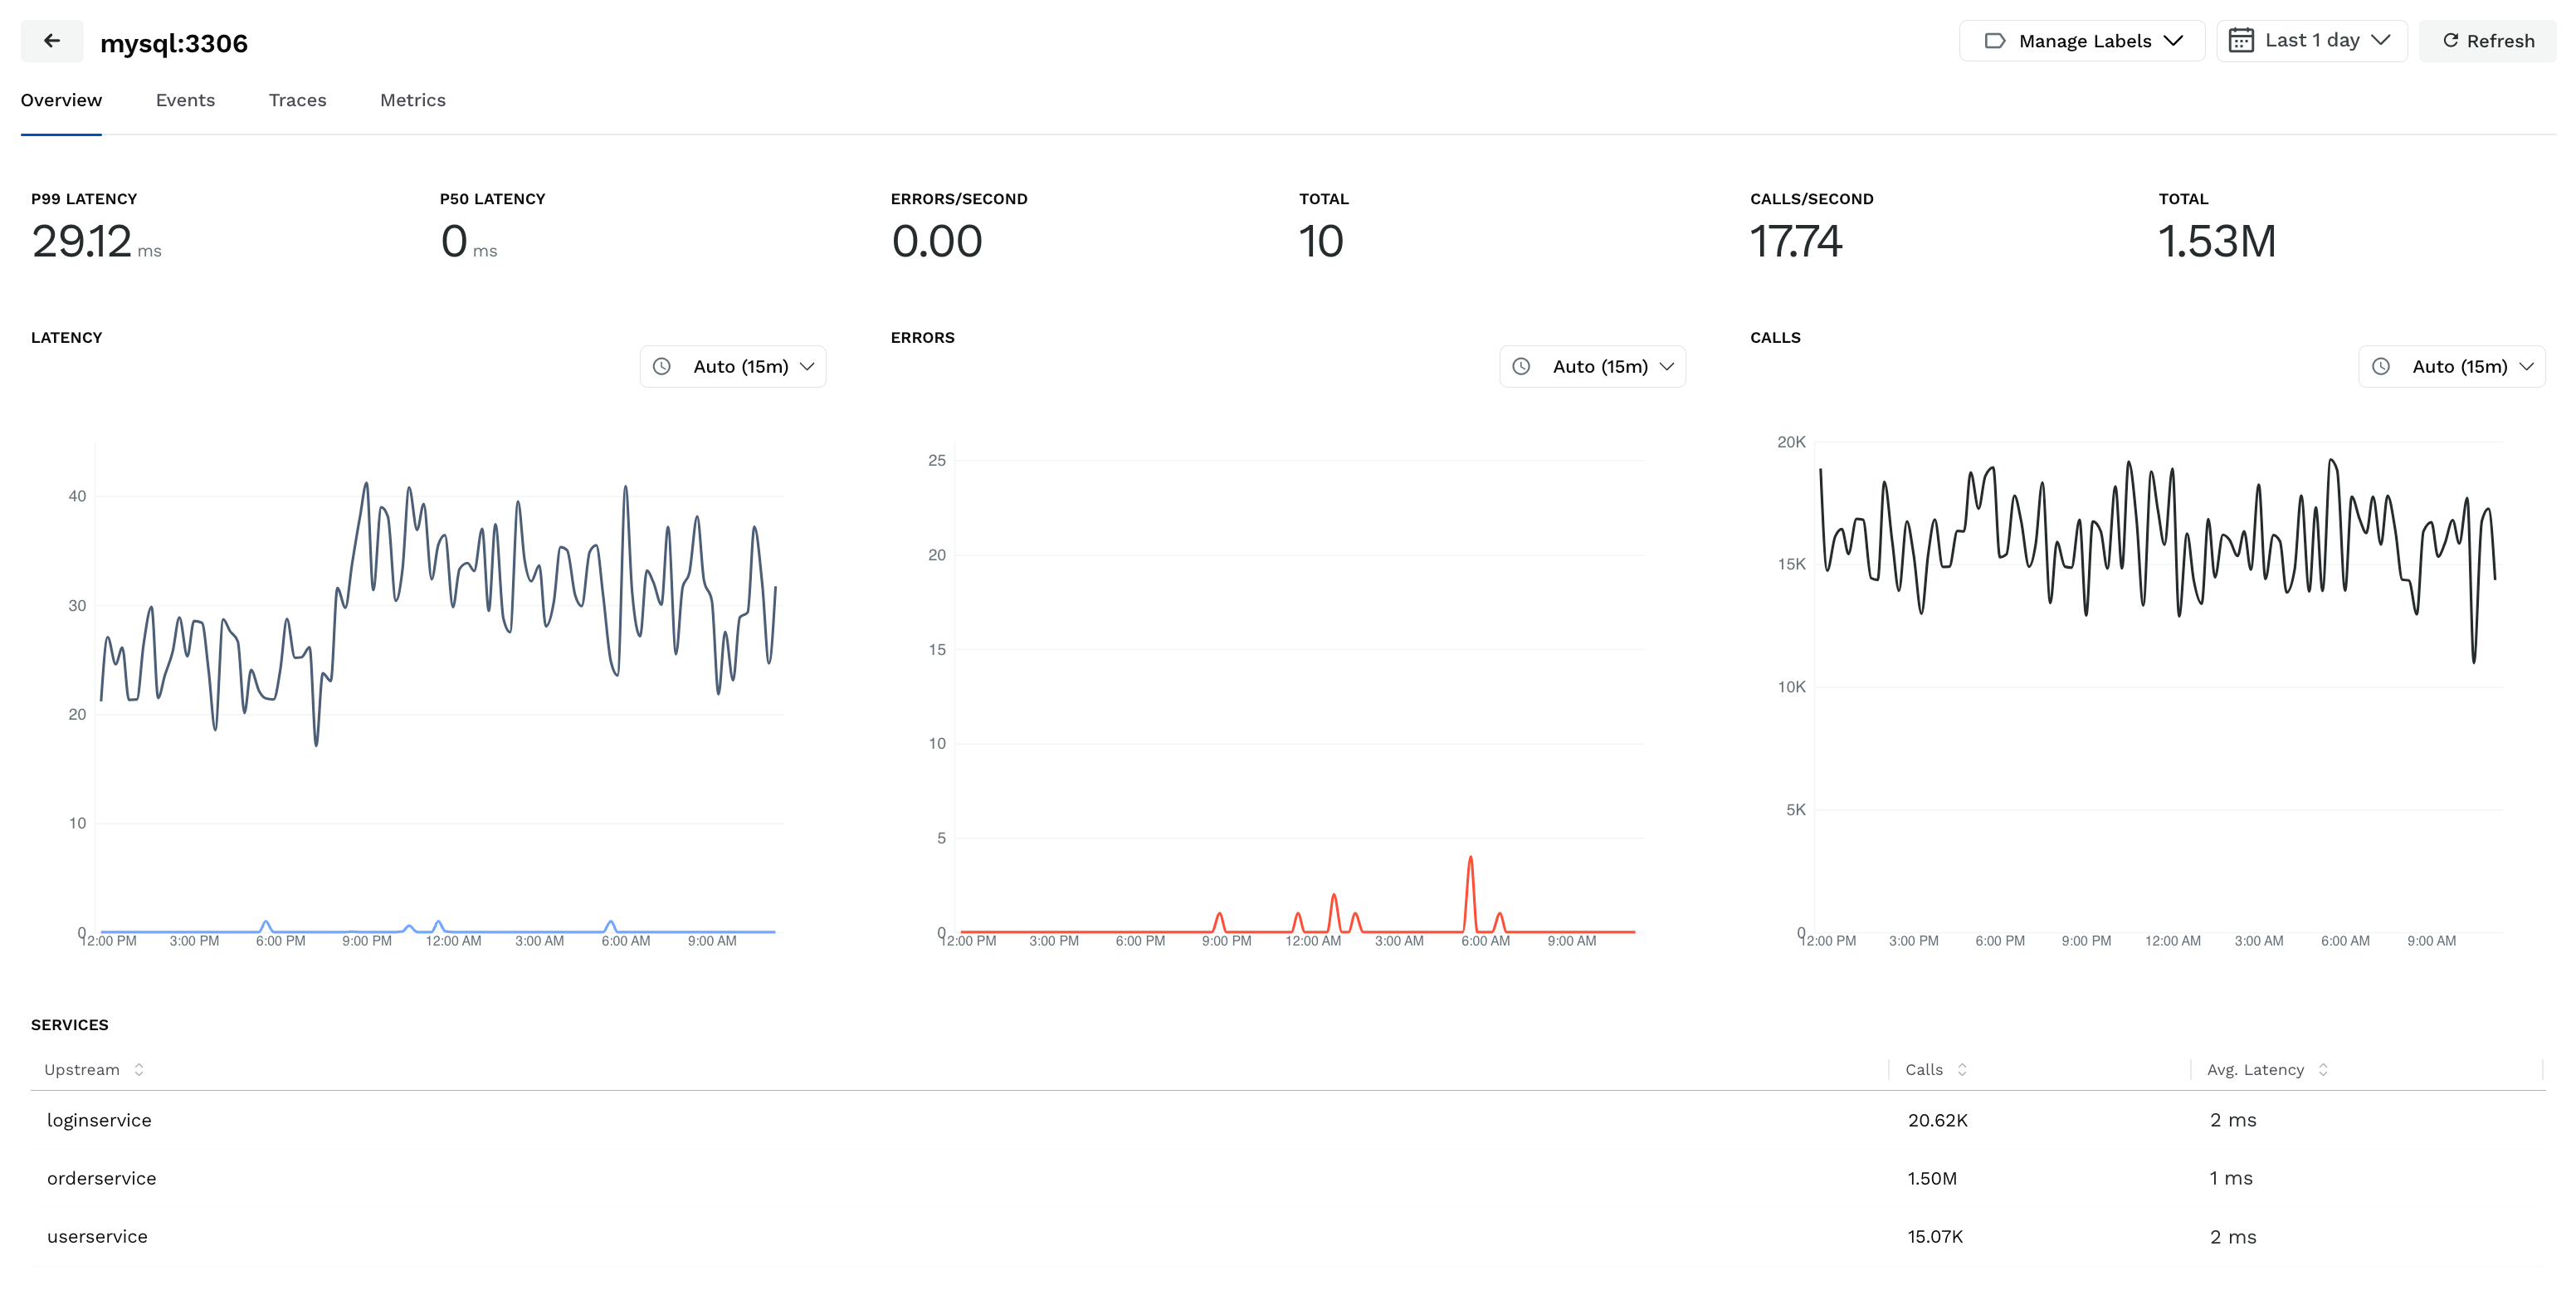
Overview
The Overview tab shows the following performance indicators for each component:
The P99 and P50 latency numbers, along with the Latency time series chart.
The errors per second and total errors along with the Errors time series chart.
The API calls per second, total calls, and the Calls time series chart.
(For Domains and Services only) The health chart of the domain and service, along with the list of top API endpoints, is sorted on the basis of calls.
(For Services only) The dependency graph with the interconnect of services and the URLs. When you hover the mouse over the interconnect of the services, it displays the communication latency between them. If Traceable observes errors for any service, that service is shown in red color, and upon hovering, the interconnecting path shows the error percentage.
(For Backends only) The list of services as part of the backend along with the number of calls and average latency for each. You can click on a service to view its details.
Endpoints
The Endpoints tab is available for domains and services only, with each of them showing the following details:
The endpoint name under that domain or service.
The sensitive datatypes discovered in that endpoint.
The risk score associated with the endpoint.
The number of calls made to the APIs in the last 24 hours.
The time at which the endpoints were last called.
The tab displays data with the Is Learnt filter applied by default. However, the tab also provides other filters that you can use to fine-tune the results displayed on the page. You can apply filters based on the following categories:
Security Posture — This category lists filters to view APIs based on sensitive datatypes, datasets, authentications, risk categories, etc.
API Definition — This category lists filters to view APIs based on authentication types, encryptions, creation time, labels, domain names, etc.
Traceable — These are Traceable’s custom filters to view APIs based on whether they are learned, their discovery state, etc.
Deployment — This category lists filters to view APIs based on the environment and service.
API Ownership — This category lists filters to view APIs based on their ownership across various functions, such as developers and quality assurance.
You can also download the data shown on the page by clicking the Download (![]() ) icon in the tab’s top right corner. While downloading, you can also select the number of rows you want to download.
) icon in the tab’s top right corner. While downloading, you can also select the number of rows you want to download.
While Traceable shows some columns for the Endpoints tab by default, you can edit the layout to add or remove columns according to your requirements. To do so, click the Ellipse (![]() ) icon corresponding to the download icon and click Edit Columns. In the pop-up window, add or remove the columns, adjust the layout according to your requirements, and click Apply.
) icon corresponding to the download icon and click Edit Columns. In the pop-up window, add or remove the columns, adjust the layout according to your requirements, and click Apply.
Events/Malicious Behaviors
The Events (for domains and backends)/Malicious behaviors (for services) tab shows the following information:
The type of malicious behavior observed in the component.
A description of the malicious behavior providing the essential details.
The category to which the malicious behavior belongs.
(For domains and services only) The APIs in which Traceable observed the malicious behavior.
The timestamp at which Traceable observed the malicious behavior.
While the tab shows the list of malicious behaviors/events observed in the components, you can click the each row to view detailed information about it. Traceable redirects you to the Threat Activity page under Protection, where you can view information such as Event details, description, mitigation, impact, etc.
Traces
The Traces tab provides the list of traces discovered for the component. It shows the following information:
(For domains and services only) The type of protocol used to transmit the data, for example, HTTP, HTTPS.
(For backends only) The name of the trace.
(For domains and services only) The API endpoint associated with the trace.
(For domains and services only) The URL associated with the trace.
(For services only) The number of calls made by the API while processing a request.
(For domains and services only) The status or outcome of the API request, indicating whether it was successfully processed or had an issue.
(For services only) The number of errors encountered while processing the API request, if any.
The duration or time taken to process the API request.
The start time or the timestamp at which the API request was initiated.
You can expand each trace to view detailed information about it, such as trace ID, entry span ID, request, response attributes, etc. You can also filter the data shown on the page according to your requirements. To do so, you can click on the search bar at the top of the tab and select the attribute(s) based on which you want to filter the data.
Metrics
The Metrics tab shows time series charts with each chart showing data for the 5 minutes by default. The charts are shown for the following:
Latency numbers (P50, P95, P99, and average)
Errors (Percentage and Rate)
Number of calls
Data Transfer numbers (Request, Response, Request rate, and Response rate)
You can hover over the chart to view the numbers for the above metrics at a certain point in time. You can also change the duration for each chart separately to view the data according to your requirements.