Updates (July 2025 to September 2025)
September 2025 — Updated the page to reflect the new user interface and added details on managing third-party data, while carrying out multiple actions on it.
A Third Party is a service provided by an external organization or individual that you use to add specific features or integrate into your application. Traceable automatically identifies the third parties used in your application and displays them on the Third Party page. The page provides detailed information about the APIs associated with these third parties, along with the sensitive information flowing from your system to them, the number of calls made, and other relevant metrics.
(1).png)
Third Party
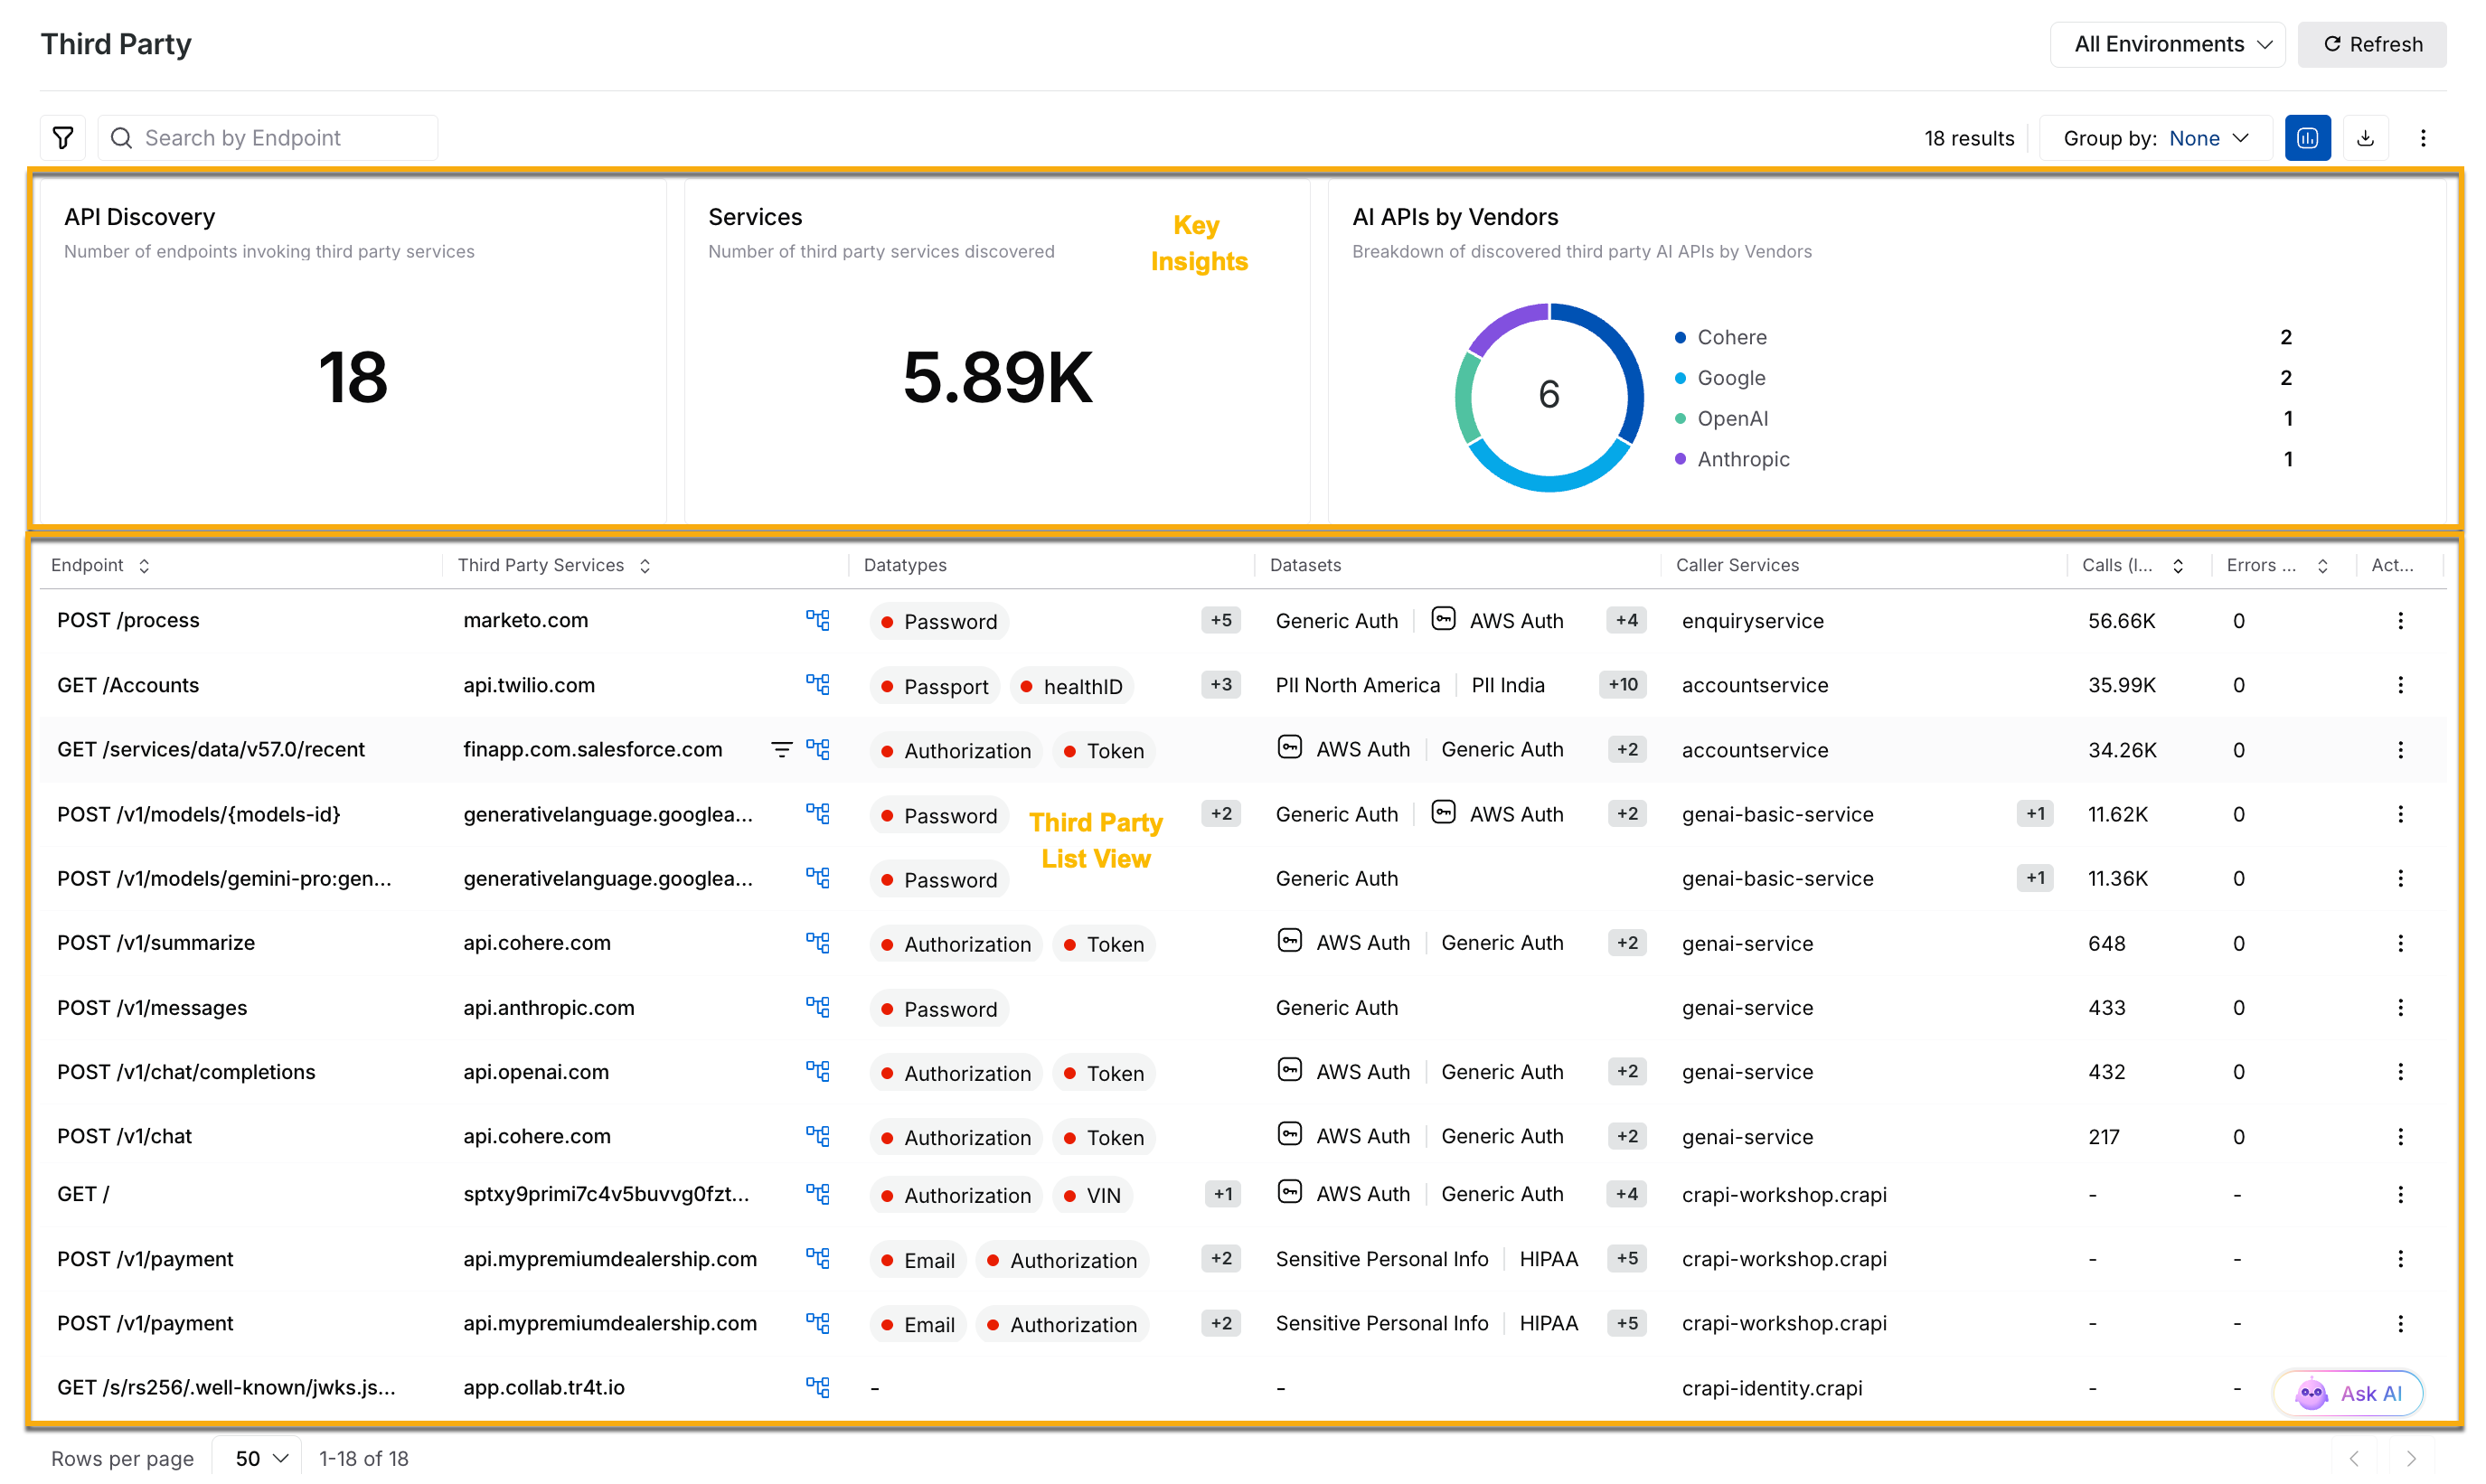
To view the Third Party page, navigate to Discovery → Third Party. In the page’s top right corner, you can click the Environment drop-down and select the environment for which you wish to view the data.
What will you learn in this topic?
By the end of this topic, you will understand:
The concept of third-party services and their role in your application.
The data visible on the Third Party page, including endpoints, data types, datasets, and other metrics. For more information, see Understanding the data visible on the Third Party page.
The way you can leverage the data shown on the Third Party page. For more information, see Leveraging the data visible on the Third Party page.
The way you can manage third party APIs. For more information, see Managing third party APIs.
The actions that you can perform on the Third Party page. For more information, see Actions on the Third Party page.
Understanding the data visible on the Third Party page
The Third Party page provides valuable insights and detailed views of how your applications interact with external services. You can use this data to monitor API usage, identify sensitive data flows, and take the necessary decisions to strengthen your application’s security. For more information, see Leveraging the data visible on the Third Party page.
Note
By default, Traceable displays the data on the page for All Environments. To view the data for a specific environment, you can click the Environment drop-down in the page’s top right corner, and select it according to your requirements.

Understanding Third Party Data
Key insights on the page
The page provides a comprehensive overview of third-party services interacting with your application, including:
API Discovery — This widget lists the total number of endpoints that are calling a third-party service.
Services Discovery — This widget lists the total number of third parties identified by Traceable.
AI APIs by Vendors — This widget provides an overview of the AI APIs segregated by vendors discovered by Traceable.
Third Party list view
Traceable displays a list of APIs on the Third Party page, along with the following information for each endpoint in the following columns:
Column | Description |
|---|---|
Endpoint | The API endpoint calling the third-party service. |
Third Party Services | The third party service called by the above endpoint. |
Datatypes | The sensitive data type(s) exposed using the endpoint. |
Datasets | The dataset(s) associated with the datatype(s). |
Caller Services | The services in your application that are calling the third party. |
Calls (last 24 hours) | The number of API calls made in the past 24 hours. |
Errors (last 24 hours) | The number of errors encountered while making the API calls in the past 24 hours. |
Leveraging the data visible on the Third Party page
The data displayed on the Third Party page provides you with actionable insights to manage your application’s interactions with external services. By interpreting and using this information, you can:
Monitor Third Party API Usage — Track how often APIs are calling the third party services in your application and identify spikes or unusual patterns that may indicate issues or misuse.
Identify and Manage Sensitive Data Exposure — Gain visibility into the types of sensitive data exposed to third party services. Use this information to ensure compliance with data protection standards such as GDPR or PCI DSS.
Improve Service Classification and Accuracy — Detect misclassified services or backends and mark them accurately to ensure that monitoring and reporting are based on accurate data.
Investigate Anomalies and Troubleshoot Issues — Explore traffic patterns and error rates to identify performance bottlenecks or unusual interactions between your services and third party APIs.
Optimize Integrations and Service Dependencies — Understand the flow map and identify how caller services interact with third party endpoints. Use this information to enhance performance, reduce risk, and streamline your application architecture.
Based on these insights, you can take specific actions, such as marking backends, exploring flow maps, and filtering sensitive data. For more information, see Managing third party APIs and Actions on the Third Party page.
Managing third party APIs
After understanding the data on the third party usage and sensitive information, you can take targeted actions to improve accuracy, secure data flows, and troubleshoot issues.
Drilling down
The Third Party page provides the option to drill down and investigate specific interactions or third party services in detail. To do this, you can click the Drill Down icon corresponding to an API Endpoint or Third Party in the Third Party List View. Traceable redirects you to the Analytics page, Spans tab, where you can view the related spans and metrics. This enables you to deep dive into performance data and troubleshoot issues effectively.
Mark backends
A backend may have been misidentified as a third-party backend. You can mark such a misidentified third-party backend as a normal backend. Click the Ellipse (![]() )icon corresponding to a row and click Mark As Backend to move that third party to the Backend page. Similarly, you can mark a backend as a third-party domain from Discovery → Inventory → Backend.
)icon corresponding to a row and click Mark As Backend to move that third party to the Backend page. Similarly, you can mark a backend as a third-party domain from Discovery → Inventory → Backend.
Flow map
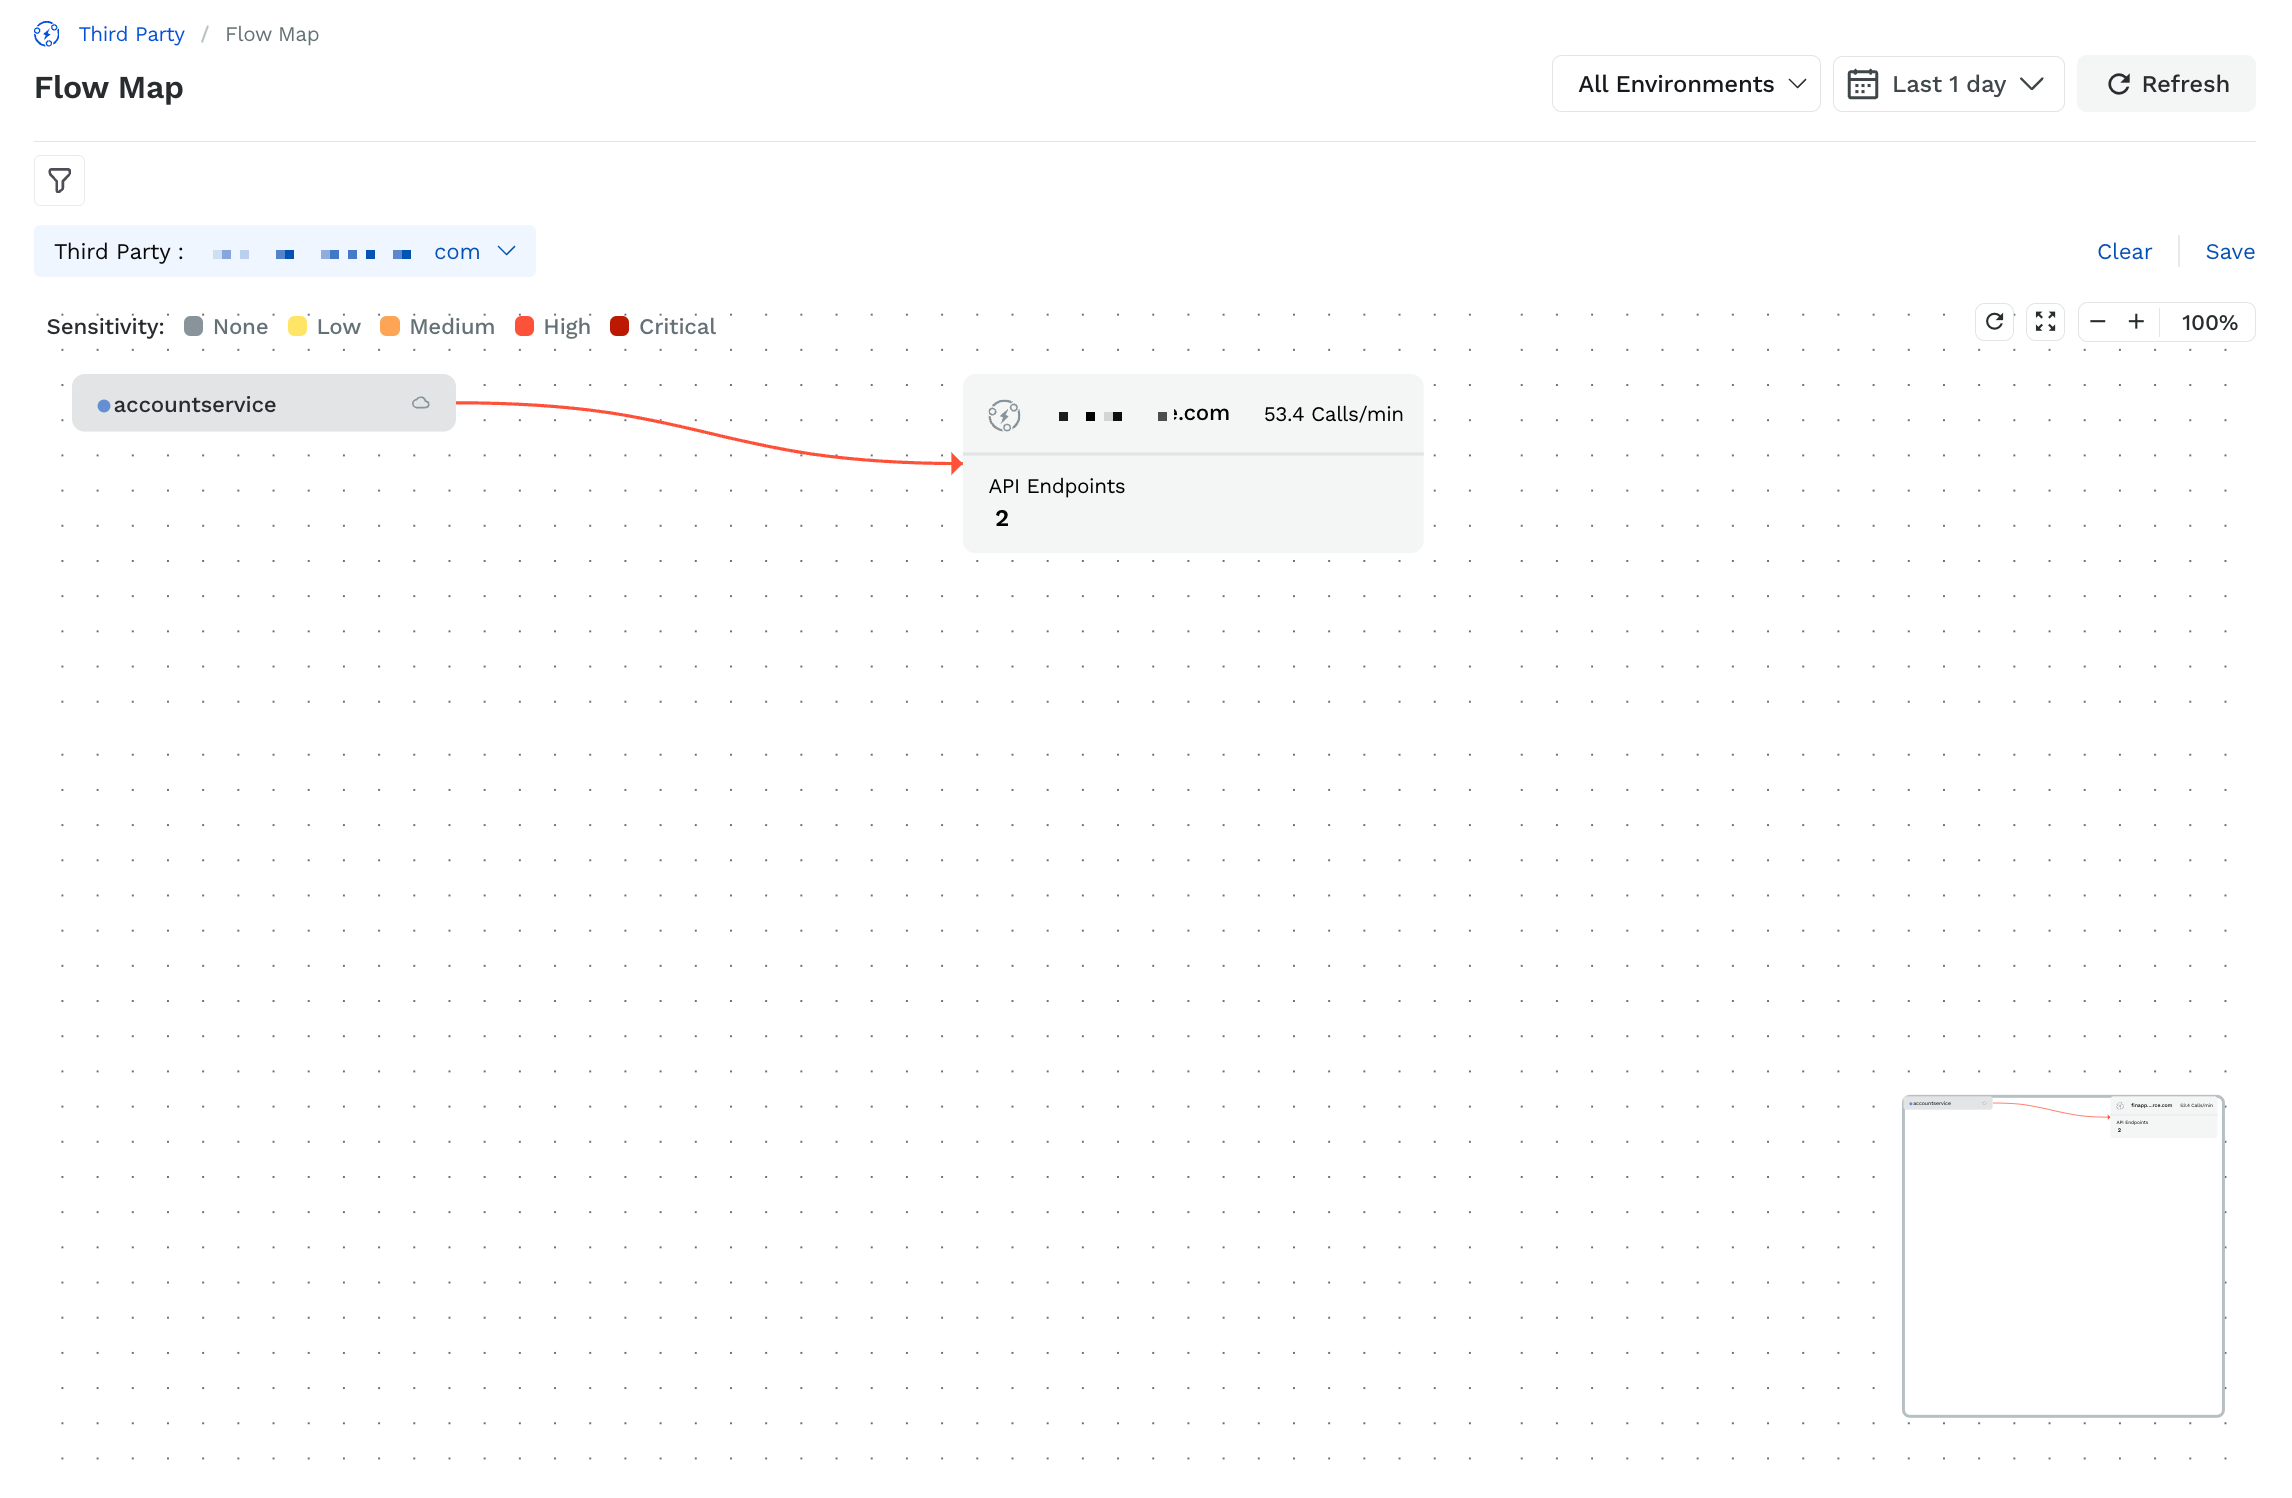
The Third Party page provides a flow map representing traffic flow to the third-party service. The flow map displays the level of sensitive data that flows to the third-party and the caller services that connect to it. To access the flow map, in the Third Party list view, click the Flow Map (![]() ) icon corresponding to the Third Party column. For more information on this flow map, see Application Flow.
) icon corresponding to the Third Party column. For more information on this flow map, see Application Flow.

Flow map
In the flow map, you can also click the API Endpoints to view the APIs in the service that are calling the third-party endpoints. For example, the following screenshot shows two APIs calling the third-party APIs.
.png)
Third-party APIs
Sensitive data in third-party
You can view the sensitive data flowing through the third-party services by navigating to Discovery → Sensitive Data, and clicking the Third Party tab.
.png)
Sensitive Data in Third Party
In this tab, you can:
Filter data based on various attributes, such as third-party service, datatypes, and datasets.
Identify critical, high, or medium-risk data exposures.
Understand how sensitive information, such as credit card numbers or authentication tokens, is being shared with third party services.
For more information, see Sensitive Data.
Actions on the Third Party page
In addition to managing APIs, the Third Party page provides various actions to refine, explore, and personalize the data visible in the page.
Filter Data
Filtering helps you refine data by selecting attributes such as caller services and datatypes, allowing you to focus on areas of concern or interest. You can click the Filter (![]() ) icon to apply these filters and display the relevant information for analysis.
) icon to apply these filters and display the relevant information for analysis.
Traceable also provides the following AI filters that you can use to identify the AI assets on the Third Party page:
Is AI Asset — Filters third parties based on whether or not they are AI-related.
AI Model Types — Filters third party assets on the type of AI model, for example, Google-gemini-pro and gpt-3.5-turbo.
AI Vendors — Filters third party assets based on the vendor providing the AI capability, for example, OpenAI and Google.
Group By
Grouping the data helps you identify patterns within third party interactions, allowing you to analyze relationships and trends. While Traceable does not group the data on the page by default, you can click the Group by drop-down at the top of the page and select Third Party.
Hide or View Visualizations
The visualizations provide key insights into your API interactions and sensitive data flow, helping you visualize risks. While Traceable displays the visualizations by default, you can click the Visualizations (![]() ) icon to hide them.
) icon to hide them.
Download Data
The download option allows you to save the third party data for offline analysis and reporting. You can click the Download (![]() ) icon at the top of the page to export the data in CSV format and analyze it according to your requirements.
) icon at the top of the page to export the data in CSV format and analyze it according to your requirements.