AI Firewall is Traceable’s out-of-the-box dashboard that provides insights into AI attacks, such as AI Input Explosion, Model Governance, and Prompt Injection, ensuring immediate functionality. The dashboard consists of details based on the AI Firewall policies you enabled under Protection → Settings → Policies → AI Firewall tab. You can use this information to monitor AI-related traffic and threat activity and take the necessary actions.
AI Firewall Dashboard
What will you learn in this topic?
By the end of this topic, you will understand:
The concept of AI Security dashboard in Traceable.
The widgets available on the AI Security dashboard.
The actions you can take on the AI Security dashboard.
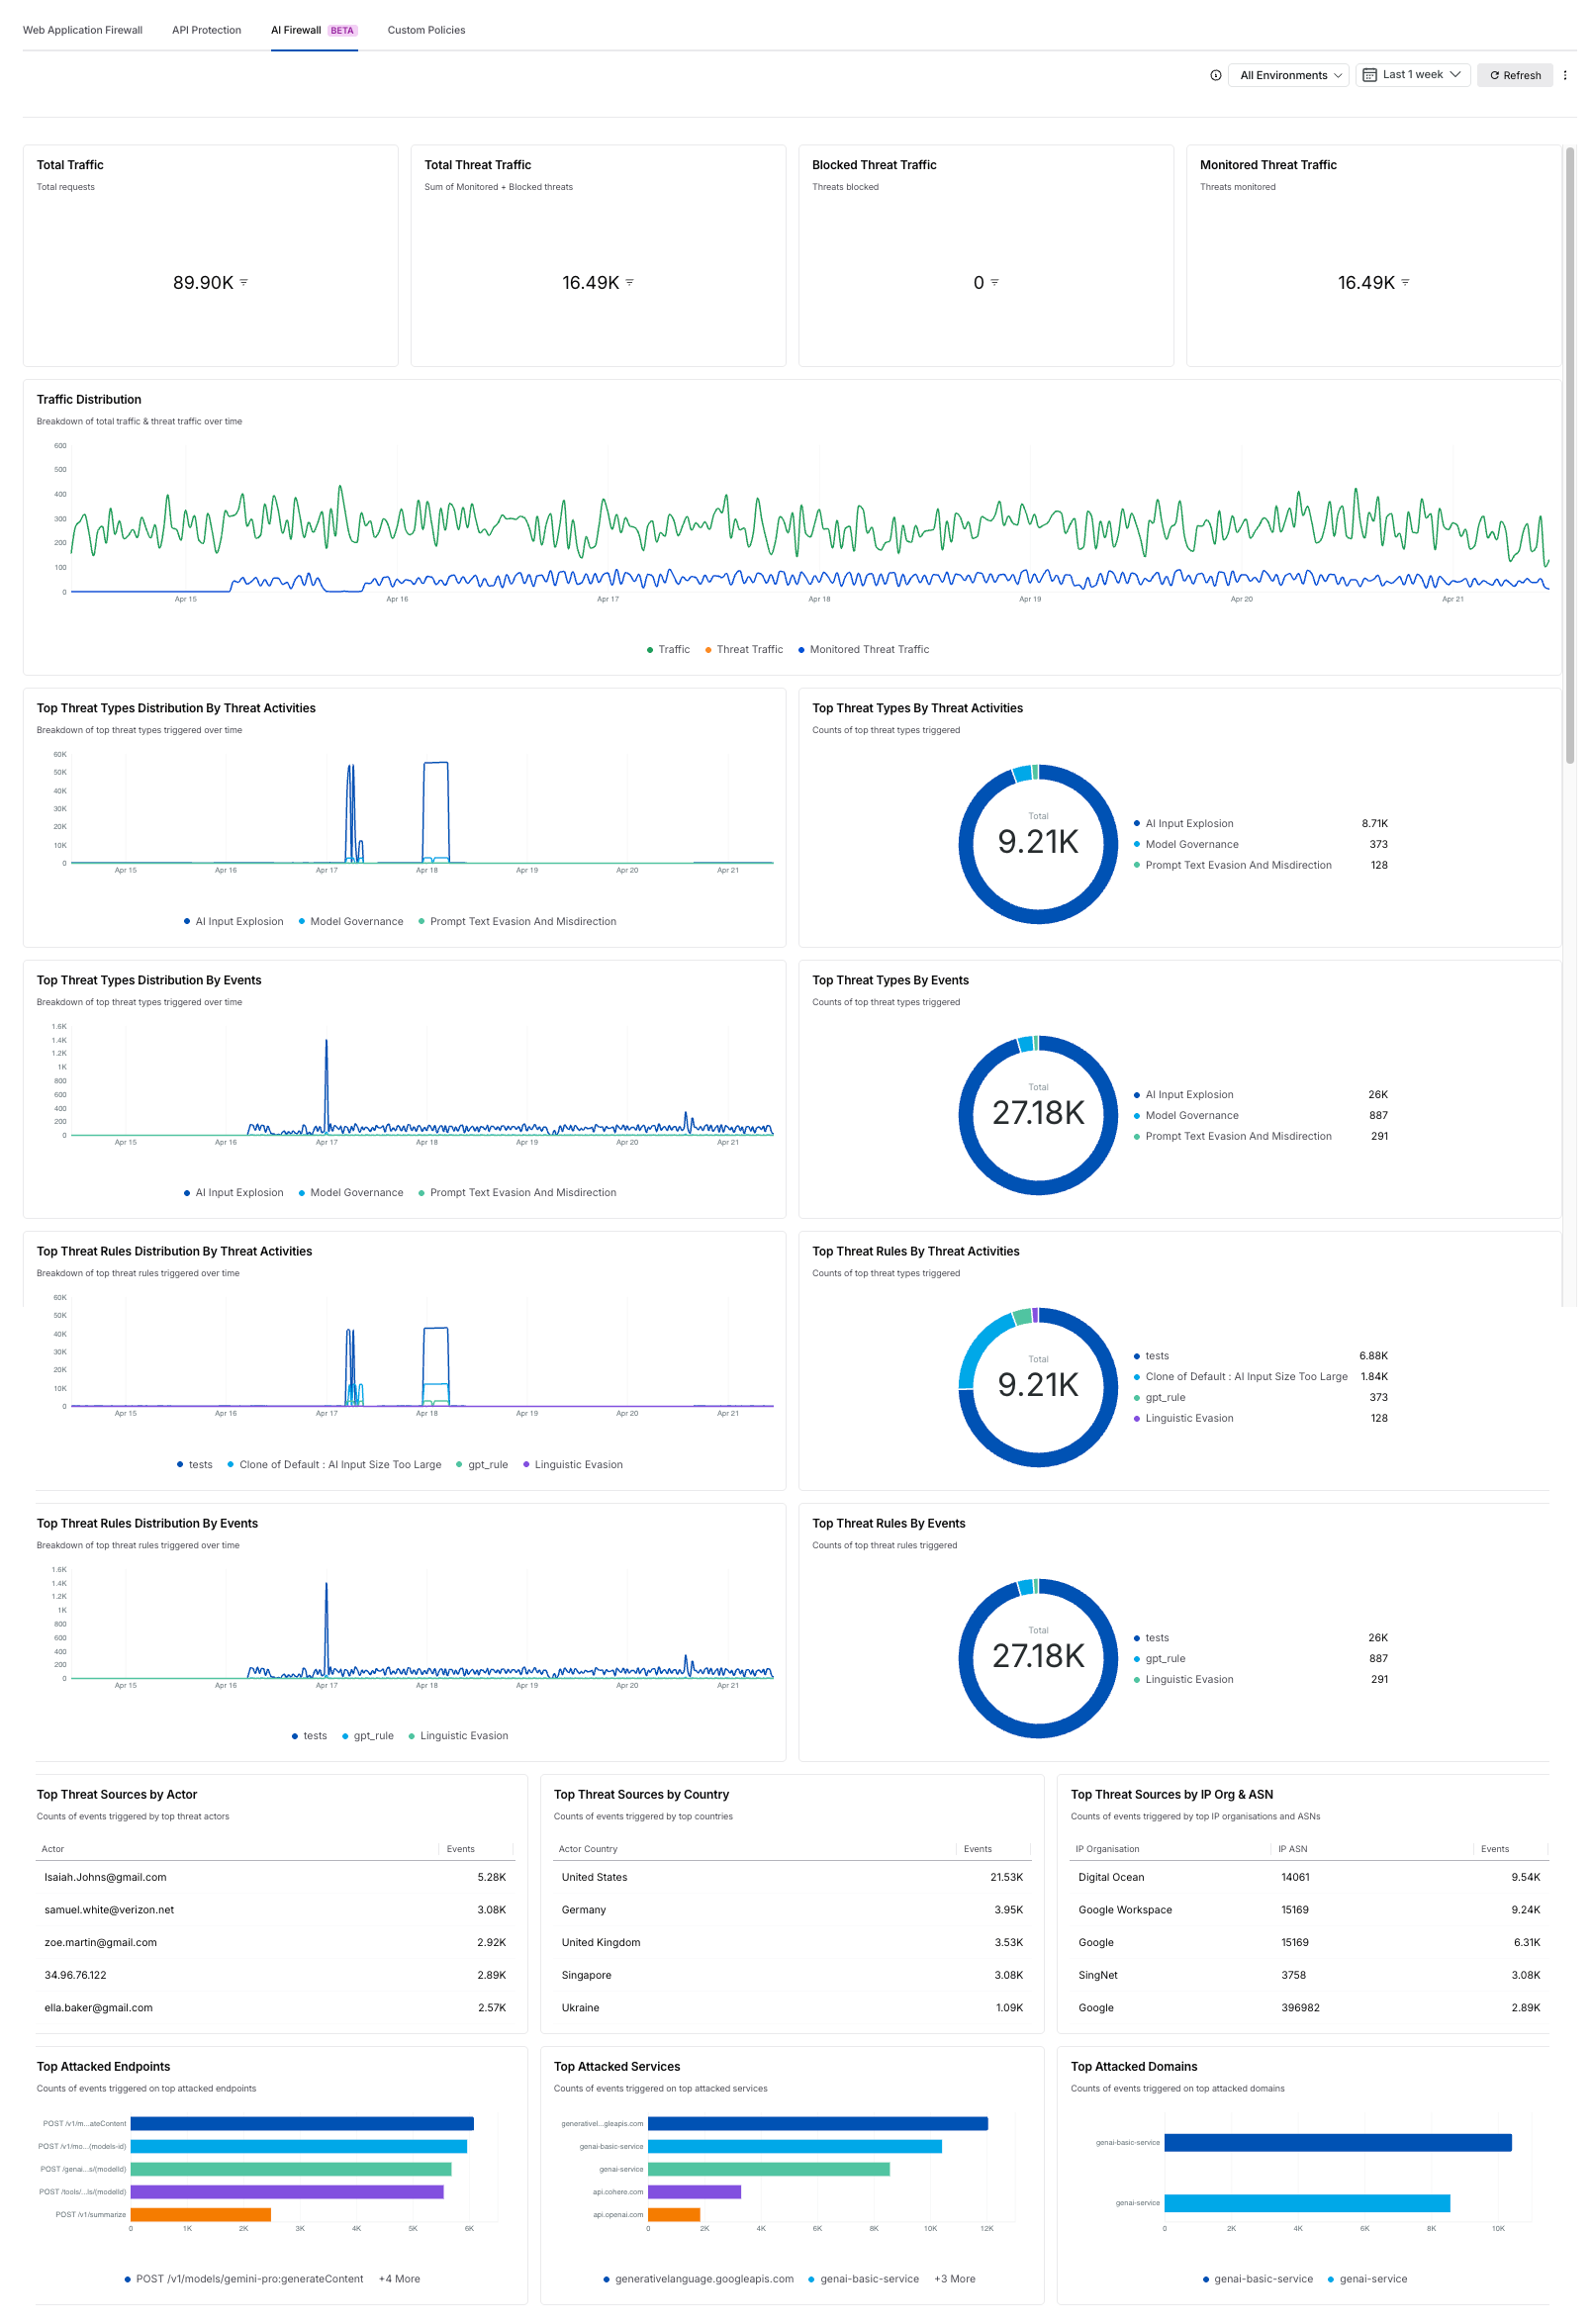
Widgets on the AI Firewall dashboard
By default, Traceable displays the following widgets in the AI Firewall dashboard:
Widget | Description |
|---|---|
Total Traffic | This displays a univariate widget with the total number of requests observed across AI applications and services. |
Total Threat Traffic | This displays a univariate widget with the total number of monitored and blocked threats detected across AI traffic. |
Blocked Threat Traffic | This displays a univariate widget with the total number of blocked threats. |
Monitored Threat Traffic | This displays a univariate widget with the total number of monitored threats. |
Traffic Distribution | This displays a time-series chart with the breakdown of total traffic and threat traffic over time. |
Top Threat Types Distribution by Threat Activities | This displays a time-series chart with the distribution of top threat types triggered over time based on threat activities. |
Top Threat Types by Threat Activities | This displays a donut chart with the counts of top threat types triggered by threat activities. |
Top Threat Types Distribution by Events | This displays a time-series chart with the distribution of top threat types triggered over time based on events. |
Top Threat Types by Events | This displays a donut chart with the counts of top threat types triggered by events. |
Top Threat Rules Distribution by Threat Activities | This displays a time-series chart with the distribution of top threat rules triggered over time based on threat activities. |
Top Threat Rules by Threat Activities | This displays a donut chart with the counts of top threat rules triggered by threat activities. |
Top Threat Rules Distribution by Events | This displays a time-series chart with the distribution of top threat rules triggered over time based on events. |
Top Threat Rules by Events | This displays a donut chart with the counts of top threat rules triggered by events. |
Top Threat Sources by Actor | This displays a table widget with the top actors generating threat events and their corresponding event counts. |
Top Threat Sources by Country | This displays a table widget with the top countries generating threat events and their corresponding event counts. |
Top Threat Sources by IP Org & ASN | This displays a table widget with the top IP organizations and ASNs generating threat events. |
Top Attacked Endpoints | This displays a bar chart with the counts of events triggered on the top-attacked endpoints. |
Top Attacked Services | This displays a bar chart with the counts of events triggered on the top-attacked services. |
Top Attacked Domains | This displays a bar chart with the counts of events triggered on the top-attacked domains. |
Actions on the AI Firewall dashboard
While the above widgets are shown in the AI Firewall dashboard by default, you can carry out the following actions:
Actions | Description |
|---|---|
Clone dashboard | Duplicate the existing dashboard and modify its configurations according to your requirements. For more information, see Custom Dashboard. |
Schedule Report | Enable Traceable to send you a dashboard report at the frequency you select. |
Download PDF | Download the dashboard as a PDF for offline analysis. |