Traceable's Conformance Analysis helps you identify deviations in API specifications defined by developers compared to the specifications Traceable creates based on the traffic. Traceable provides two options for performing conformance analysis: One Time and Scheduled.
Conformance analysis classifies API endpoints into 4 categories:
Shadow Endpoints — These are the endpoints Traceable identifies based on the traffic analysis, but these endpoints were not part of the specification you uploaded. For example, if the uploaded API specification has two API Endpoints
GET /cartandGET /checkout, however, Traceable also identifiesGET /adminas an API endpoint, thenGET /adminis a shadow endpoint.Note
In Traceable,
GET /cartandPOST /cartare two different API endpoints.Orphan Endpoints — These are the endpoints that are part of the API specification uploaded by the user, however, Traceable has either not observed or is still learning these API endpoints. For example, if the API specification has two API endpoints
GET /cartandGET /checkout, however, Traceable does not observeGET /checkoutduring analysis, thenGET /checkoutis identified as an orphan endpoint.Matched Endpoints with issues — These are the endpoints in the API specification you uploaded and Traceable has also observed them. However, Traceable has observed some discrepancies, for example, type mismatch, missing parameters, and authentication issue. An example of type mismatch can be that you define a parameter as an integer whereas Traceable observes it as a string.
Matched Endpoints without issues — These are the endpoints in the API specification you uploaded. Traceable has also observed these endpoints but did not observe any discrepancies in parameters, for example, type mismatch, missing parameters, and shadow parameters.
One Time analysis
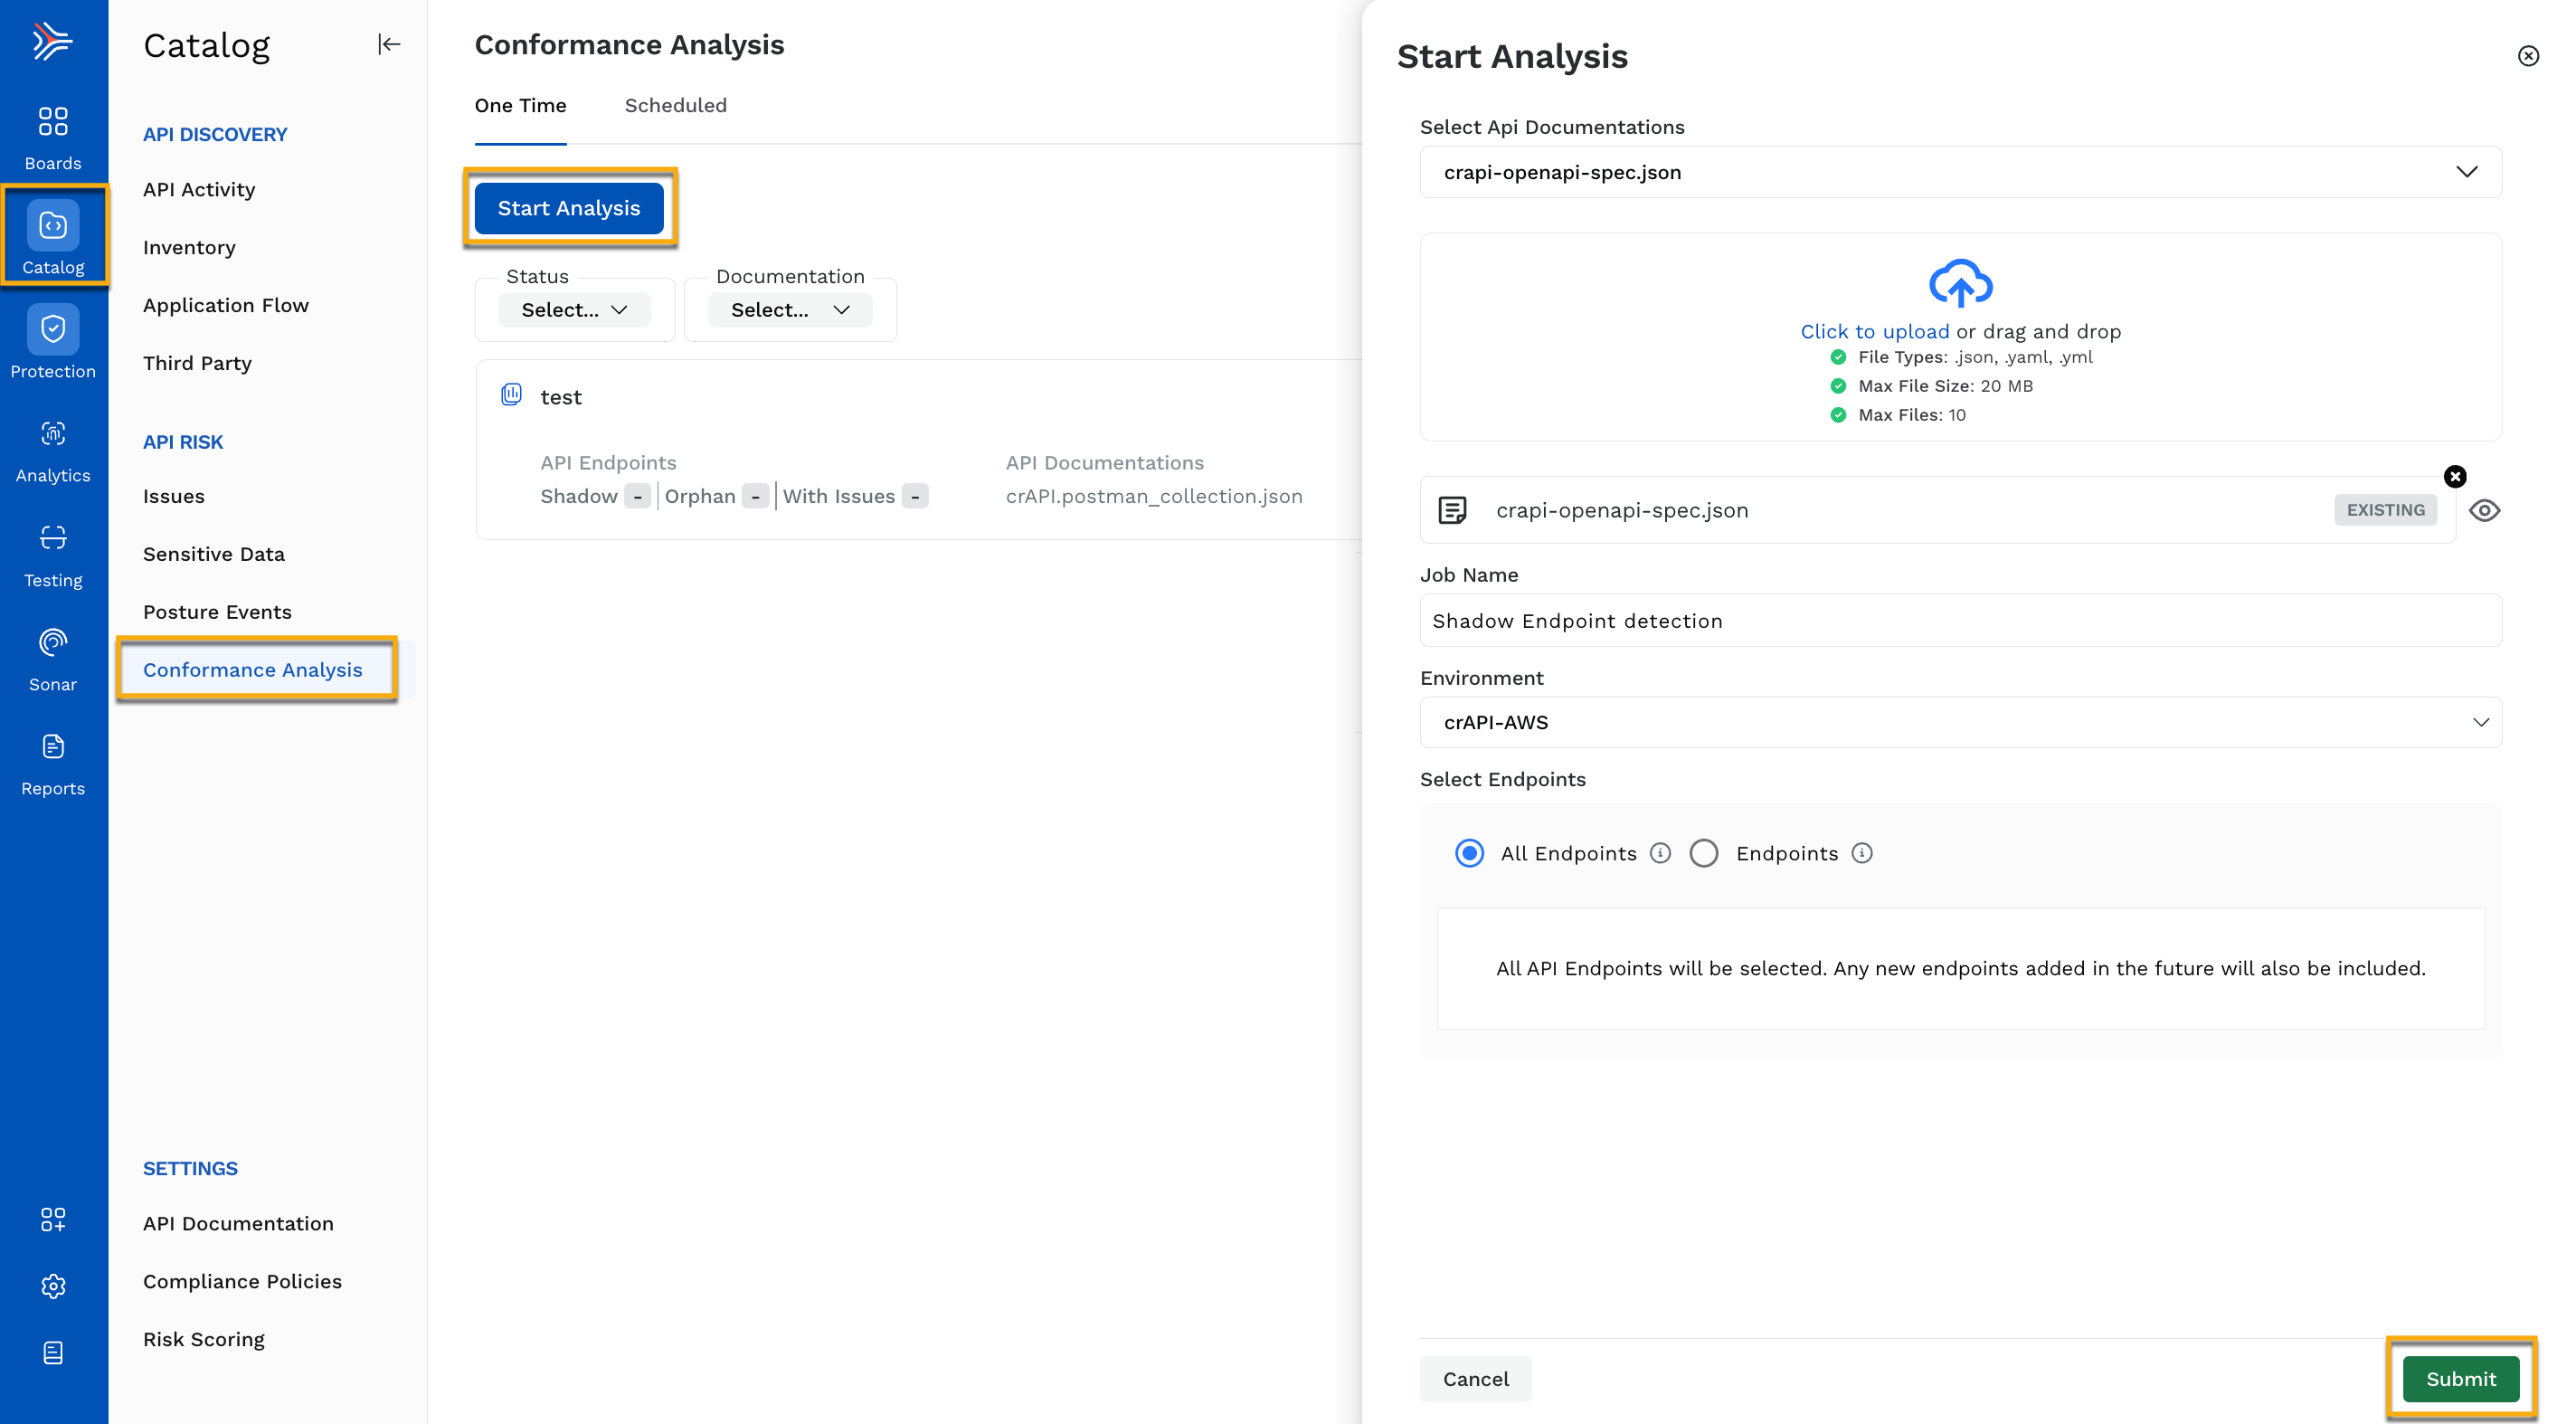
The one time conformance analysis is designed to execute a comprehensive evaluation once, according to the parameters you specify while starting the analysis. However, you can manually re-run the conformance analysis according to your requirements. To start a conformance analysis, navigate to API Catalog → Conformance Analysis and click on Start Analysis. A pop-up window is shown containing the following options:

One-Time Conformance Analysis
Select API Documentation — The Conformance Analysis is done against the specification you choose from this drop-down list. You can select one or all specifications available in the drop-down list. The list of API documentation is populated either from the click to upload section or from API Catalog → Settings → API Documentation.
Click to upload — The API specifications uploaded here are added to the Select API Documentation drop-down list. You can upload a maximum of 10 API specifications, with a total size not exceeding 20 MB.
Note
You can select a specification from the drop-down and upload a new API specification simultaneously. For example, if there are five API specifications available in the drop-down list, you can select all five or fewer, and also add a new specification using the Click to upload section.
Job name — Specify a name for the analysis job.
Environment — Select an environment from the drop-down list against which you want to run the conformance analysis.
Endpoints — Select the API endpoints against which you want to run the analysis. You can decide to run the analysis against all the endpoints or run it only against specific ones. The listed endpoints are specific to the environment you select above.
Click Submit to start the analysis.
Note
The analysis job result is stored for 10 days, after which they are automatically deleted.
Scheduled analysis
The scheduled analysis is designed to execute a comprehensive evaluation at specific intervals, ensuring regular and consistent analysis. Traceable provides two options for performing scheduled conformance analysis: Manual and System Generated.
Manual Analysis
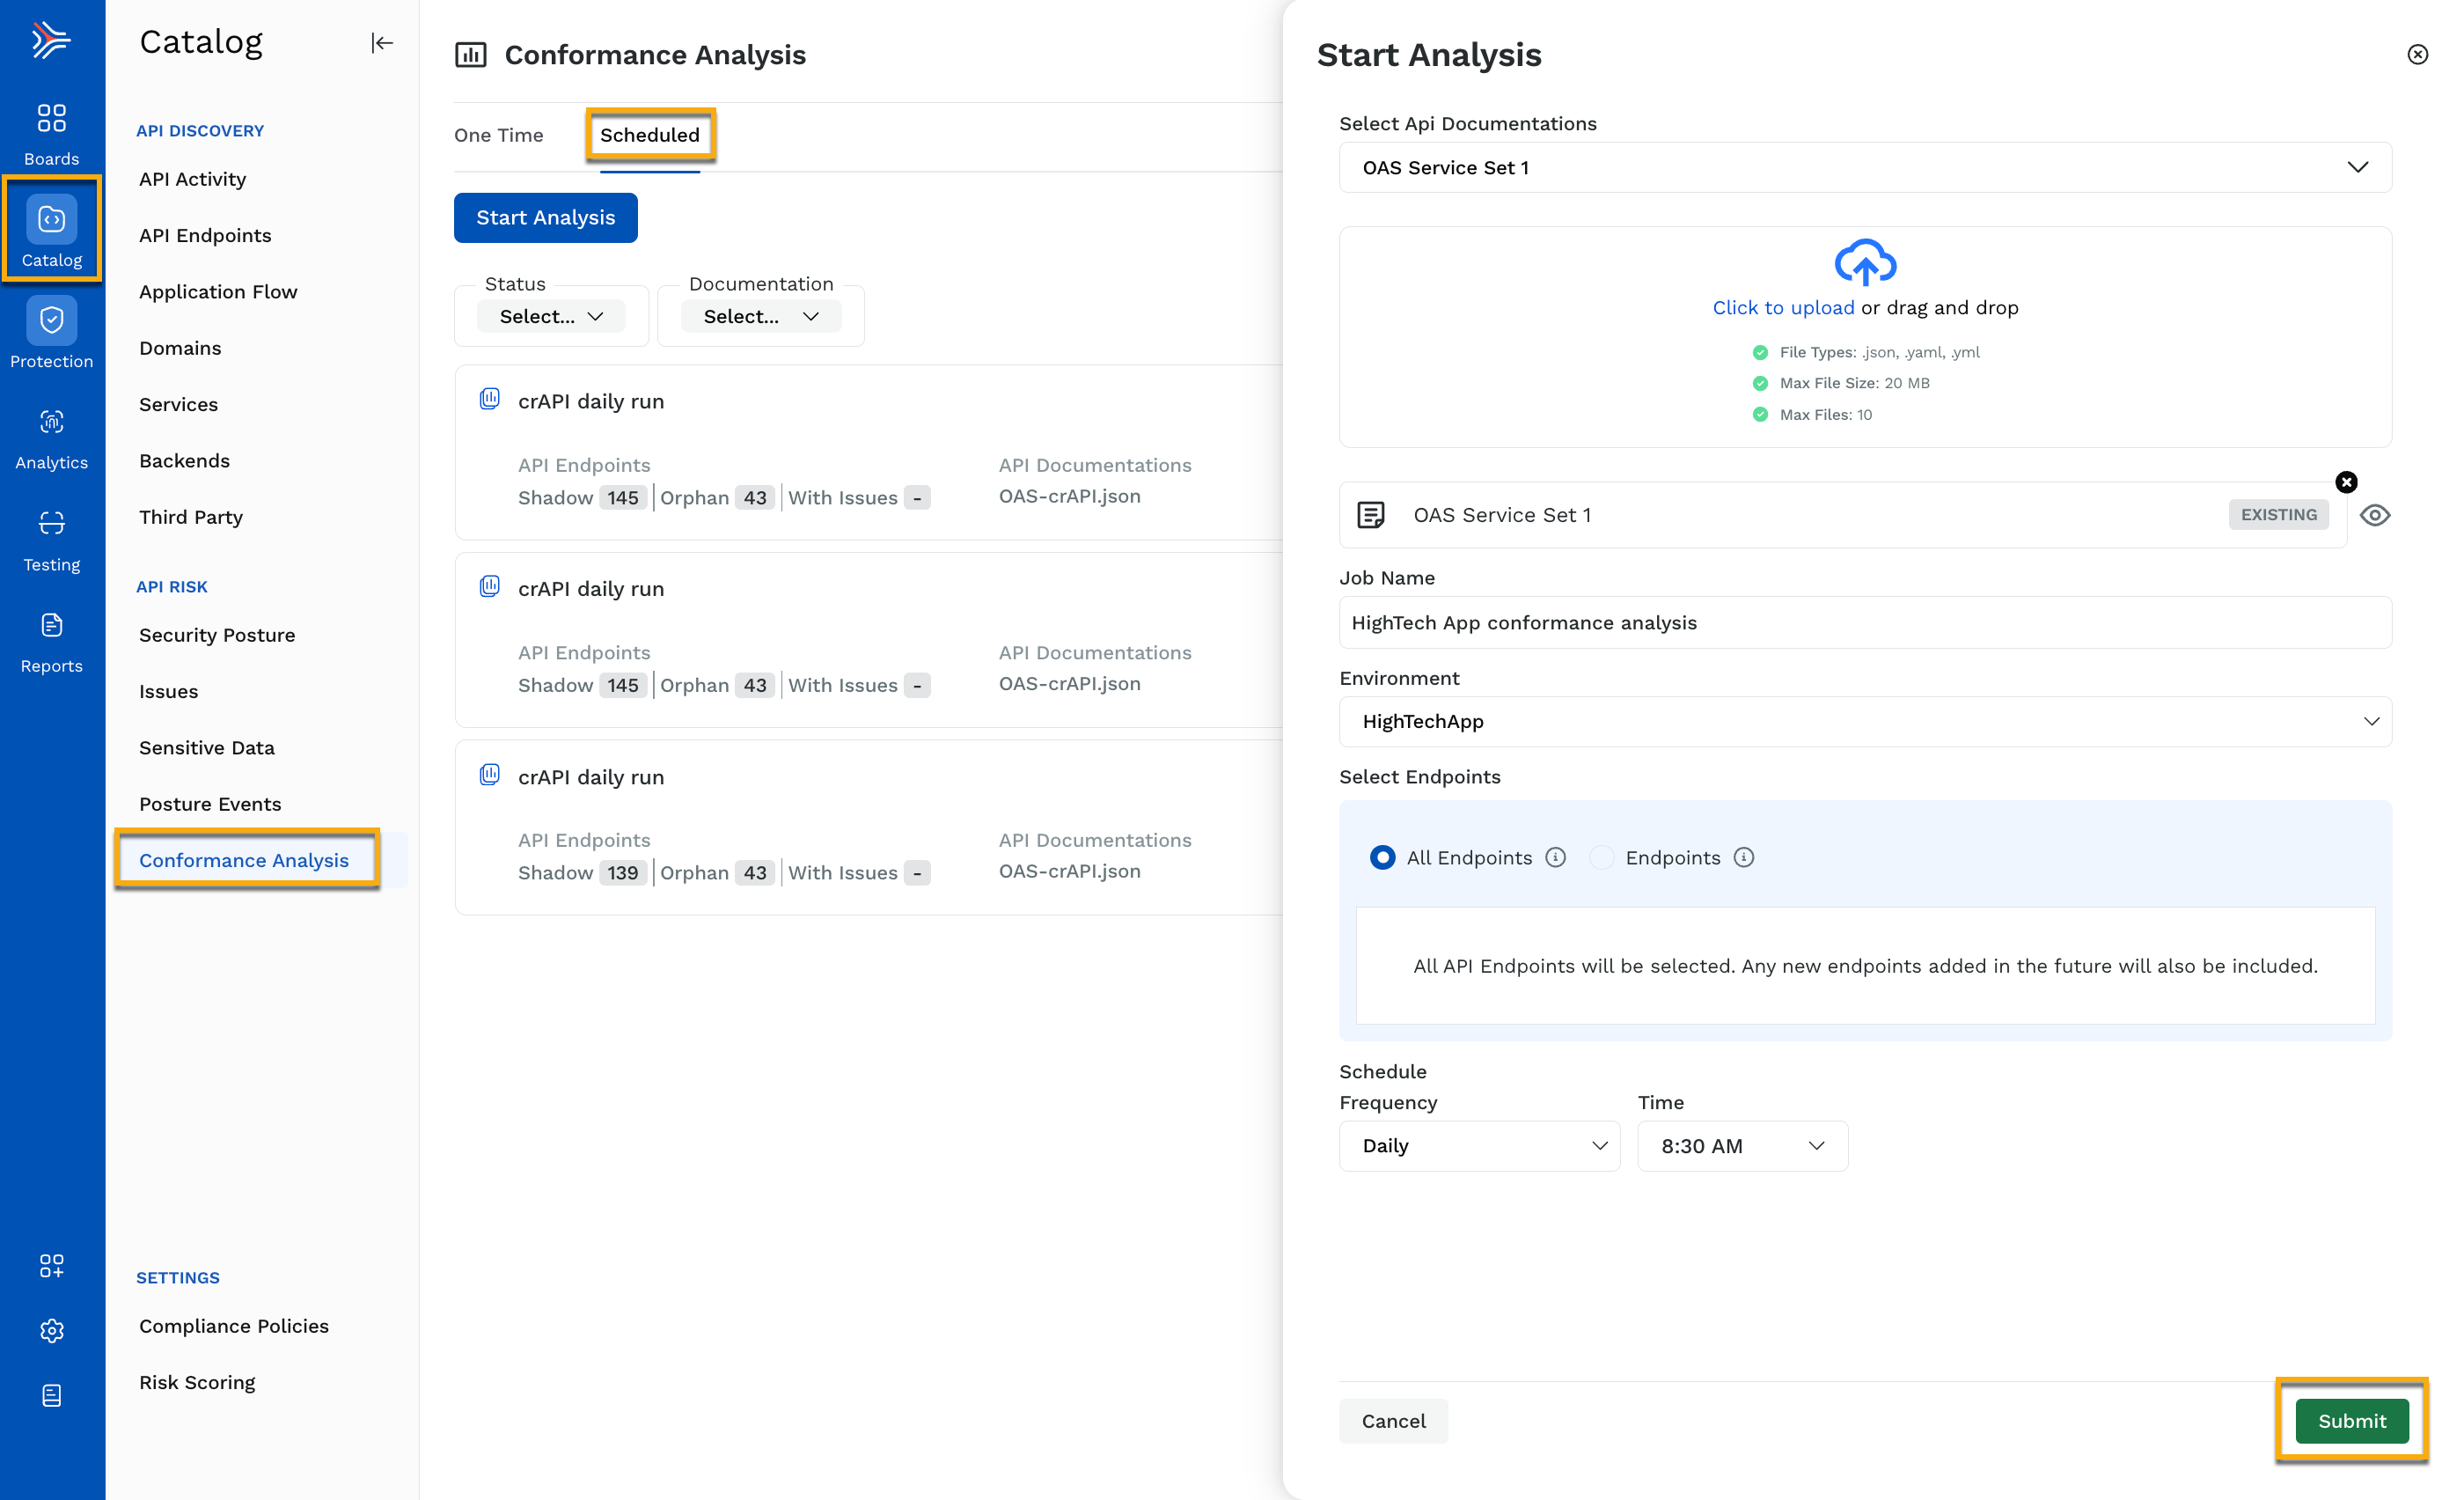
The configuration of a manual analysis is similar to that of a one time analysis, however, you can set the analysis to run at specific intervals according to your requirements. To do so, navigate to API Catalog → Conformance Analysis and click on Start Analysis. A pop-up window is shown containing the following options:

Manual Conformance Analysis
Select API Documentation — The conformance analysis is done against the specification you choose from this drop-down list. You can select one or all specifications available in the drop-down list. The list of API documentation is populated either from the click to upload section or from API Catalog → Settings → API Documentation.
Click to upload — The API specifications uploaded here are added to the Select API Documentation drop-down list. You can upload a maximum of 10 API specifications, with a total size not exceeding 20 MB.
Note
You can select a specification from the drop-down and upload a new API specification simultaneously. For example, if there are five API specifications available in the drop-down list, you can select all five or fewer and also add a new specification using the Click to upload section.
Job name — Specify a name for the analysis job.
Environment — Select an environment from the drop-down list against which you want to run the conformance analysis.
Endpoints — Select the API endpoints against which you want to run the analysis. You can decide to run the analysis against all the endpoints or run it only against specific ones. The listed endpoints are specific to the environment you select above.
Schedule — Select the schedule according to which Traceable should run the analysis, for example, Daily 8:30 AM.
Click Submit to start the analysis.
System generated analysis
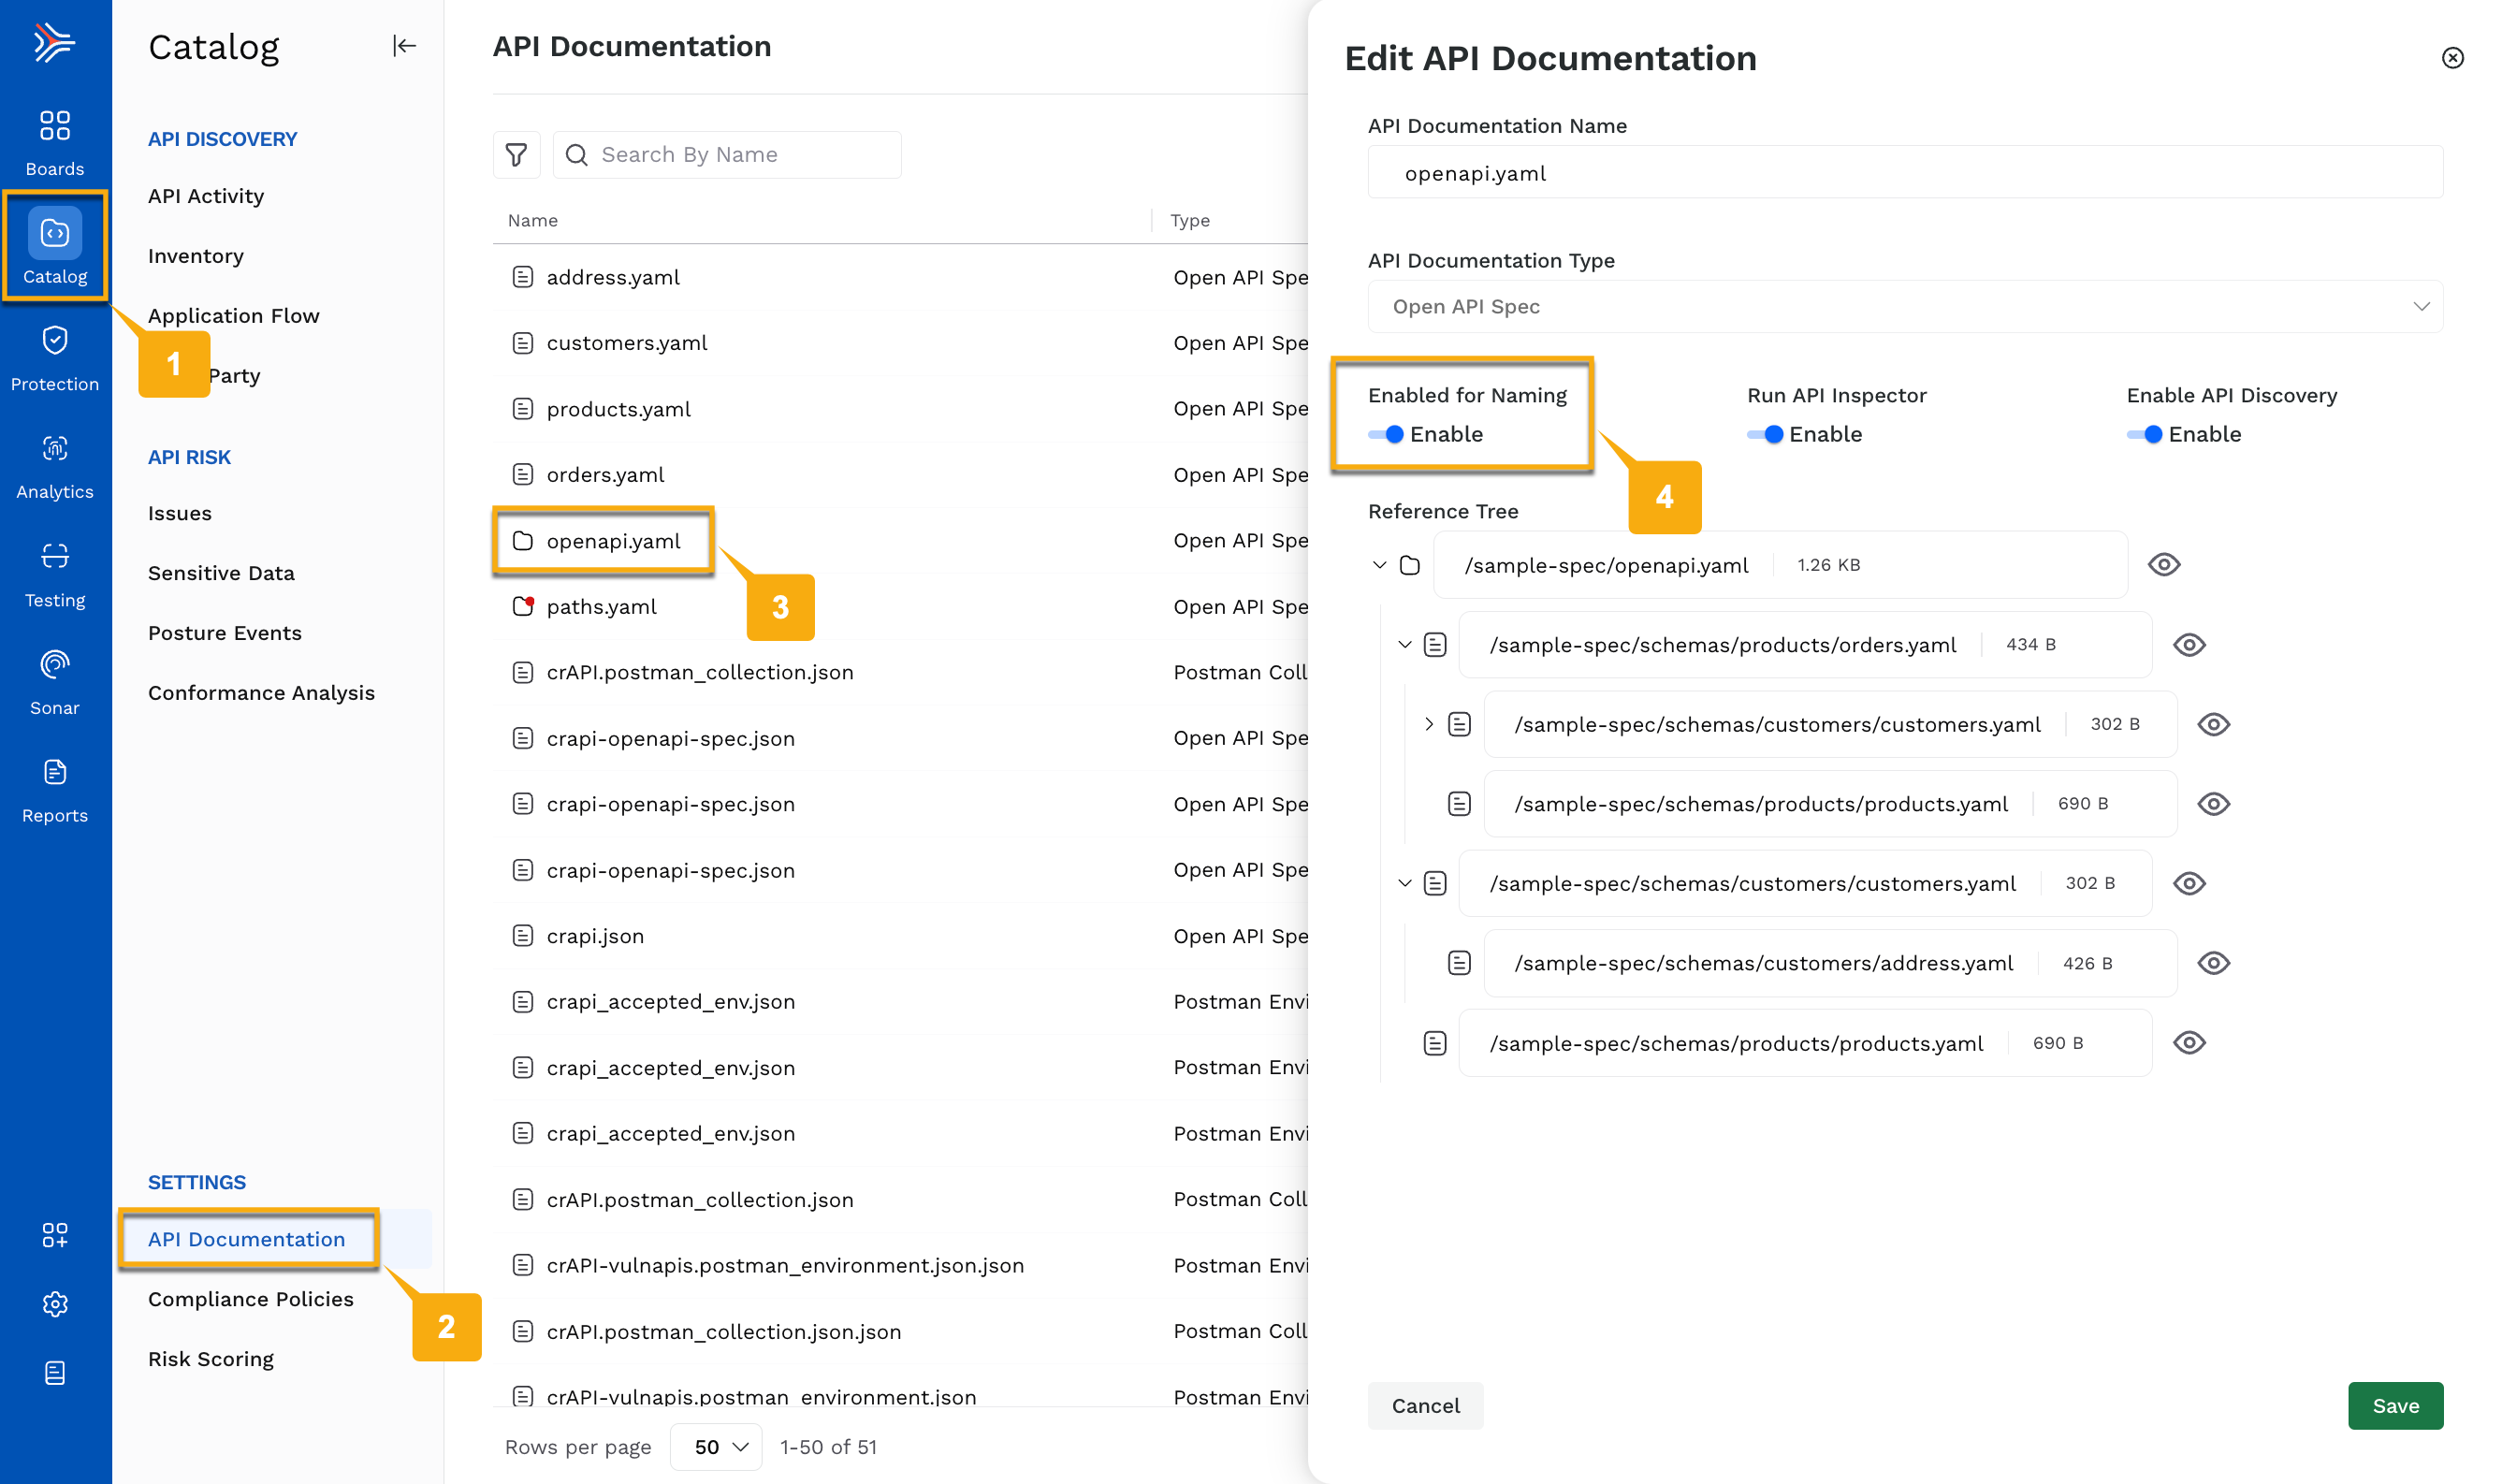
The system generated analysis is an automated analysis that runs independently every 12 hours from the last automated job run. The automated job runs for API documentation that is enabled for naming. For example, if 12 API documentations are available, out of which 8 are enabled for naming, then the automated conformance analysis job runs for 8 API documentations.
To enable API documentation for naming, navigate to API Catalog → Settings → API Documentation, edit an existing API specification and select the Enabled for Naming toggle, as shown below.

Enable Naming for System Generated Analysis
You can also use the API Documentation tab to upload a new specification or delete existing documentation. Any API specification uploaded from the API Documentation tab is visible in the Select API Documentation drop-down list as displayed in the One time and Manual analysis sections. In one-time and manual analysis, you can choose the environment in which you want to run the conformance analysis. In contrast, the system-generated conformance analysis job runs for all the environments.
The results of the system generated conformance analysis are available in the API Catalog → Conformance Analysis → Scheduled → System Generated tab. These results are available for 3 days. To view results for the analysis of specific environments, select the Environment from the drop-down list in the top right corner.
Analysis report
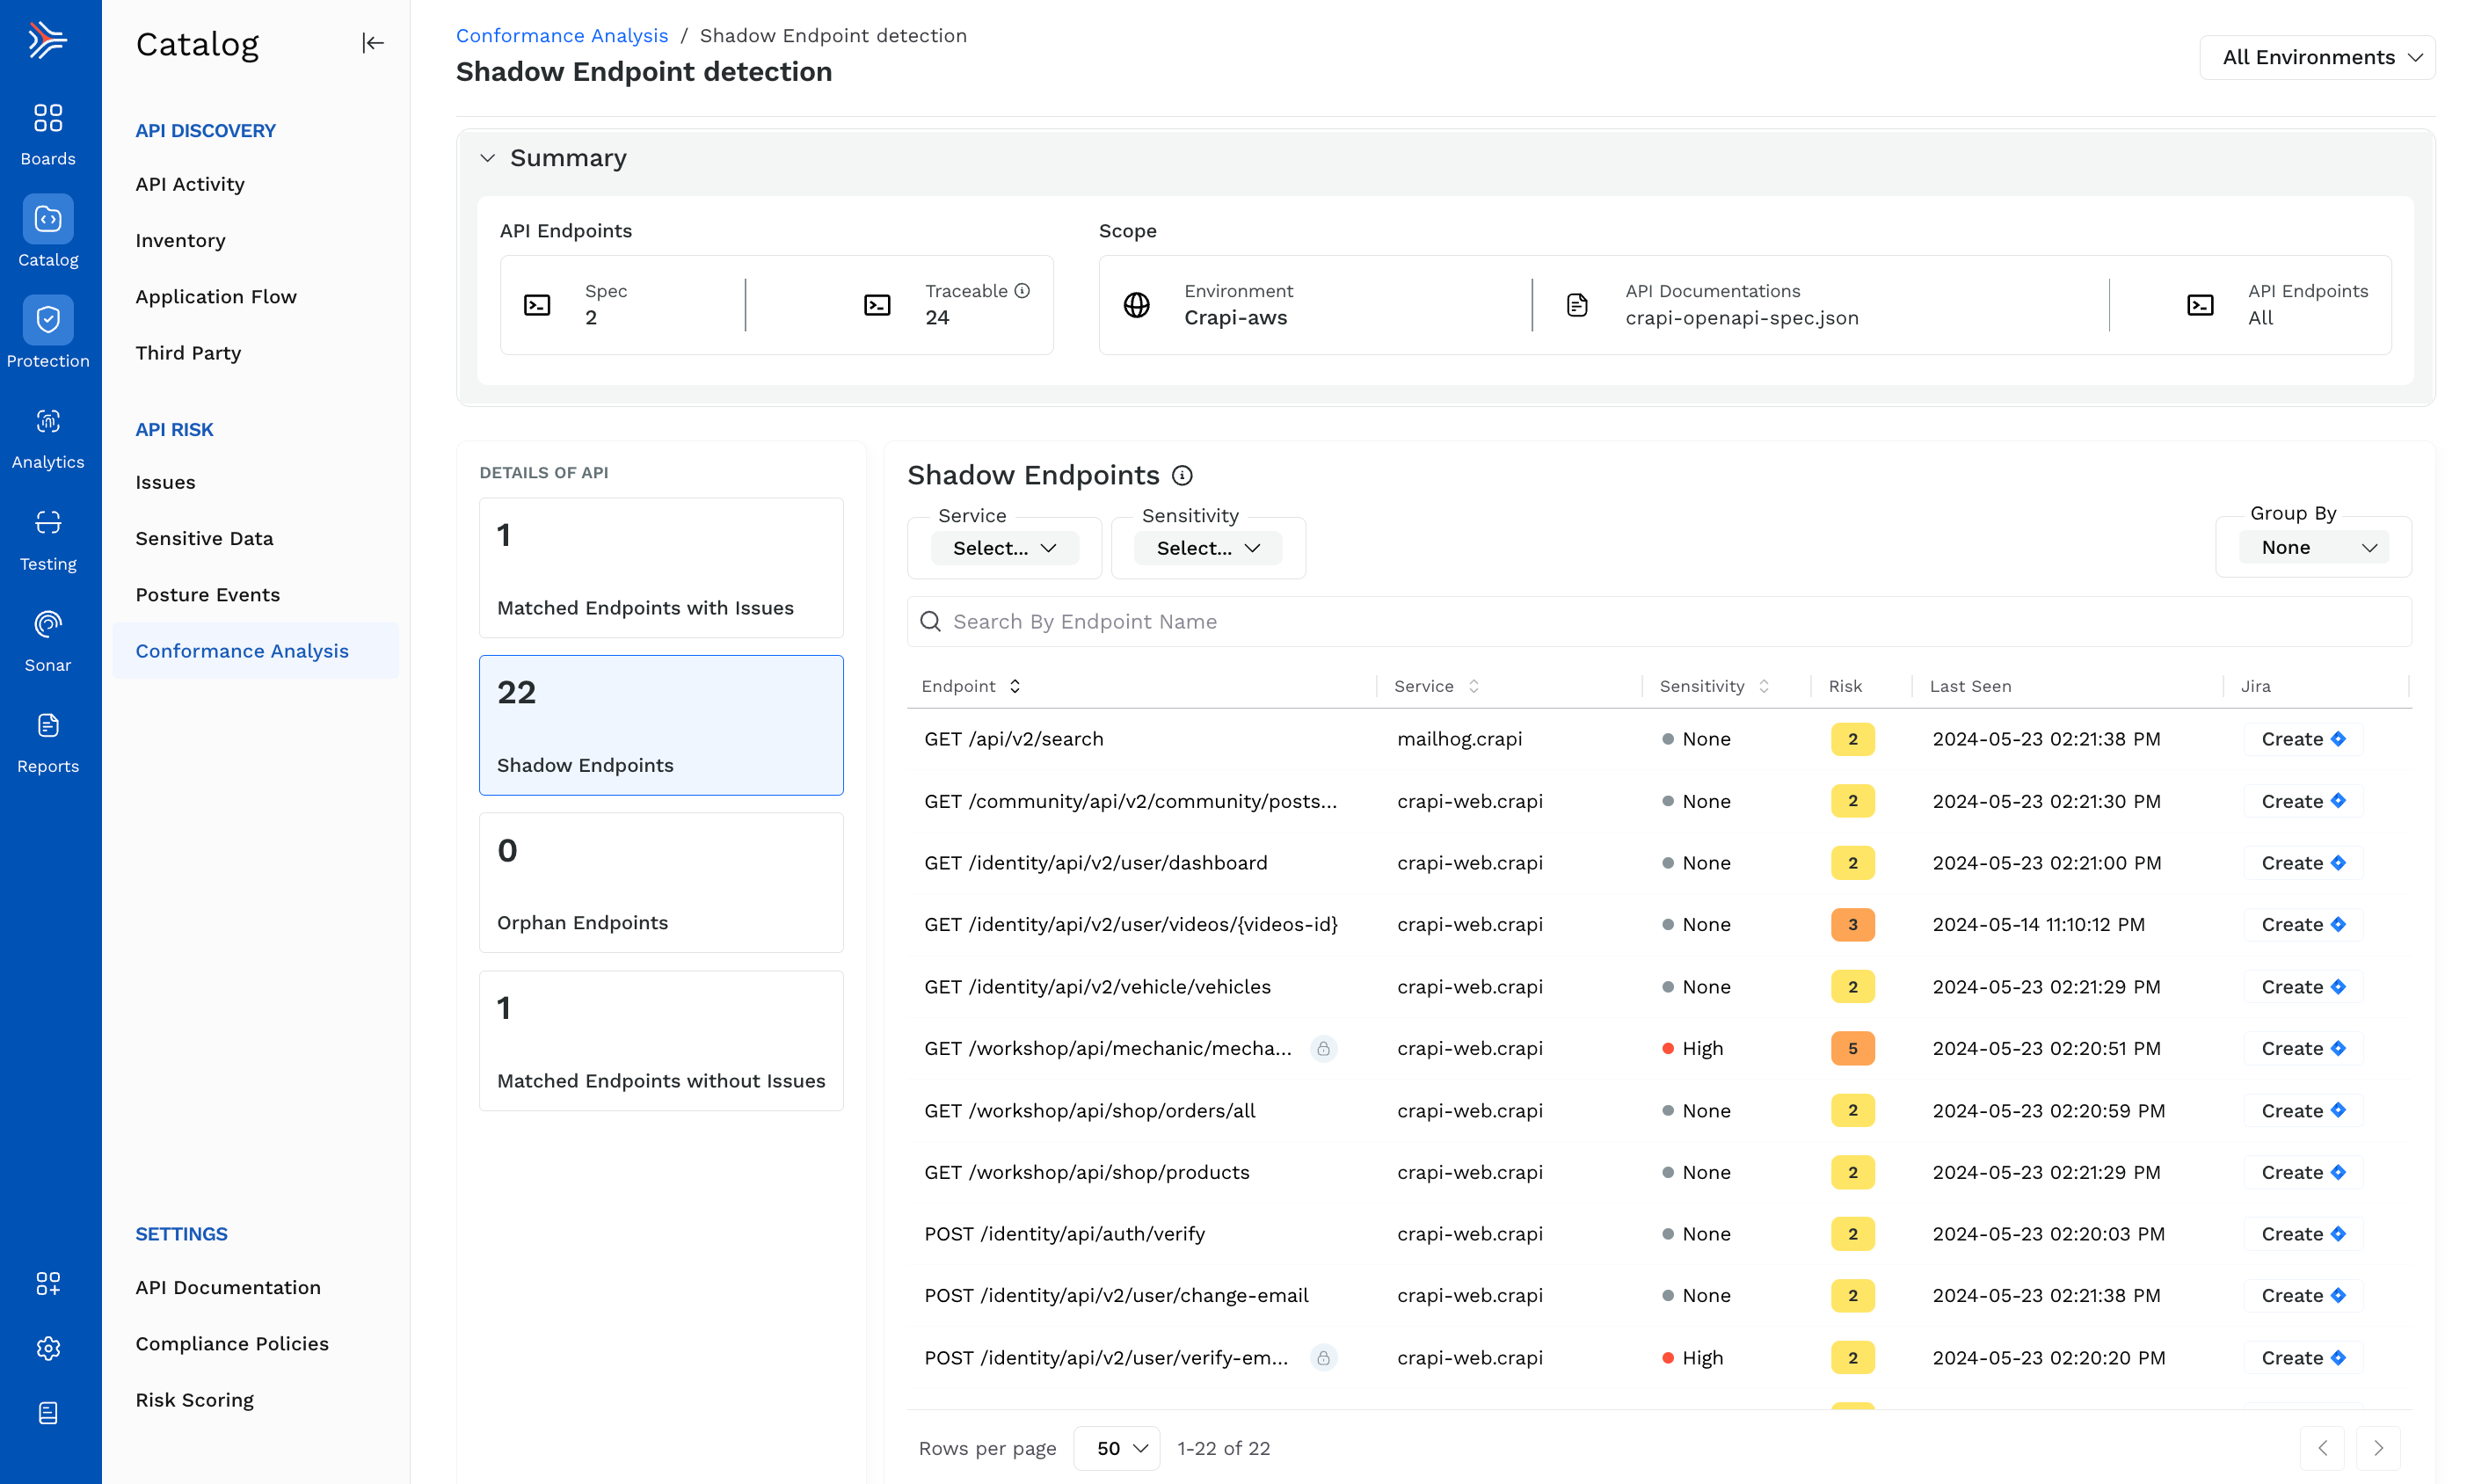
Once you start the conformance analysis, Traceable runs the job according to your configured settings. Once it is complete, you can click on the job to view the analysis results. The analysis report summary is shown at the top while the API details are shown on the left side of the page, as shown in the screenshot below.

Conformance Analysis Results
The details of the conformance report have the following sections:
API Endpoints
This section lists the API endpoints in the uploaded Spec section. The Traceable section has the number of API endpoints Traceable has observed. For example, in the above screenshot, the number of API endpoints in the Spec is 2, while the number of API endpoints Traceable observed is 24.
Scope
This section summarizes the parameters used in the conformance analysis. For example, in the above screenshot, the job was run against all API endpoints in the Crapi-aws environment with the crapi-openapi-spec as the API documentation.
Details of API
This section lists the number of:
Matched Endpoints with Issues
Shadow Endpoints
Orphan Endpoints
Matched Endpoints without Issues
When you click on either of the above, Traceable displays the analyzed APIs accordingly. For example, the above screenshot displays all the shadow API endpoints. You can click on any row in the right pane to view the details of that API. Similarly, you can view details about other types of APIs by clicking on the respective sections.
Create JIRA
From the analysis result page, you can create JIRA tickets for Shadow and Matched Endpoints with Issues by clicking Create which corresponds to a row. By default, the ticket lists the basic details about the issue.
.png)
Create JIRA
Note
The Link to job option (as in the above screenshot) is valid only for 10 days since the result generation time.