Updates (April 2026 to June 2026)
April 2026 — Updated the page to reflect the latest Traceable user interface.
A Third Party is a service provided by an external organization or individual that you use to add specific features or integrate into your application. The API Endpoints tab on the Third Party page under Discovery provides a detailed view of the APIs in your application that interact with your external services. This page helps you monitor third-party API usage, identify sensitive data exposure, and understand how internal services communicate with external providers.
Traceable automatically discovers third-party integrations from observed traffic and displays them, along with metadata, such as caller services, sensitive data types, request volume, and recent activity.
Note
Third Party API monitoring depends on your deployment method. For information on the supported deployment setups, see Third Party Monitoring Support Matrix.
To view the Third Party page, navigate to Discovery → Third Party → API Endpoints tab. In the page’s top right corner, use the Environment drop-down and select the environment for which you wish to view the data.
What will you learn in this topic?
By the end of this topic, you will be able to understand:
The concept of third-party services and their role in your application.
The data visible on the API Endpoints tab, such as endpoints, data types, datasets, and other metrics.
The way to leverage the information on the page.
The way to manage third-party APIs and integrations.
The actions that you can perform on the API Endpoints tab.
Understand the API Endpoints view
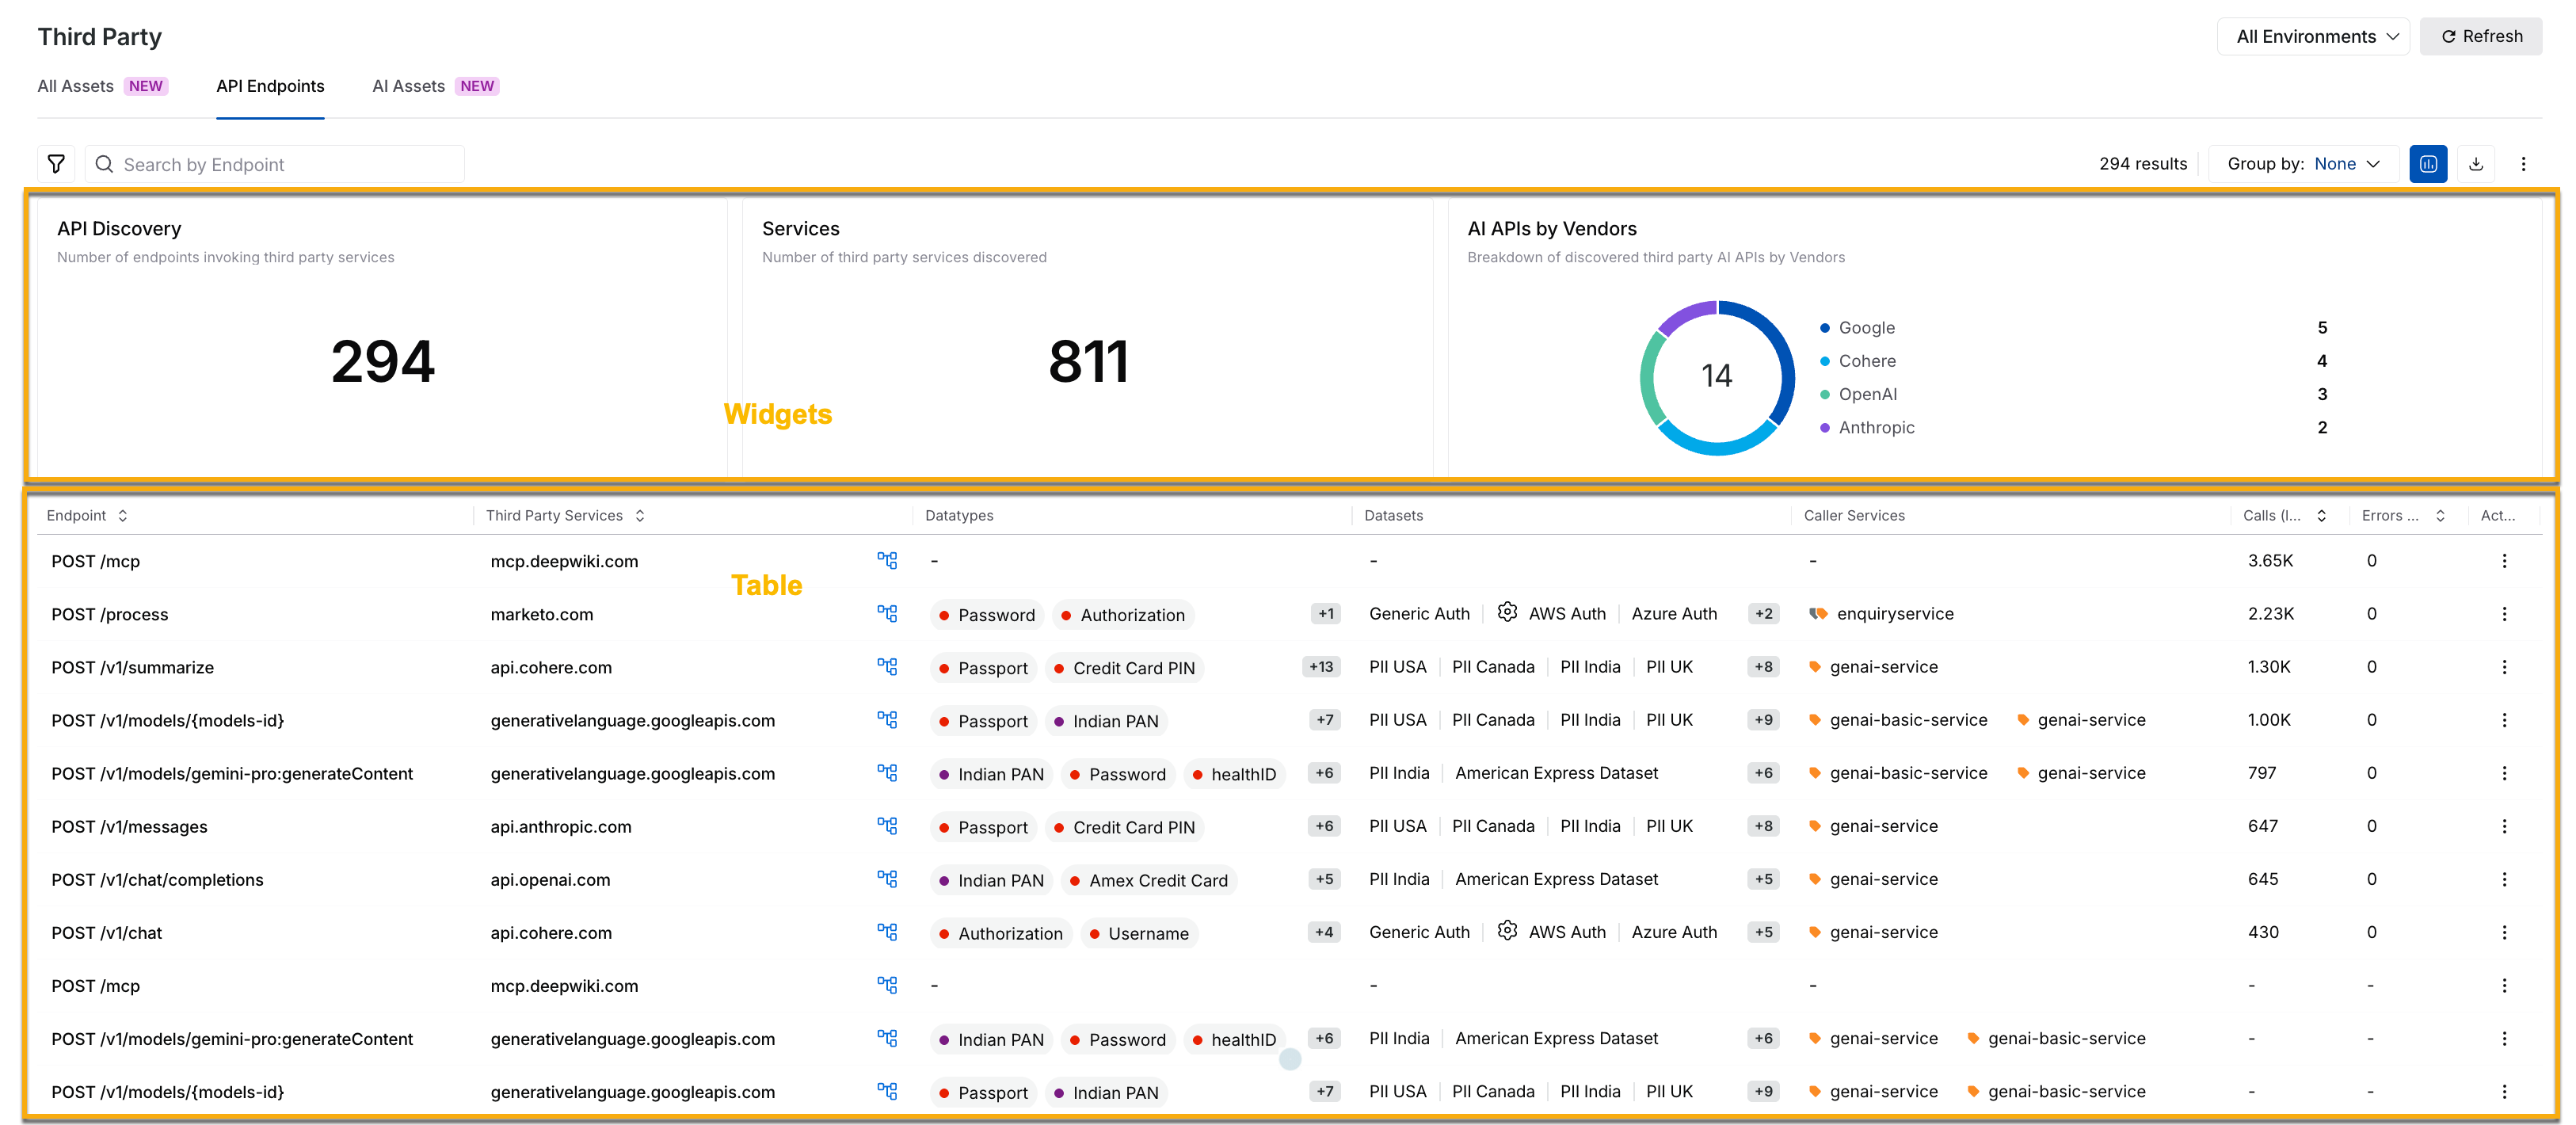
The API Endpoints tab helps you understand how your APIs interact with your third-party services. At the top of the page, Traceable displays multiple widgets that summarize third-party usage patterns and highlight sensitive data exposure across API interactions.
These widgets help you identify:
The APIs communicating with third-party services.
The Third-party integrations with sensitive data exposure.
The AI vendors discovered in your environment.
Third Party API Endpoints Tab
Widgets on the API Endpoints tab
Traceable displays the following widgets on the API Endpoints tab:
Widget | Description |
|---|---|
API Discovery | This widget displays the total number of API endpoints that are communicating with third-party services. You can use this widget to understand the scale of external API interactions across your environment. |
Services | This widget displays the number of third-party services that Traceable has discovered. You can use this information to understand the external services your application currently uses. |
AI APIs by vendors | This widget displays the AI vendors discovered in your environment, such as Google, OpenAI, Anthropic, and Cohere. You can use this information to understand your organization’s reliance on external AI providers. |
Table on the API Endpoints tab
While the widgets above provide visualizations to help you understand your third-party integrations, the API Endpoints tab also displays an inventory table with details on API interactions. The table highlights discovered third-party integrations, along with metadata, such as API endpoint, third-party service, sensitive data type, and dataset. You can click a specific endpoint to access detailed insights into its interaction behavior.
You can use this information to understand the following:
The APIs communicating with external providers.
The services transmitting sensitive data externally.
The active or inactive third-party integrations.
The scale of API-level external dependencies across your application.
Leverage the API Endpoints view
Once you understand the information displayed on the page, you can use it to investigate external interactions, validate sensitive data exposure, and optimize third-party integrations. You can do this in the following manner:
Monitor third-party API usage
You can monitor how frequently your APIs communicate with third-party services and identify spikes or unusual traffic patterns. This helps you:
Detect unexpected usage increase
Investigate abnormal traffic behavior
Identify potentially unused integrations
Identify sensitive data exposure
You can identify sensitive information propagated to external services, such as passwords, authentication tokens, and payment-related information. You can use this information to validate whether the exposure aligns with your organization’s security and compliance requirements.
Improve third-party classification
You can identify backends that may be incorrectly classified as third-party assets and correctly classify them. Maintaining accurate asset classification improves dependency visibility and ensures that monitoring and reporting remain reliable.
Investigate anomalies and troubleshoot issues
You can analyze traffic patterns and request failures to investigate unusual interactions between your services and third-party APIs. This helps you identify integration issues, investigate latency issues, and troubleshoot request-level problems.
Optimize integrations and dependencies
You can use the Data Flow map to understand how internal services interact with third-party endpoints. This helps you analyze dependencies, reduce unnecessary external integrations, and understand their impact before making any changes.
Manage third-party APIs
Once you have identified the third-party integrations and sensitive data exposure, you can take targeted actions to investigate interactions, improve classification, and run detailed analysis.
Drill down into interactions
The API Endpoints tab provides the option to investigate a specific API interaction in detail. To do this, you can:
Locate the API endpoint that you wish to drill down on.
Click the Drill-Down (
.png) ) icon corresponding to the row.
) icon corresponding to the row.
Traceable redirects you to the Explore Data page under Insights. This helps you:
Inspect request-level activity
Analyze request failures and latency
Investigate unusual traffic behavior
Troubleshoot integration issues
Mark misclassified backends
An internal backend API may sometimes be incorrectly identified as a third-party asset. To correct this classification, complete the following steps:
Locate the API endpoint for which you wish to correct the classification.
Click the Ellipse (
 ) icon corresponding to the endpoint.
Click Mark as Backend.
Traceable moves this asset to the Backend inventory. Similarly, you can classify a backend as a third-party asset from the Discovery → Inventory → Backends tab.
Analyze service dependencies using the Data Flow Map
The Flow Map provides a visual representation of traffic between internal services and third-party integrations. To access the flow map, complete the following steps:
Locate the API endpoint you wish to analyze for dependencies.
Click the Flow Map (
 ) icon corresponding to the asset.
This flow map helps you:
Identify services communicating with the third-party API endpoint.
Understand how many APIs are involved in the interaction.
View sensitive data flowing to external services.
Analyze dependencies across your application.
You can also select API endpoints within the flow map to continue investigating related interactions. For more information, see Application Flow.
Investigate sensitive data in third-party assets
You can further investigate sensitive data shared with external services from the Sensitive Data page. To access this page, navigate to Discovery → Sensitive Data → Third Party. From this page, you can:
Filter data by third-party services, data types, and datasets.
Identify critical, high-, or medium-risk data exposure.
Understand how sensitive data is being exported externally.
Actions on the API Endpoints tab
In addition to managing APIs, the API Endpoints tab provides multiple actions to refine, explore, and personalize the information displayed on the page.
Filter data
Filtering helps you narrow down the data displayed on the page and focus on the relevant information. You can use the Filter (![]() ) icon in the page’s top left corner to refine the data by attributes such as caller service, data type, and AI model type.
) icon in the page’s top left corner to refine the data by attributes such as caller service, data type, and AI model type.
Group data
Grouping helps you identify patterns across third-party assets and analyze their relationships. You can use the Group By drop-down in the page’s top right corner to group the data by third-party services.
Hide or view visualizations
Visualizations on the API Endpoints tab provide summarized insights into your API interactions and sensitive data exposure. While Traceable displays these visualizations by default, you can click the Visualizations (![]() ) icon in the page’s top right corner to hide them.
) icon in the page’s top right corner to hide them.
Download data
You can export the third-party inventory data in CSV format for offline analysis and reporting. To do this, you can click the Download (![]() ) icon in the page’s top right corner.
) icon in the page’s top right corner.