The All Assets tab on the Third Party page under Discovery provides a comprehensive view of all external services, APIs, and assets that interact with your application. This page consolidates third-party services, API endpoints, MCP components, and AI vendor integrations into a single inventory, enabling you to monitor usage, identify sensitive data exposure, and manage external dependencies effectively.
Traceable automatically discovers third-party integrations from observed traffic and displays them, along with metadata, such as caller services, sensitive data types, request volume, and recent activity.
Note
Third Party API monitoring depends on your deployment method. For information on the supported deployment setups, see Third Party Monitoring Support Matrix. Further, Third Party MCP monitoring also depends on the deployment method. For information on the supported deployment setups, see AI Security Agent Support Matrix.
To view the All Assets tab, navigate to Discovery → Third Party → All Assets tab. In the page’s top-right corner, use the Environments drop-down to select the environment for which you wish to view the data.
What will you learn in this topic?
By the end of this topic, you will understand:
The data displayed on the third-party page.
The way to navigate the widgets and the inventory table on the page.
The way to analyze the third-party integrations and sensitive data exposure.
The way to use the page to investigate external dependencies.
An example of how to leverage the information displayed on the page.
Understand the All Assets view
The All Assets view helps you understand how your application communicates with external services and vendors. At the top of the page, Traceable displays multiple widgets that summarize the distribution of third-party assets and highlight patterns of sensitive data exposure.
These widgets help you identify:
The types of third-party AI assets discovered
The assets with sensitive data exposure
The AI vendors available in your environment
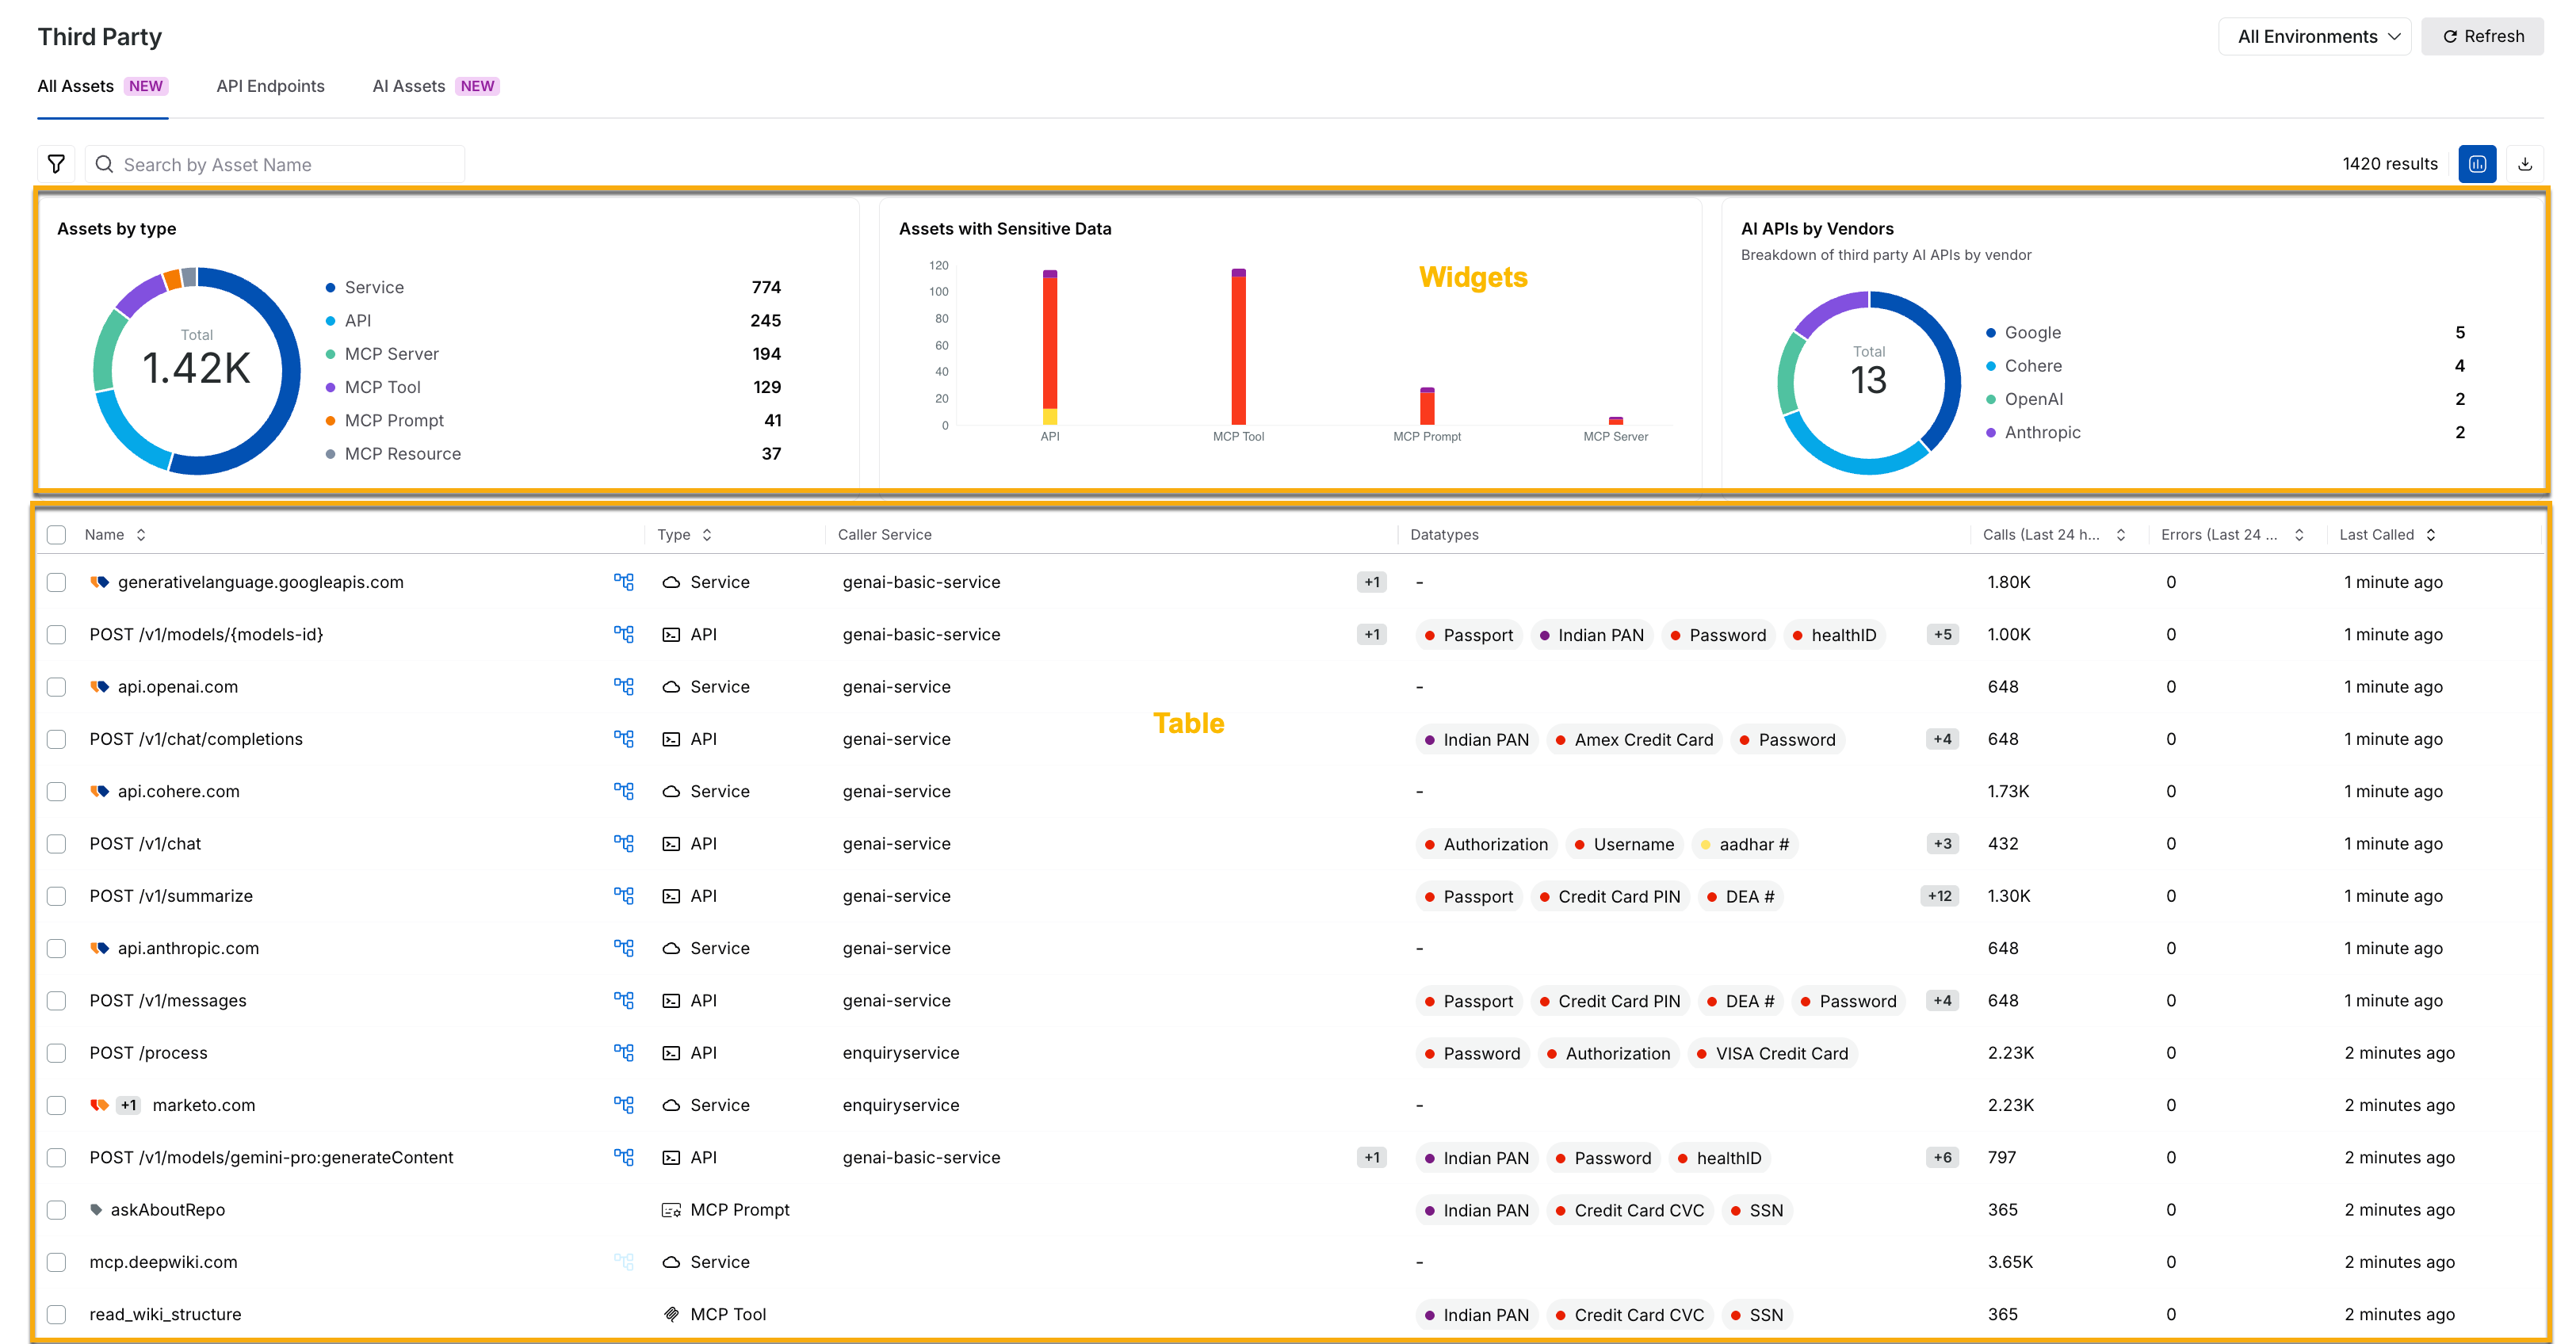
Third Party All Assets View
Widgets on the All Assets tab
Traceable displays the following widgets on the All Assets tab:
Widget | Description |
|---|---|
Assets by type | This widget displays a distribution of discovered third-party assets across categories, such as services, APIs, MCP servers, tools, prompts, and resources. You can use this widget to understand which types of external assets are most common in your environment. For example, a large number of MCP tools may indicate that the workflow depends on external systems. |
Assets with sensitive data | This widget displays the asset categories that are receiving sensitive data, such as passwords, authorization tokens, and payment-related information from your services. You can use this widget to understand the assets that require security improvements. |
AI APIs by vendors | This widget displays the third-party AI providers, such as Google, OpenAI, and Anthropic, that Traceable has discovered in your environment. You can use this information to understand your organization’s dependence on external AI vendors. |
Table on the All Assets tab
While the above widgets provide visualizations to help you understand your third-party security posture, the All Assets tab displays an inventory table. This table highlights discovered external assets and integrations, along with usage metadata, such as asset name, type, caller service, sensitive data type, and request volumes. You can click a specific asset to access detailed insights into its interaction behavior.
You can use this information to understand the following:
The services that are communicating with external providers.
The assets that are processing sensitive information.
The active or dormant assets.
The scale of external dependencies across your application.
Leverage the All Assets view
Once you understand the assets displayed on the page, you can use this information to investigate and validate risks and to optimize external service usage. You can do this in the following manner:
Filter strategically
You can use filters to narrow down the view and focus on the relevant third-party assets. For example, you can filter by:
Asset Type
Caller Service
Sensitive Data Type
AI Vendor
For example, you can filter by Datatypes, such as Credit Card CVC, to identify third-party assets that receive payment-related information.
You can do this by clicking the Filter (![]() ) icon in the page’s left top corner and selecting the attribute you wish to refine the data on.
) icon in the page’s left top corner and selecting the attribute you wish to refine the data on.
Take necessary actions
Once you have filtered the data displayed on the page, you can take the following actions:
Reduce risk — Identify assets that are propagating sensitive data and validate whether the exposure is expected.
Optimize dependencies — Detect inactive assets and reduce external dependencies.
Audit assets — Download the external asset data for offline analysis.
Investigate anomalies — Identify unusual request volumes or unexpected caller services interacting with external assets.