Updates (April 2026 to June 2026)
June 2026 —
Updated the page to add information about assigning labels to a scan. For more information, see Assign labels to a scan.
Updated the page to add information about details displayed on the Scans page. For more information, see Understand Scans view.
April 2026 —
Updated the page to add information about the details displayed for each scan run.
Updated the page to add information about re-running a scan. For more information, see Understand and leverage scan details, Scan Runs tab.
April 2026 — Updated the page to add information about the Reachability Tests tab. For more information, see Understand and leverage scan details, Reachability Tests tab.
After a scan execution is complete, the Scan Details page highlights key information about the scan. It provides comprehensive information on the identified issues, the APIs covered (tested), the list of scan runs performed, and the specific tests executed during each scan run.
What will you learn in this topic?
By the end of this topic, you will be able to understand:
The details displayed on the Scans page.
The details displayed for each scan.
The way you can leverage the details in each tab to analyze the test results and customize security testing.
The steps to assign labels to each scan.
Understand Scans view
The Scans page provides a centralized list of all the configured and executed scans in your environment. You can use this view to monitor scan execution status, review coverage, and identify scans that detected issues and require your attention.
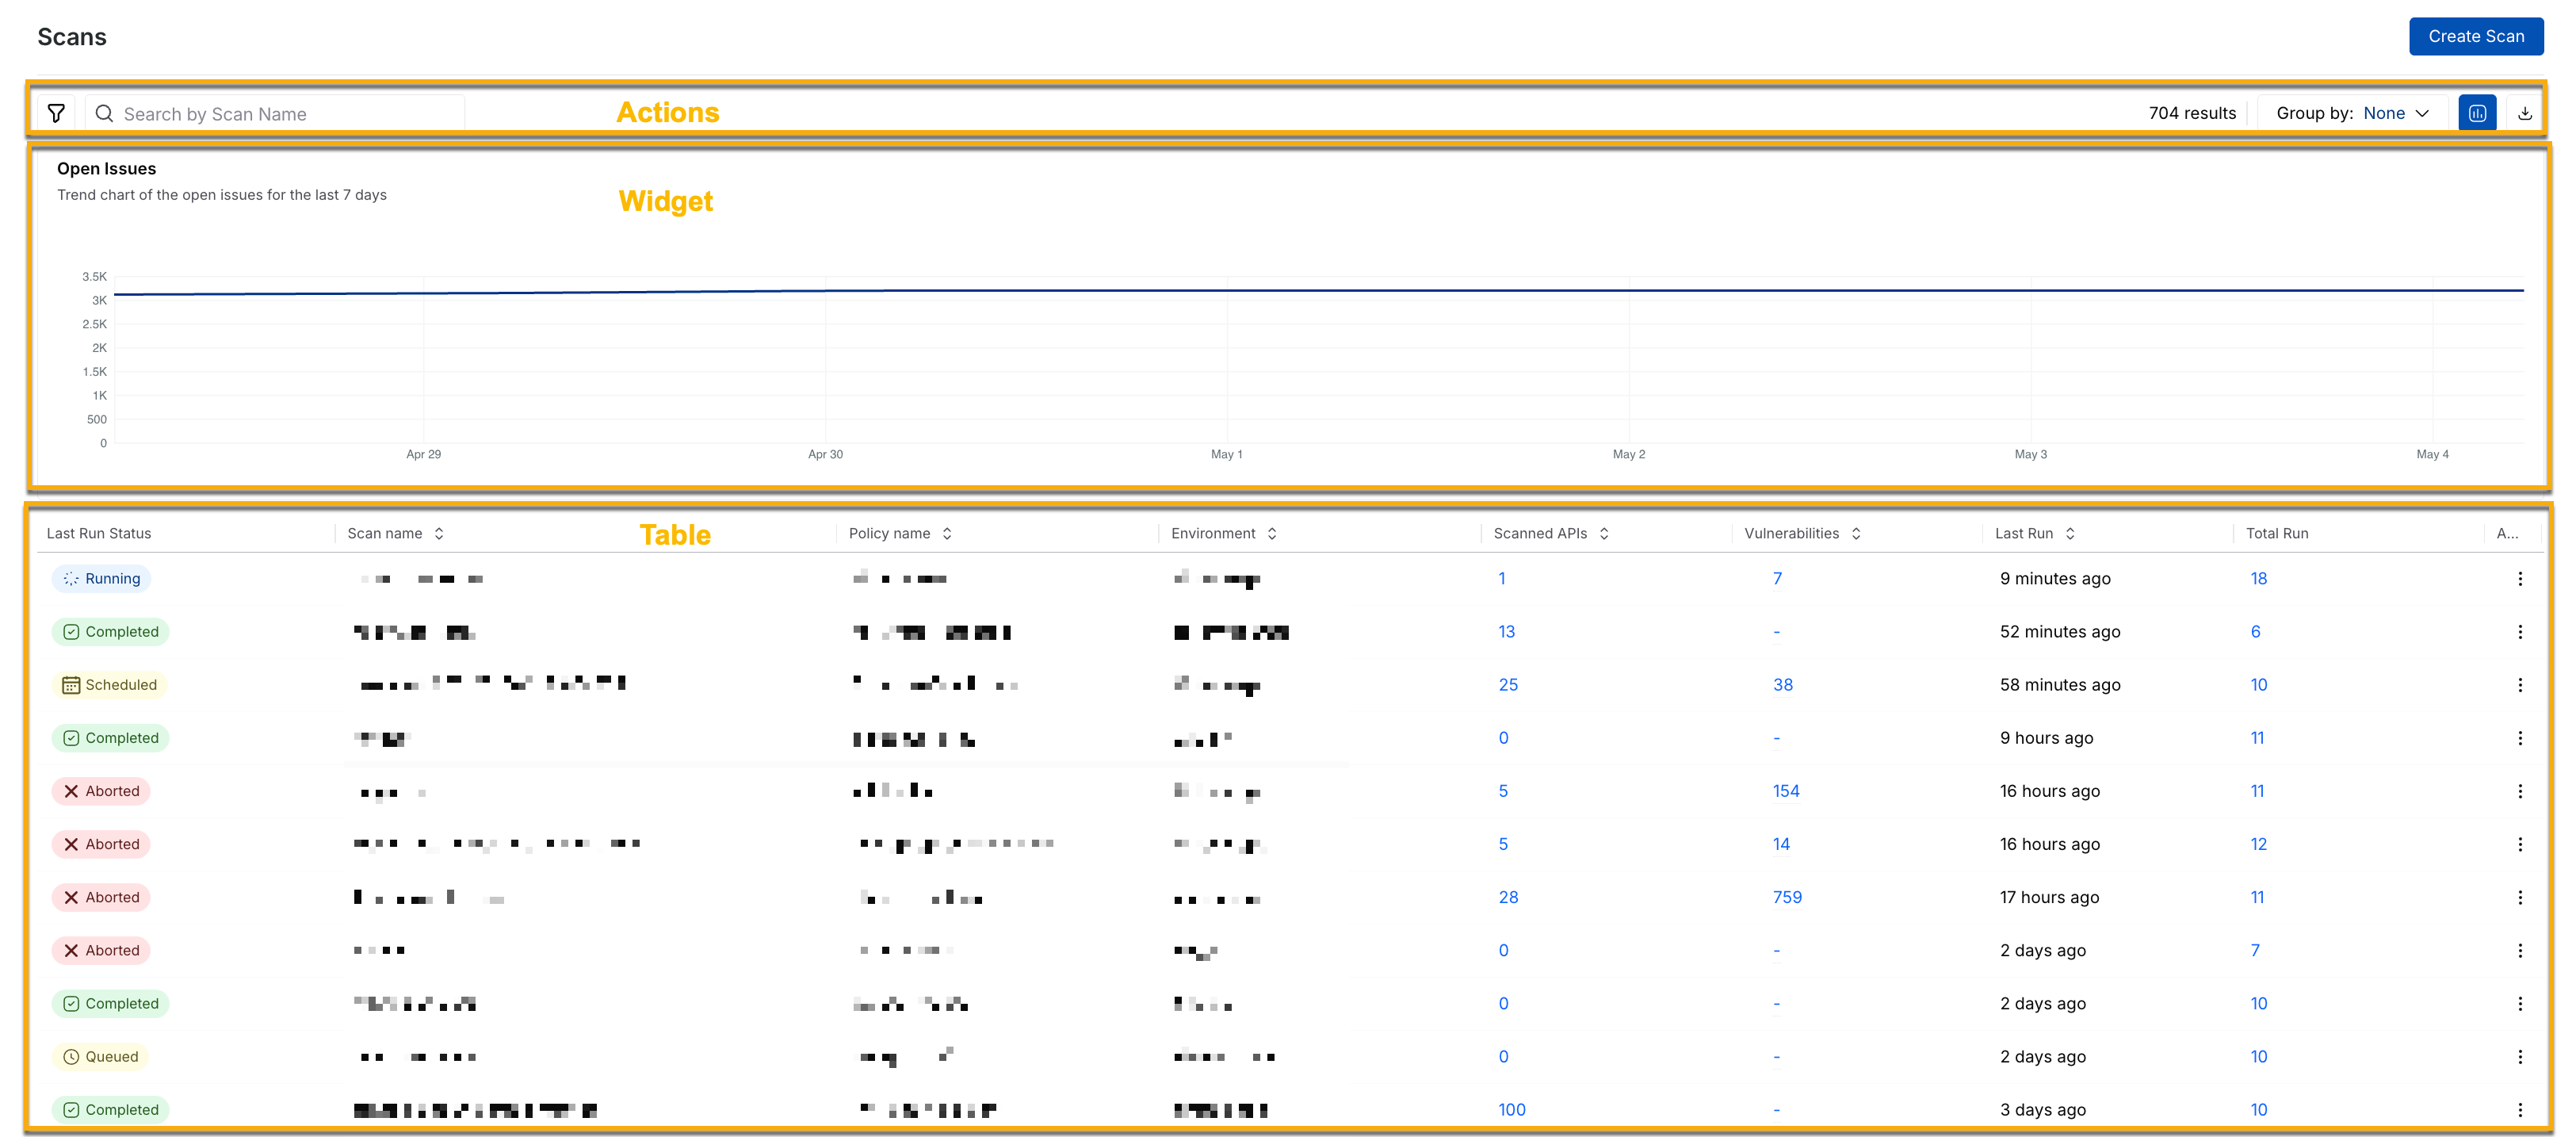
Scans View
Widget on the Scans page
At the top of the page, Traceable displays the Open Issues trend chart, which shows the number of unresolved vulnerabilities over the past 7 days. This helps you:
Understand whether risk exposure is increasing or decreasing.
Measure remediation progress over the week.
Identify sudden spikes after new scan executions.
A steady increase may indicate newly discovered issues or delayed remediation. A downward trend usually reflects effective issue resolution.
Table on the Scans page
Below the chart, Traceable also displays a Scans table that lists execution details and results. Each row highlights a scan configuration and its most recent execution status. The table includes the following columns:
Column | Description |
|---|---|
Last Run Status | Displays the most recent scan execution. This status can be from Completed, Queued, or Aborted. This helps you identify whether the scan executed successfully or requires your attention. |
Scan Name | Displays the name of the scan. You can click the scan to view detailed execution insights and findings. For more information, see the section below. |
Policy Name | Displays the policy selected during scan creation. This defines the attack depth and test depth applied to APIs. |
Environment | Displays the environment associated with the scan. |
Scanned APIs | Displays the number of APIs tested during scan execution. A higher number indicates improved coverage. |
Vulnerabilities | Displays the number of issues identified in the scan. You can click the value to view the detected vulnerabilities for the respective scan on the Issues page. |
Last Run | Displays when the scan was most recently executed. This helps you determine if the scan coverage is up to date. |
Total Run | Displays the total number of scan executions. Higher scan runs may indicate scheduled scans. |
Actions on the Scans page
The Scans page provides the following actions to organize and manage scans:
Action | Description |
|---|---|
Filter | The Filter ( |
Group By | The Group By drop-down in the page’s top right corner helps you organize scans based on the following attributes:
|
Search | The Search bar in the page’s top left corner helps you locate a specific scan by typing its name. |
Delete a scan | The Ellipse (
|
Understand and leverage scan details
The following tabs outline the key details displayed in each scan tab and explain how to use the data to tailor and analyze tests according to your requirements.
The Issues tab lists the vulnerabilities Traceable identified during the scan. It lists the Open or Reopened issues, grouped by name, with key details such as severity and last seen time. You can use this tab to analyze issues and prioritize remediation according to your requirements. For more information on issues, the key components visible on the page, and how you can drill down into each issue and leverage it, see Issues Overview and Management, respectively.
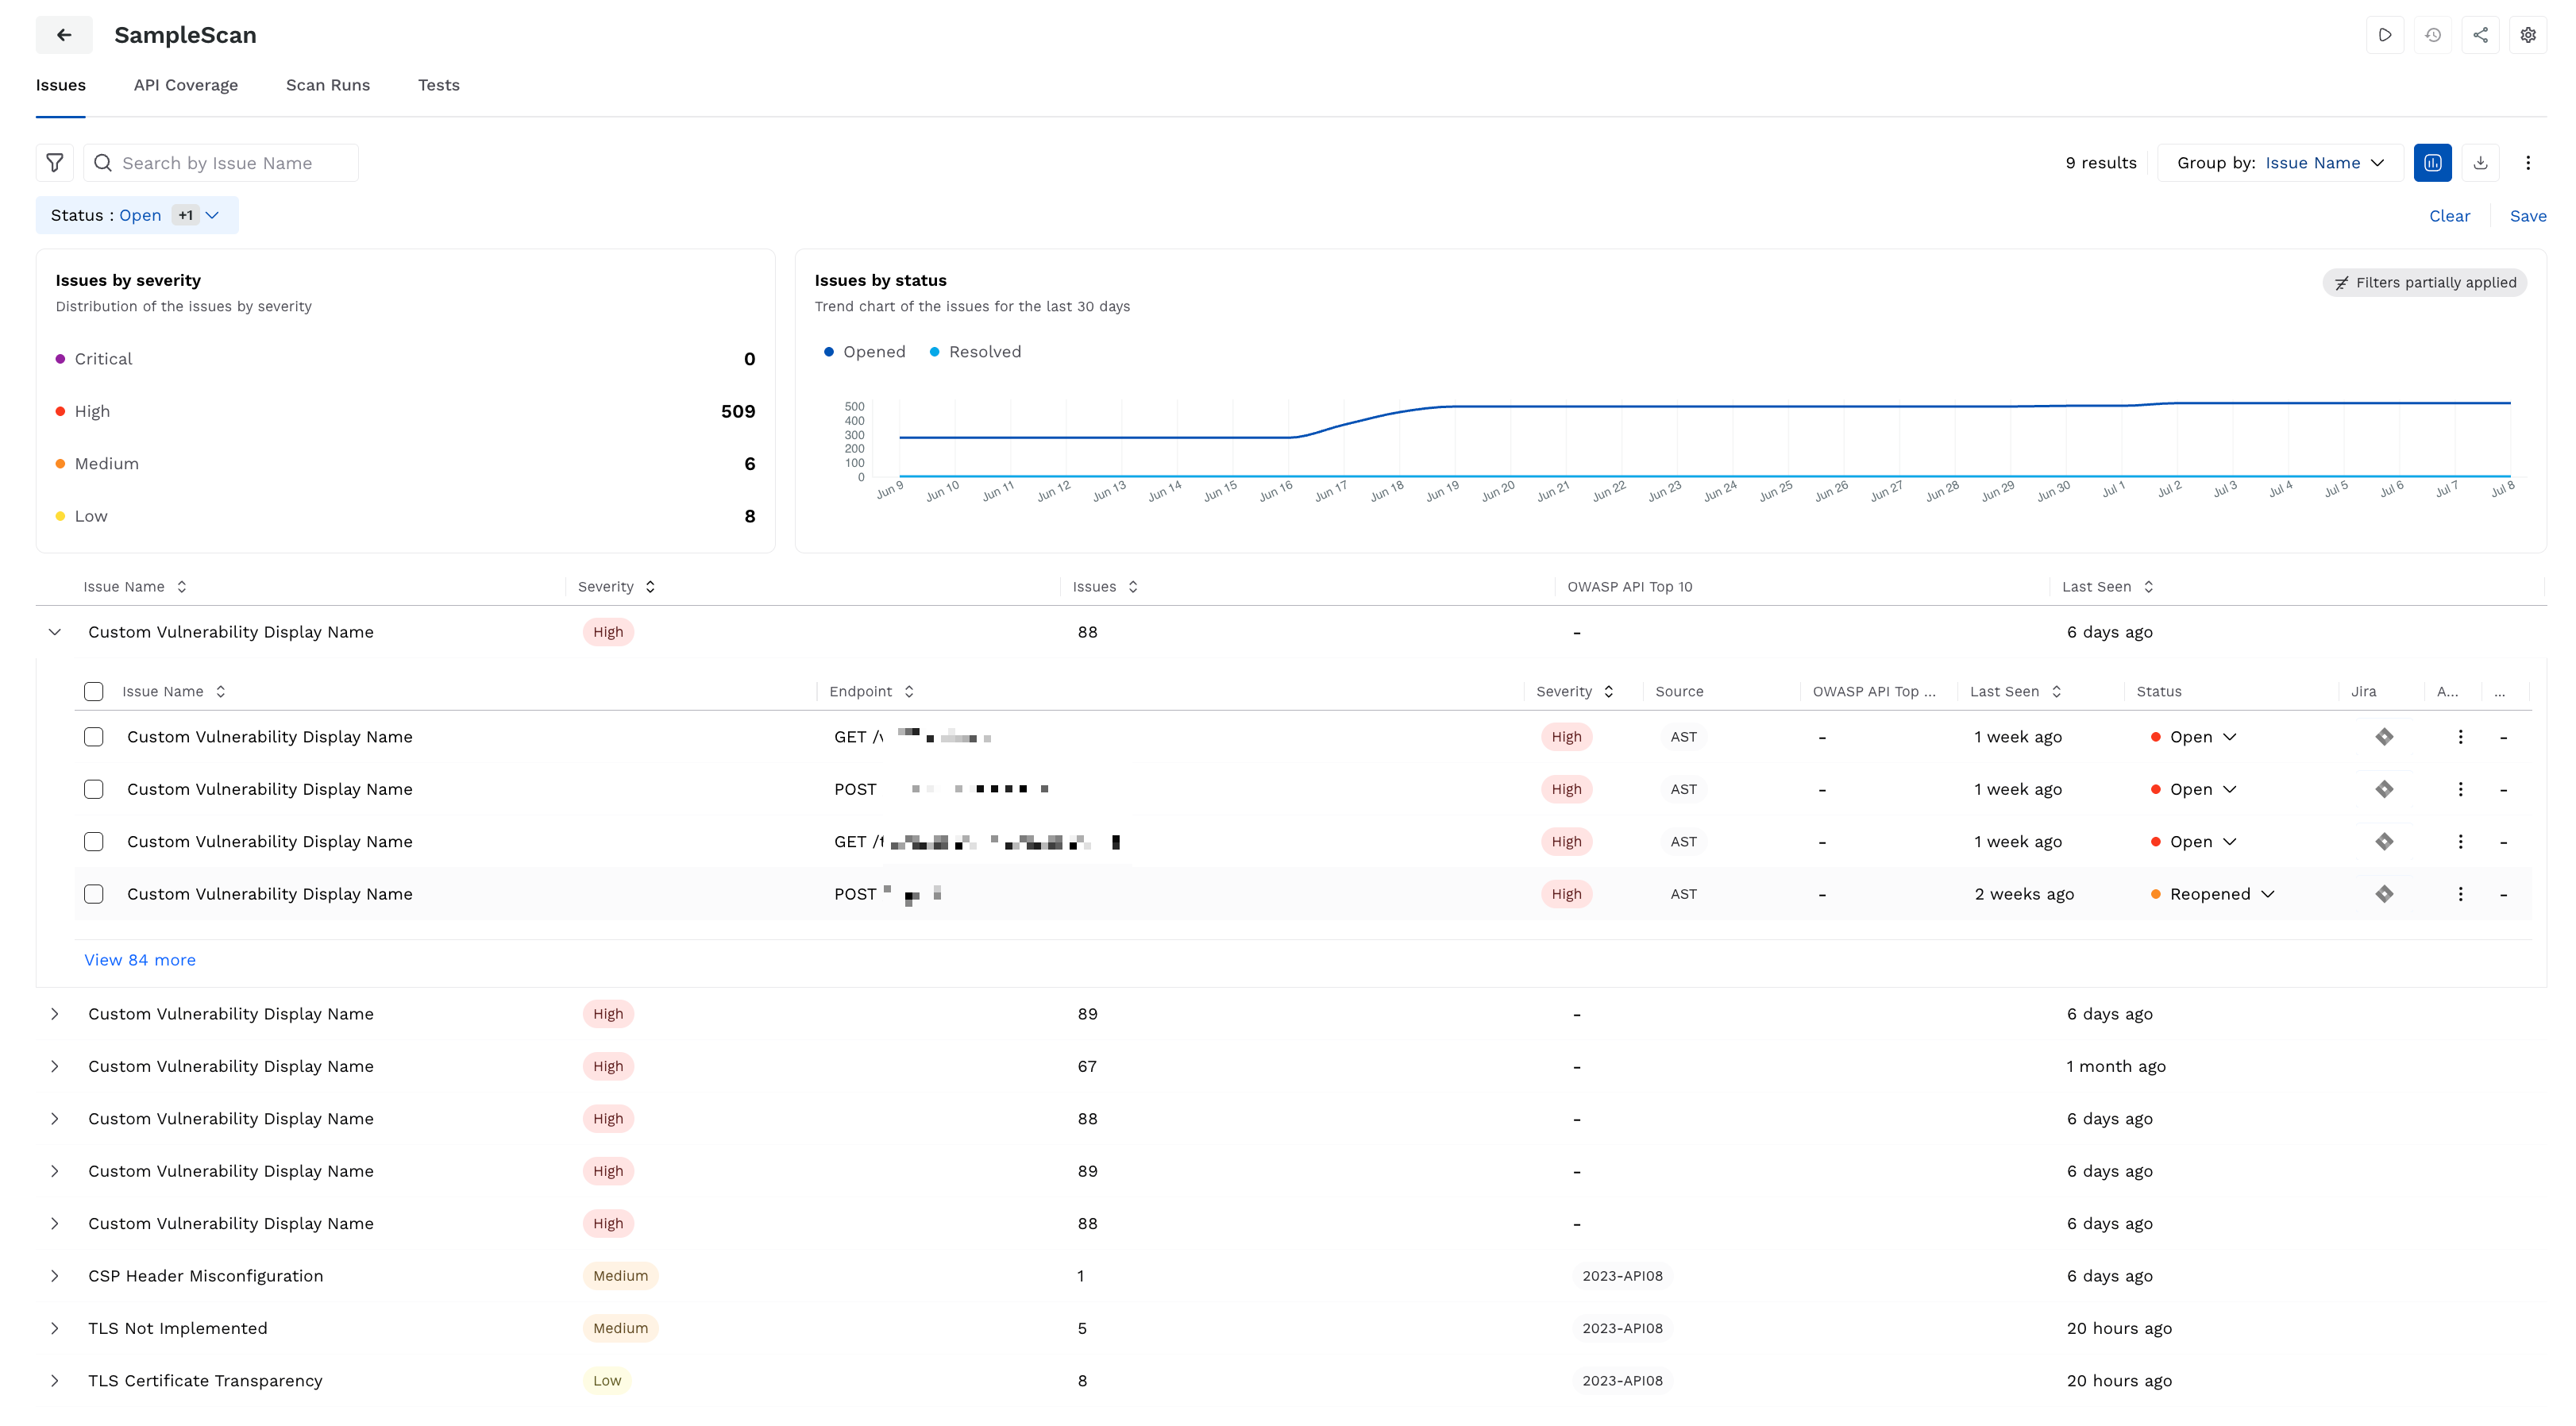
Issues in a Scan
When you drill down into an issue, Traceable shows the evidence corresponding to it. This evidence contains key details such as the Assertions and Mutations that Traceable used to detect the issue. You can customize the vulnerability (issue) detection by modifying these assertions and mutations and/or adding new ones from their respective tabs, according to your requirements. For more information, see Mutation and Assertion Overrides.
Auto-resolution of issues
Traceable, by default, auto-resolves issues in the following scenarios:
Scenario | Description |
|---|---|
Time-based scenario | An issue has not been detected in any of the scans for 60 days since its last occurrence. |
Scan-based scenario | An issue has not been detected in 15 consecutive scans since its last observation. |
While the above are default thresholds, you can contact Traceable Support to modify them according to your requirements.
Example: How auto resolution works
Consider an API endpoint that is being scanned for the Weak JWT Algorithm attack:
The endpoint has been scanned five times, and the most recent scan detected the issue (vulnerability).
Time-based scenario — This condition is not satisfied, as the issue was just detected, which resets the 60-day timer. The countdown starts only after the most recent detection date.
Scan-based scenario — This condition is not satisfied, as it requires 15 consecutive scans without detection of the issue (vulnerability). As the most recent scan detected the issue, the scan-based counter is reset to zero.
Traceable resolves the issue automatically if:
15 consecutive scans do not detect the issue.
60 days pass without the issue being detected.
The API Coverage tab provides details on how and which API endpoints Traceable exercised or covered during a scan. This helps you understand which endpoints were tested, the thoroughness of testing, and whether any vulnerabilities were identified. This view helps you understand and validate the effectiveness and API reachability based on the scan configurations.
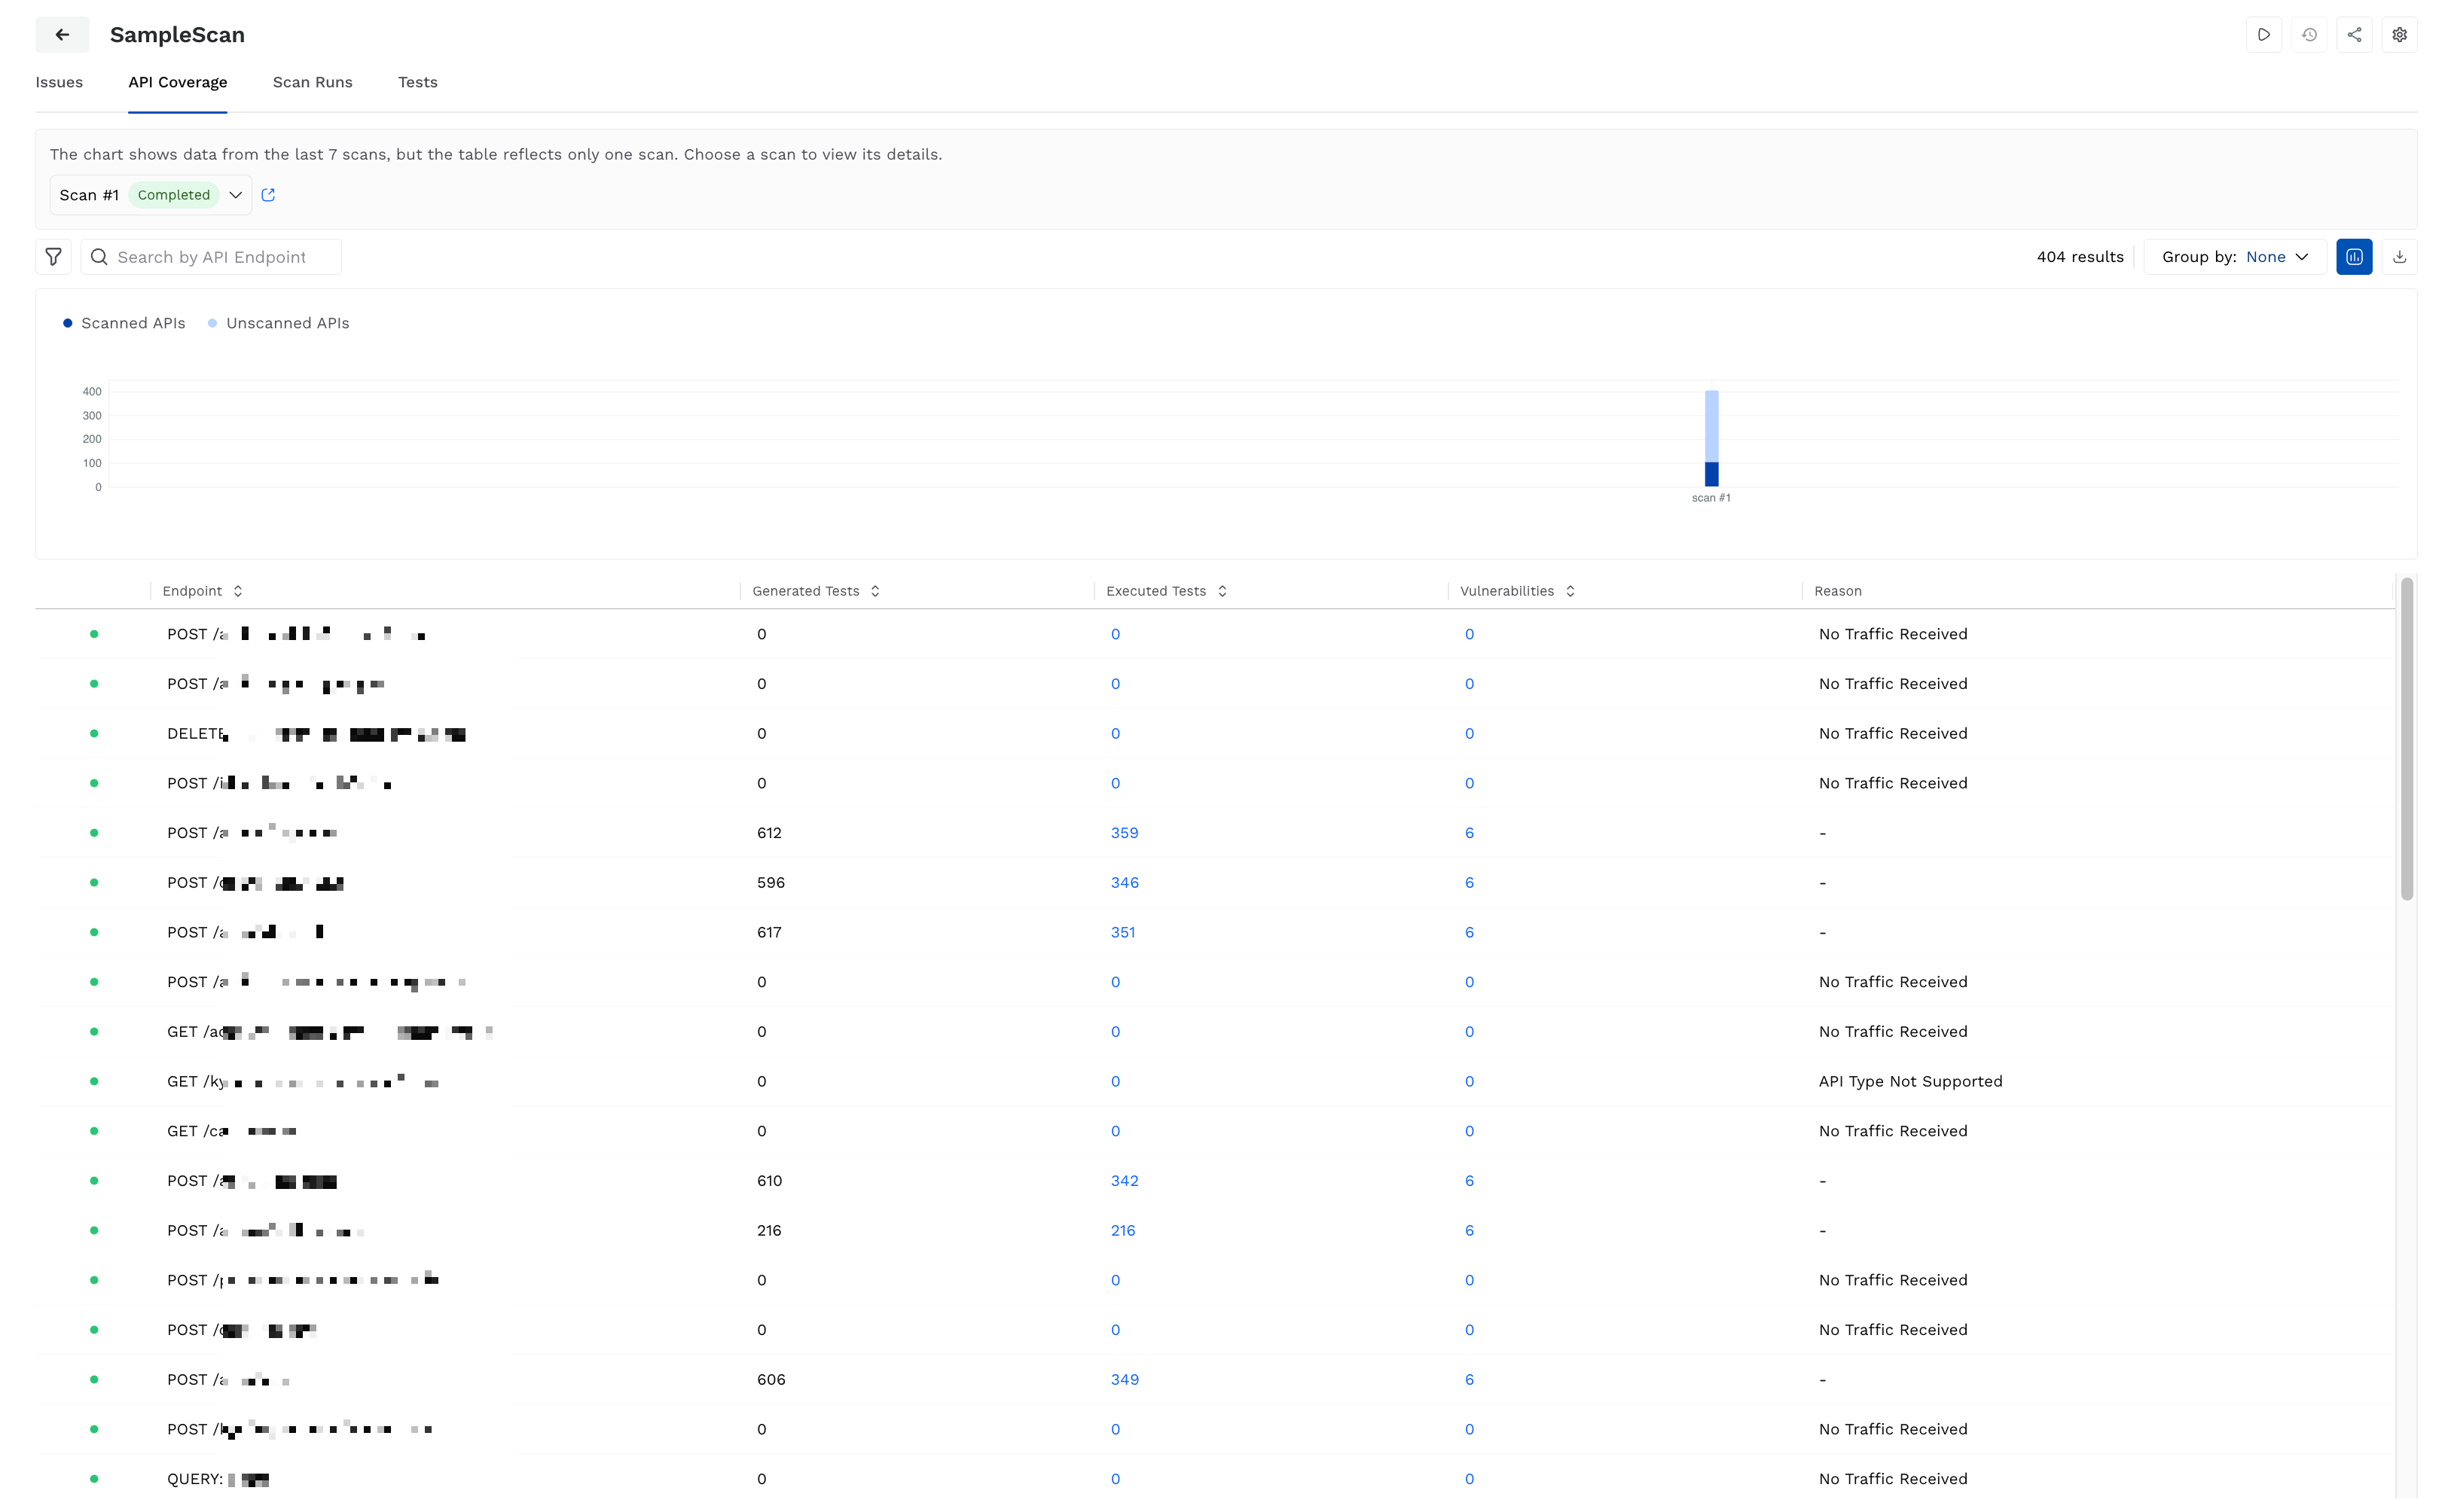
API Coverage in Scans
Understand the API Coverage tab
The top of the tab shows API coverage (scanned and unscanned APIs) over the past seven scans. You can use this chart to track scanning consistency and validate the scan progress. Below the chart, Traceable shows a table with the following details:
Column | Description |
|---|---|
Status | The scan indicator indicates whether the API is reachable (green dot) or not (red dot). |
Endpoint | The API endpoint name scanned as part of the scan run. |
Generated Tests | The number of tests generated for scanning the endpoint. |
Executed Tests | The number of tests executed from the number of generated tests for the endpoint. |
Vulnerabilities | The number of issues (vulnerabilities) identified on the endpoint. |
Reason | Specifies the reason if no tests were executed on the endpoint, for example, No Traffic Received. |
The details shown in the above table are for the latest scan by default. From the top of the tab, you can select the scan for which you wish to view the API coverage details. Traceable populates the table in the tab based on the selected scan.
Traceable also provides the following features in the tab:
Feature | Description |
|---|---|
Search bar | Locate an endpoint by typing its name. |
Filter icon | Refine the data shown in the tab by API name, reachability, vulnerability presence, and/or API scanning. After you apply, you can also save the filter for later use. The saved filters are visible under Filter → Saved tab. |
Group By drop-down | Group the data shown in the tab by Reachability, Reason for Skipping, or view it ungrouped (None). |
Visualization toggle | Show or hide the chart highlighting API coverage over the past 7 scans. |
Download icon | Download the list of APIs covered for offline analysis. |
Leverage the data shown in the tab
Consider a scenario where you have set up a scan that targets critical APIs in the HighTechApp environment. After a few scans have completed, you open the API Coverage tab to validate the effectiveness of the scan configurations.
You identify endpoints like POST /login and GET /transactions/get have a high number of generated and executed tests, as well as the number of issues that may have been identified. This highlights the effectiveness of the scan configurations. However, at the same time, you identify that endpoints like POST /users and POST /card/unblock have 0 Generated and Executed Tests, and No Traffic Received as the reason. This highlights the following:
The APIs were inactive during the scan.
The APIs did not receive any traffic matching the traffic type you configured during scan creation.
In these scenarios, you can do the following:
Modify the traffic type for the scan based on where traffic is available for Traceable to scan the endpoint.
Verify if the endpoints are still in use in your application ecosystem.
Similarly, there can be scenarios in which the number of executed tests is greater than 0, and the number of identified issues (vulnerabilities) is 0. In such scenarios, if you think the API coverage is lower than expected, you can do the following:
Validate and/or change the traffic type to represent real-world usage.
Modify the policy (attack sets) that you want Traceable to use for testing the endpoints.
Verify whether the defined authentications, if any, are blocking Traceable from thoroughly scanning the endpoints.
The Scan Runs tab lists all scan executions for the scan configuration in reverse-chronological order, with the latest at the top. Each row in the tab represents an individual scan execution and helps you track scan performance and behavior over time.
.png)
Scan Runs
Understand the Scan Runs tab
The tab shows a table with the following details:
Column | Description |
|---|---|
Status | Indicates whether the scan was completed successfully or was aborted. |
Scan Run | Indicates a scan execution in reverse sequential order. |
Duration | The time taken for scan completion. |
Tests Generated | The number of tests generated for scanning the endpoints. |
Tests Executed | The number of tests executed from the number of tests generated for the endpoints. |
Scanned APIs | The number of endpoints scanned during the scan run. |
Vulnerabilities | The number of issues (vulnerabilities) identified in the scan run. |
Start Time | The timestamp to indicate when the scan began. |
The above details help you understand the scan consistency and detect anomalies such as aborted scan runs and inconsistent test counts.
Traceable also provides the following features in the tab:
Feature | Description |
|---|---|
Filter icon | Refine the data shown in the tab by scan Status, vulnerability Severities detected in the scan, and/or Vulnerable APIs. After you apply, you can also save the filter for later use. The saved filters are visible under the Filter → Saved tab. |
Group By drop-down | Group the data shown in the tab by Status, or view it ungrouped (None). |
Download icon | Download the list of scan runs for offline analysis. |
Upon clicking a scan run, Traceable displays a slide-out panel with the following details:
Tabs | Details |
|---|---|
Overview | This tab displays scan metadata, such as scan ID, environment, and initiator. It also displays the number of APIs scanned, the total execution time, the scan status, and the status reason. This information helps verify what was scanned, how the scan was triggered, and whether any configurations may have affected the results. 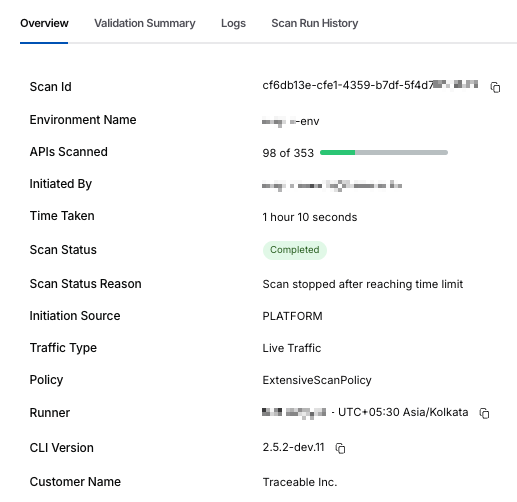 Scan Details Overview |
Validation Summary | This tab displays an overview of API and domain reachability during the scan. It highlights the percentage of APIs that Traceable successfully reached, along with the number of reachable APIs, the number of APIs that failed authentication, and the number of APIs for which no traffic was observed. You can use this information to identify connectivity, authentication, or configuration issues that may affect scan coverage. The tab also displays Domain Reachability information, which helps verify whether the domains associated with the scanned APIs are accessible to Traceable. Additionally, the Runner Health Metrics During Scan section displays resource utilization metrics, such as CPU and memory usage, that help you determine whether runner performance issues impacted scan execution. 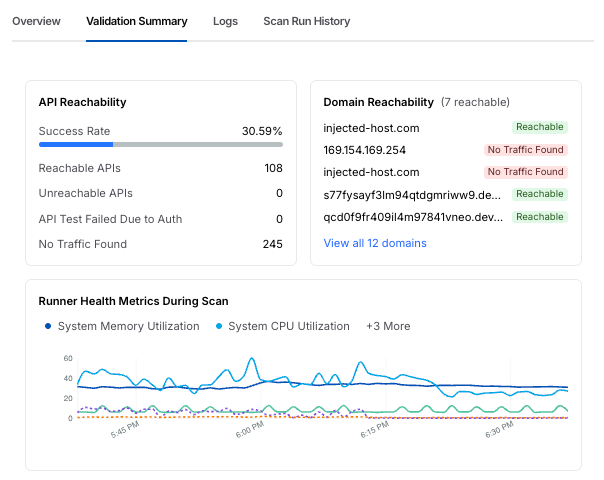 Scan Details Validation Summary |
Logs | This tab provides detailed runtime activity around the scan. It lists the initialization steps, execution flow, and any errors or warnings. This information is helpful for troubleshooting failures, timeouts, authentication errors, and unexpected scan behavior. |
Scan Run History | This tab provides a detailed history of a scan run. It lists the user who queued the scan for execution, the associated runner name, the CLI version, the time the scan started, and the total time taken for the scan. This information helps you identify who triggered the scan and when it was triggered.  Scan Details Run History |
In this tab’s top right corner, you can click Re-Run to enable Traceable to execute the scan again. In the Re-Run Scan pop-up window that appears, you can select how Traceable should select the runner from the following options:
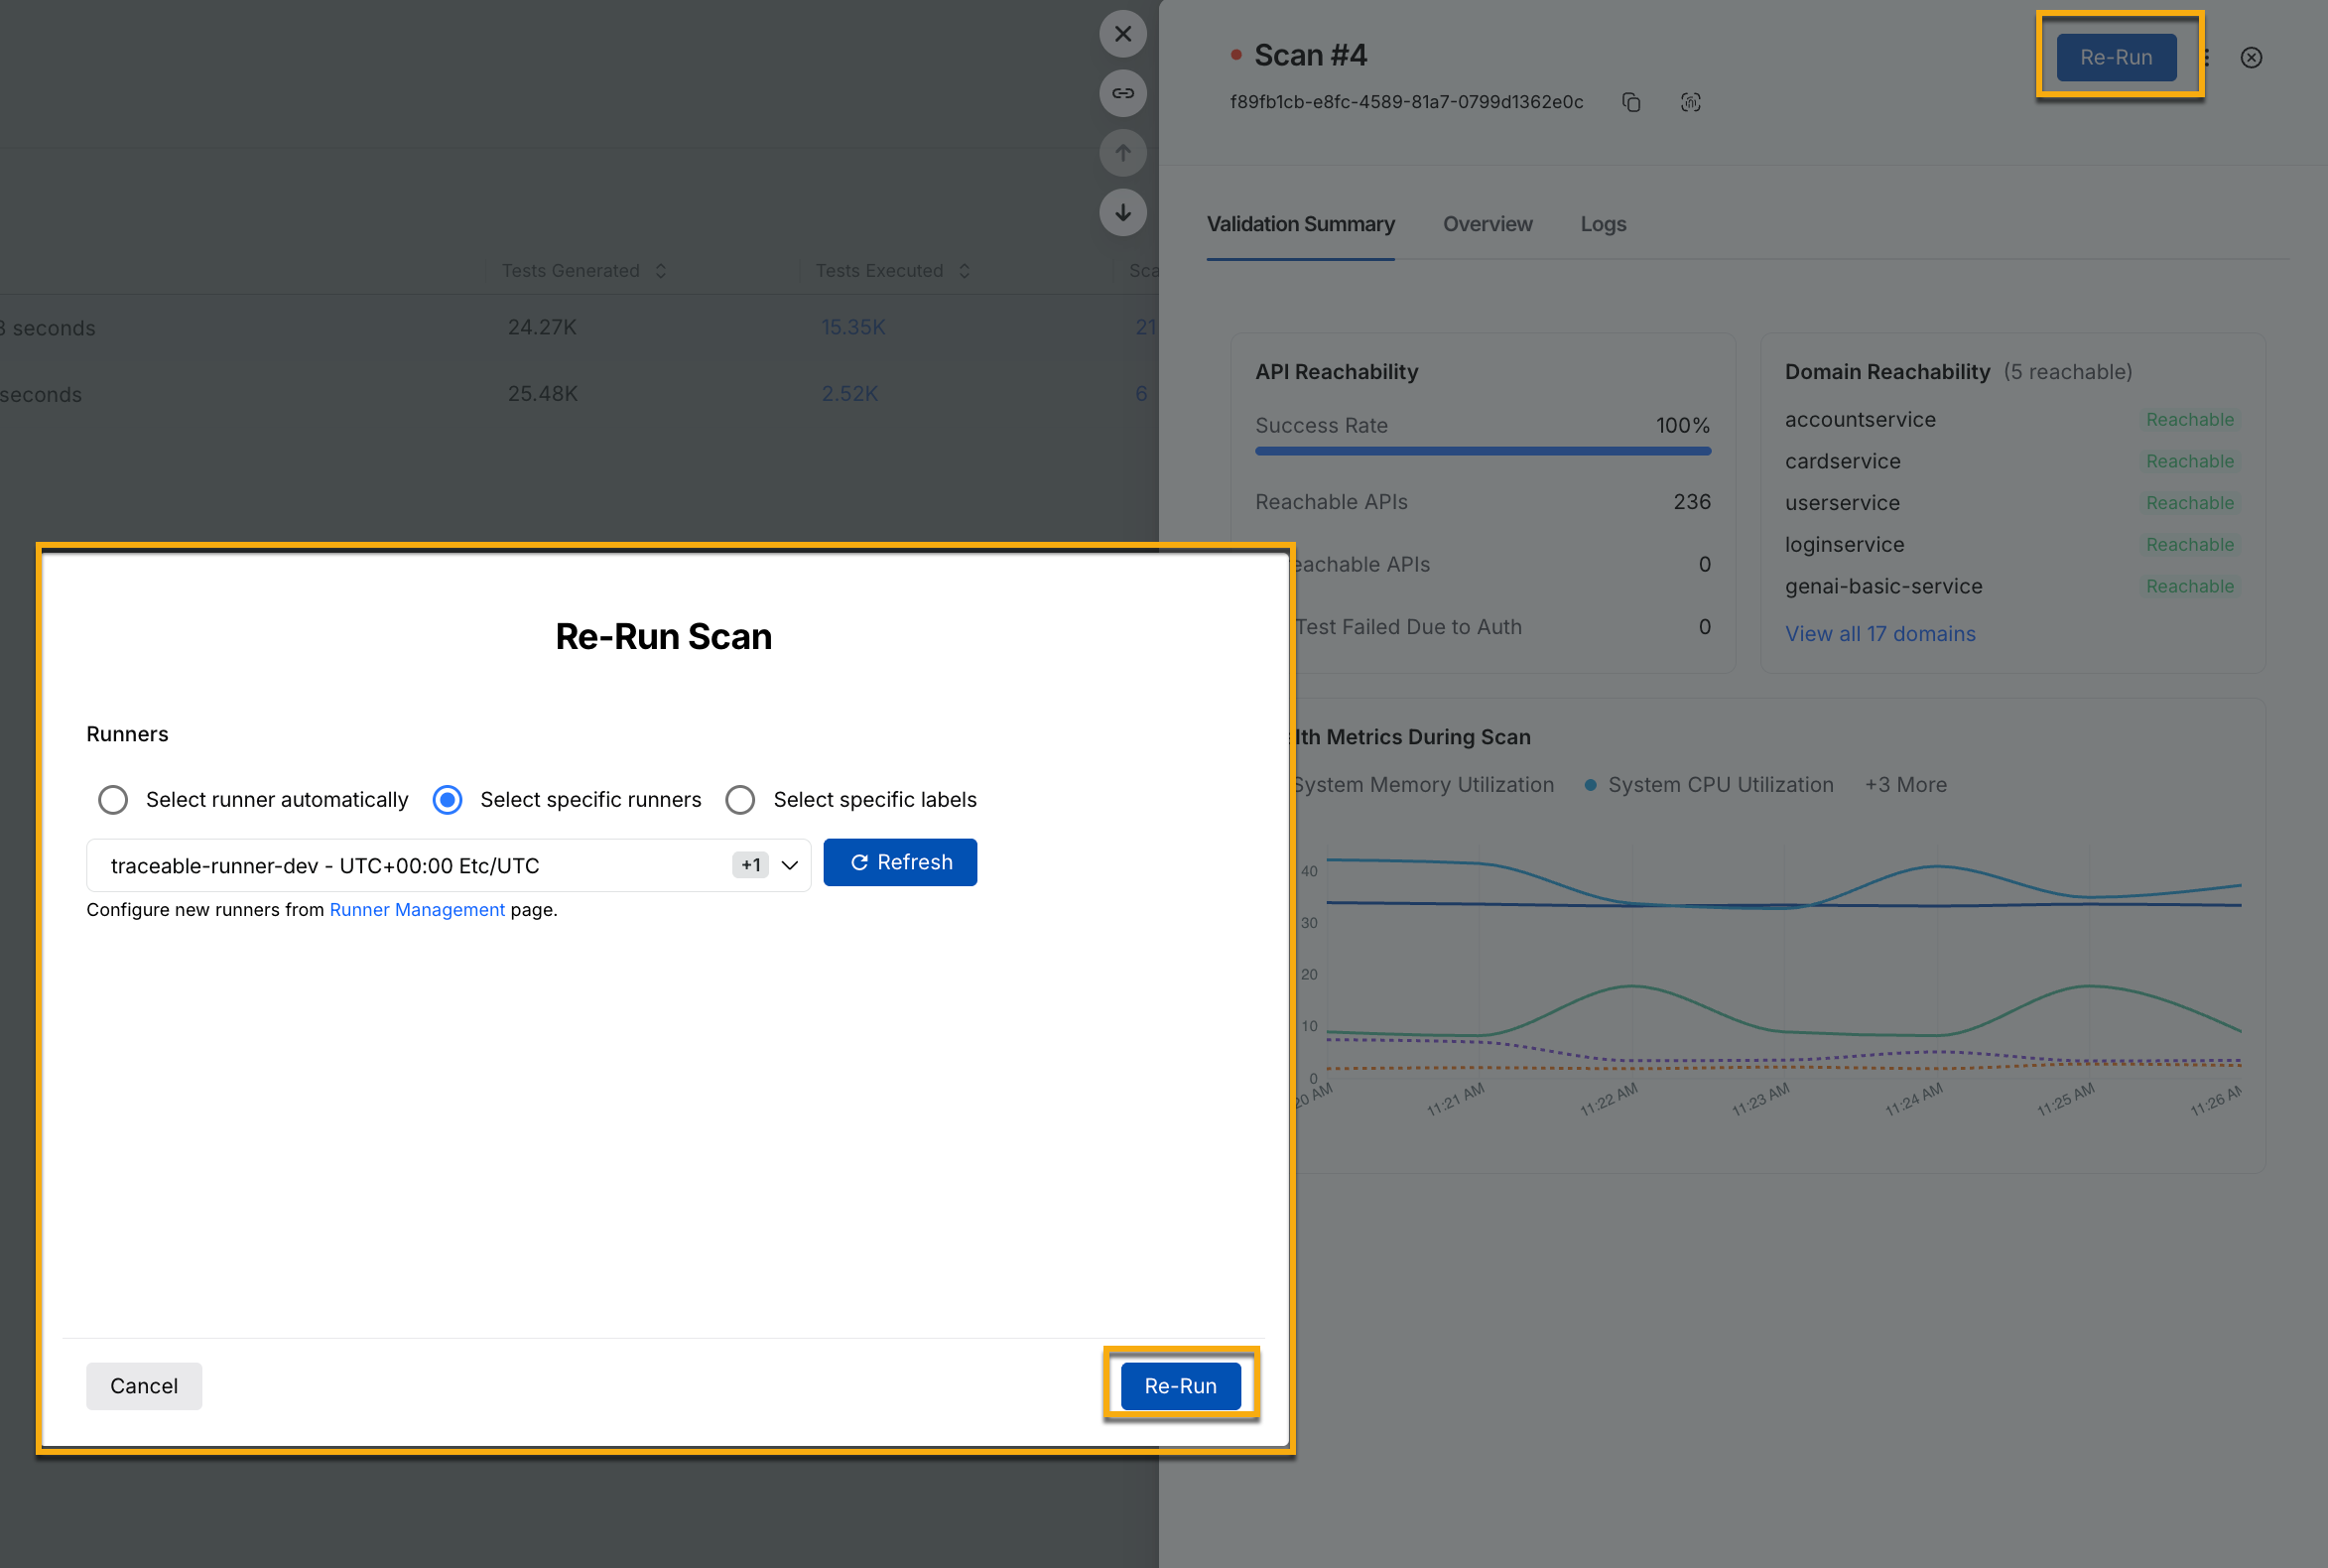
Re-running a Scan
Option | Description |
|---|---|
Select runner automatically | Enables Traceable to select the most suitable runner from the configured runners list. |
Select specific runners | Enables Traceable to execute the scan using the runner(s) you select. |
Select specific labels | Enables Traceable to execute the scan using the most suitable runner from the Label(s) you select. |
Once you have selected the runner, click Re-Run.
Upon re-run, Traceable executes all the scans generated and displays the results in the same Scan Runs tab. Re-running a scan is useful when you identify that the number of tests executed is less than the number of tests generated, or when the scan run was aborted for some reason.
Leverage the data shown in the tab
Consider a scenario where you created a scan that runs once daily. You can use the Scan Runs tab to compare scan executions and scan statuses over time.
Let us say that Scan #7 generated the most tests and executed successfully. This indicates a comprehensive API coverage and scan execution. However, Scan #3 got aborted midway, executed only 100 tests, and scanned only 3 APIs. This may have been caused by multiple factors, such as an environmental error or an authentication failure. In this scenario, you can analyze the issues and set up alerts so the scan does not abort mid-way.
Consistent values across the Tests Executed and Scanned APIs columns help you confirm scan stability, while the reduced count of vulnerabilities helps you validate security measures that you may have taken.
Any sudden drop or spike in either of the above values may indicate a change, such as API reachability, availability, or configuration issues. The Scan Runs tab acts like an audit trail, helps you analyze any change, and:
Identify and troubleshoot aborted scans.
Validate whether newly added APIs are being tested in the scans.
Confirm whether the identified issues are increasing or decreasing.
Modify scan configurations according to your requirements.
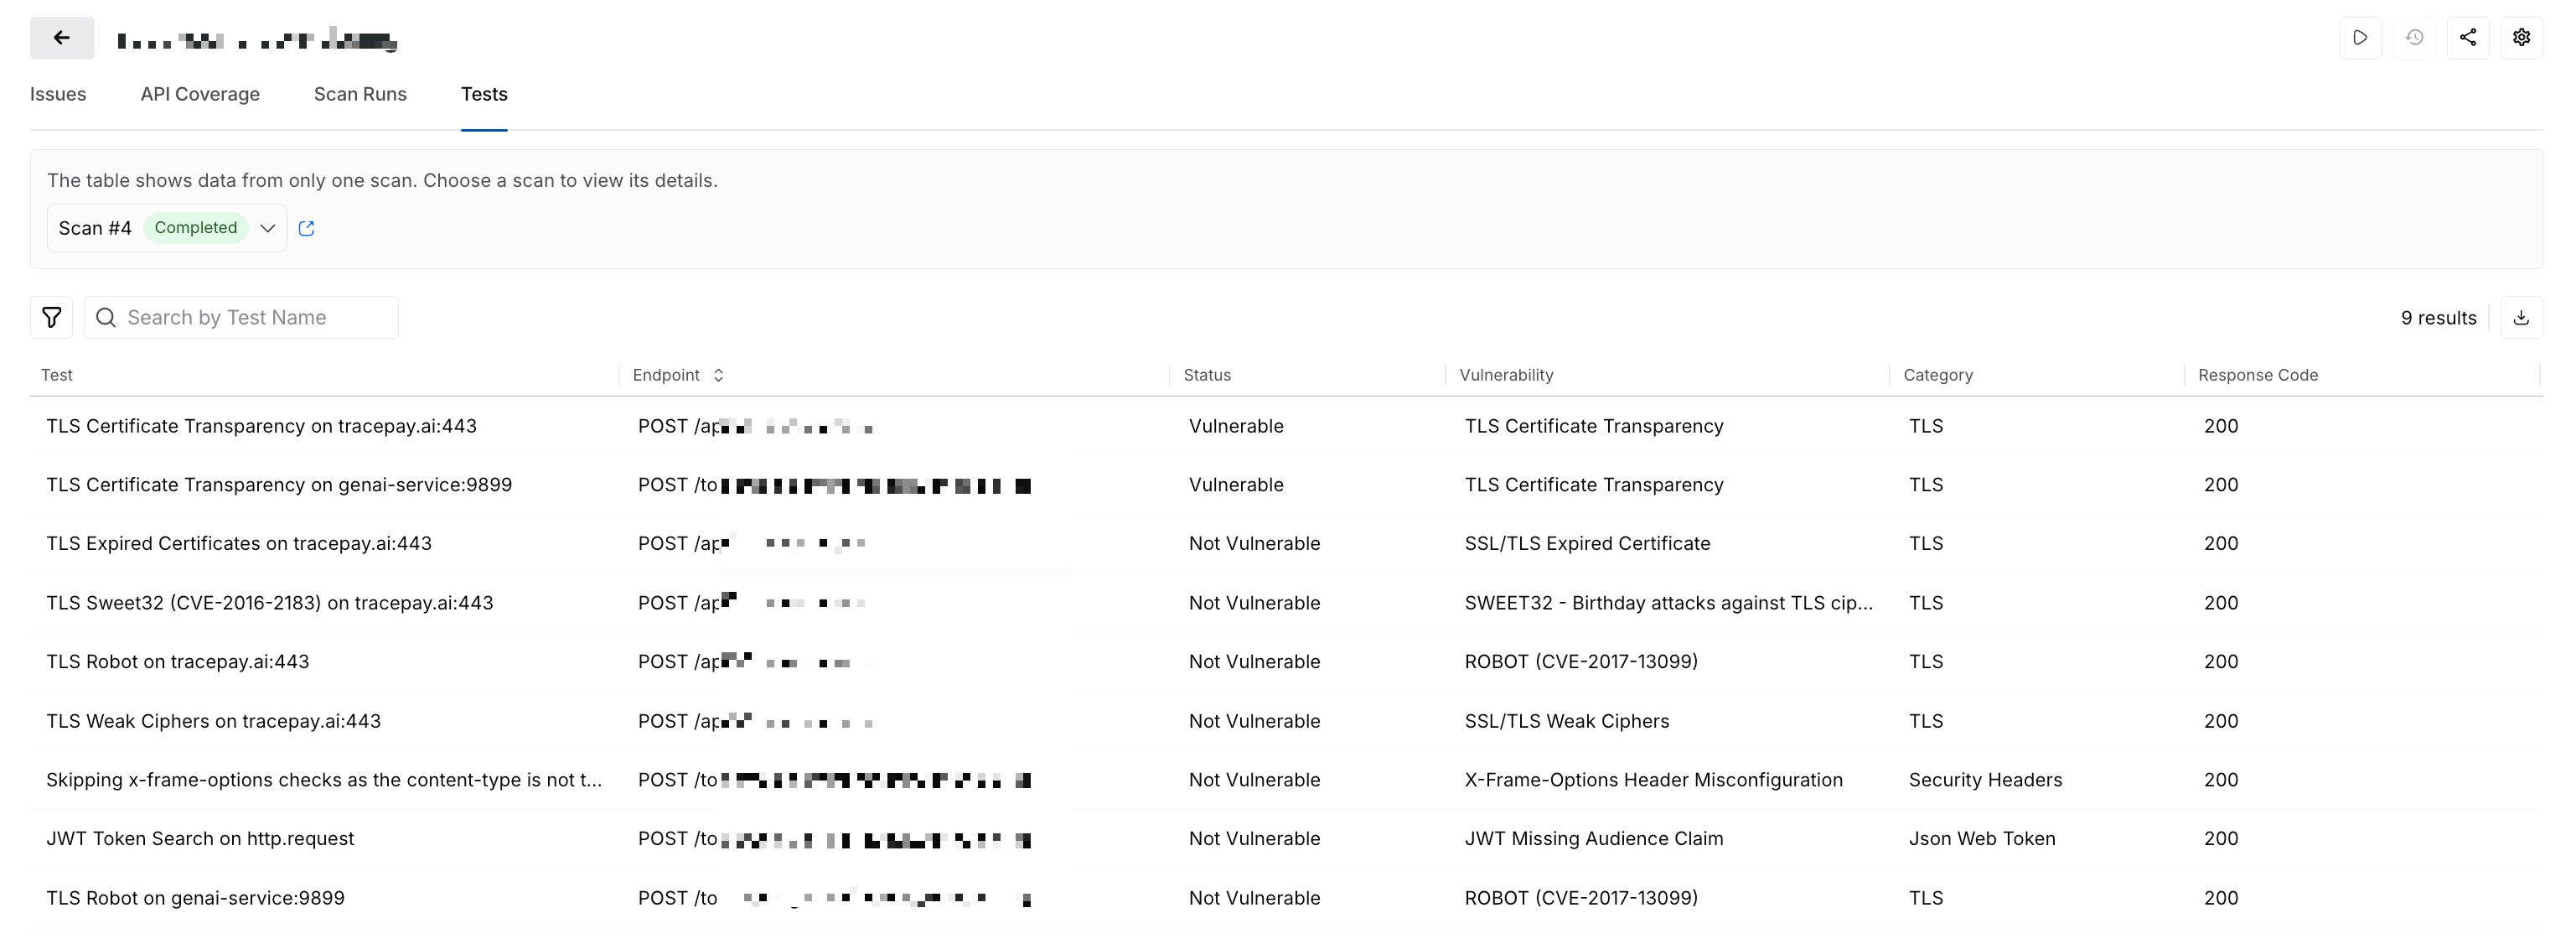
The Tests tab provides granular information on all the tests executed during a scan run. While Traceable selects the latest scan run by default, you can change it according to your requirements using the drop-down at the top. This tab helps you navigate how Traceable executed tests on each endpoint, if the response code was as expected, and if any issues (vulnerabilities) were identified.
Tests for a Scan Run
Understand the Tests tab
The tab shows data for the latest scan run and includes the following details:
Column | Description |
|---|---|
Test | The name or type of test executed as part of the scan. |
Endpoint | The API on which the test was executed. |
Status | The result of the above test from either of the following:
|
Vulnerability | The vulnerability type for which the test was executed. |
Category | The category to which the above vulnerability type belongs. |
Response Code | The status code returned by the API endpoint post-test execution. |
The above details help you understand and correlate endpoint behavior tests and evaluate vulnerability detection.
Traceable also provides the following features in the tab:
Feature | Description |
|---|---|
Search bar | Type and locate any of the above details. |
Filter icon | Refine the data displayed in the tab using various metrics. After you apply, you can also save the filter for later use. The saved filters are visible under Filter → Saved tab. |
Download icon | Download the list of tests associated with a scan for offline analysis. |
Leverage the data shown in the tab
Consider that you ran a scan and navigated to the Tests tab to validate the executions. Upon navigating, you notice that several tests corresponding to the POST /login endpoint have the Status as Error. Hovering over the status shows that the connection timed out while the test was running on the endpoint. This indicates that the endpoint may have been unresponsive during the scan execution or may have a misconfiguration. You can use this information to analyze endpoint availability and configuration, ensuring scans run without errors.
Clicking a test opens its detailed view that highlights the following information:
Test Details — Lists information, such as the tested endpoint, the status code returned by the endpoint, and the Trace ID associated with the test. You can also view the traces associated with the endpoint and copy the test as a cURL command. These options help you analyze and debug endpoints when issues arise. Once you have made the changes, you can run the test again.
Note
Traceable does not capture Traces for a test in the following scenarios:
When the Test Status indicates an Error (The APIs are not reachable).
When the Category of the identified vulnerability is TLS.
When the Attack Methodology Type for a plugin is Passive.
Assertions — Lists the validations Traceable has executed to identify the vulnerabilities. The Result column in this tab indicates whether the result was deemed vulnerable. You can use this information to analyze the validations and add new assertions or modify the existing ones according to your requirements. For more information, see Mutation and Assertion Overrides.
Mutations — Lists the modifications Traceable has made to the original request to test the endpoint. You can use this information to analyze the modifications Traceable makes and add custom mutations or modify existing ones according to your requirements. For more information, see Mutation and Assertion Overrides.
Request and Response — Details the HTTP headers, cookies, and body of the API request and the corresponding response. You can use this data to debug and confirm whether or not sensitive data is being exposed through the API.
You can use the data shown in the Tests tab and do the following:
Verify the detected issues (vulnerabilities).
Analyze the executed tests, how Traceable executed them, and the reason for failure.
Enhance the test logic by modifying the tests to meet your requirements.
The Reachability Tests tab provides visibility into whether Traceable can successfully reach API endpoints before generating and executing security tests during a Replay or DAST scan.
Note
This tab is available for XAST Replay and DAST scans only.
This tab displays data when you use CLI version 2.5.0 and above.
Traceable executes reachability tests differently depending on the scan type:
XAST Replay scans — Traceable replays previously captured traces for each endpoint.
DAST scans — Traceable uses request samples from the specification file that you uploaded during scan creation.
These reachability tests are executed without applying mutations or assertions. Based on the response received, Traceable determines whether the endpoint is reachable and eligible for security testing.
Traceable generates security tests only for endpoints that are successfully reachable. If an endpoint is unreachable, no security tests are generated for that endpoint in the Tests tab.
Understand the Reachability Tests tab
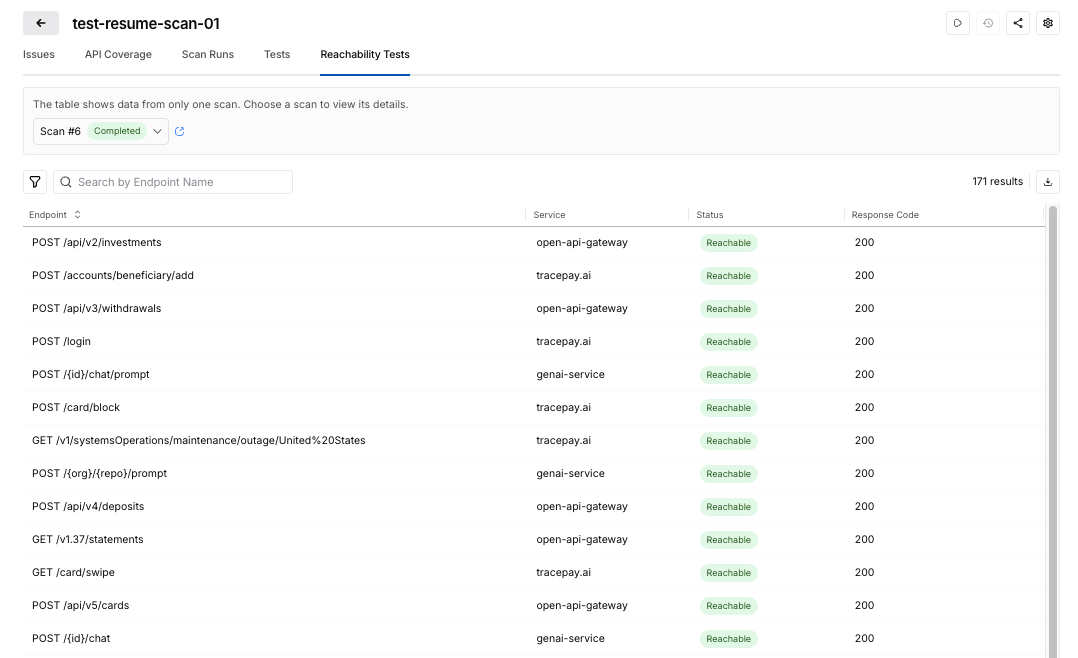
Reachability Tests
The tab displays a table with the following details:
Column | Description |
|---|---|
Endpoint | The API endpoint for which Traceable executed the reachability test. |
Service | The service associated with the endpoint. |
Status | Indicates whether the endpoint is Reachable, Unreachable, Authentication Failed, or Error. |
Response Code | The HTTP or gRPC response code returned by the endpoint during the reachability test. |
Traceable determines reachability status based on the response received from the endpoint:
Status | Description |
|---|---|
Reachable | The endpoint returned a successful response, for example, an HTTP 2xx or 3xx status code. |
Unreachable | The endpoint returned an unsuccessful response, for example, HTTP 4xx or 5xx, excluding authentication failures. |
Authentication Failed | The endpoint returned an authentication-related failure, for example, HTTP 401, 403, or 407. |
Error | Traceable could not send the request to the endpoint. |
If an endpoint is temporarily unreachable, Traceable retries the reachability test multiple times before determining the final status.
Traceable also provides the following features in the tab:
Feature | Description |
|---|---|
Search bar | Type and locate any of the above details. |
Filter icon | Refine the data displayed in the tab using various metrics. After you apply, you can also save the filter for later use. The saved filters are visible under Filter → Saved tab. |
Download icon | Download the list of reachability tests associated with a scan for offline analysis. |
Leverage the data shown in the tab
You can use the Reachability Tests tab to understand endpoint availability and interpret scan behavior more effectively.
For example, if security tests are not generated for certain endpoints in the Tests tab, you can review their reachability status to determine whether the endpoints were unreachable or blocked due to authentication failures during the scan.
Similarly, if multiple endpoints show an Authentication Failed status, you can verify whether the configured authentication settings allow Traceable to access the endpoints correctly.
Consistent Reachable statuses across endpoints indicate that Traceable can successfully replay traffic and proceed with generating security tests. Unexpected spikes in Unreachable or Error statuses may indicate configuration issues, environment instability, or changes in endpoint availability.
The Reachability Tests tab helps you:
Identify endpoints that are not eligible for security testing.
Troubleshoot authentication and connectivity issues.
Validate endpoint availability before generating security tests.
Analyze changes in endpoint reachability across scan executions.
Assign labels to a scan
Labels enable you to categorize scans according to your conventions, such as critical APIs, regression, production, and testing. Once assigned, you can use these labels to group and organize scans on the Scans page. For more information, see Actions on the Scans page. These labels help you group and organize a large number of scans and improve visibility when using the Group By option. For example, assigning a label named production may help you group and review all production-related scans.
To assign a label to a scan, complete the following steps:
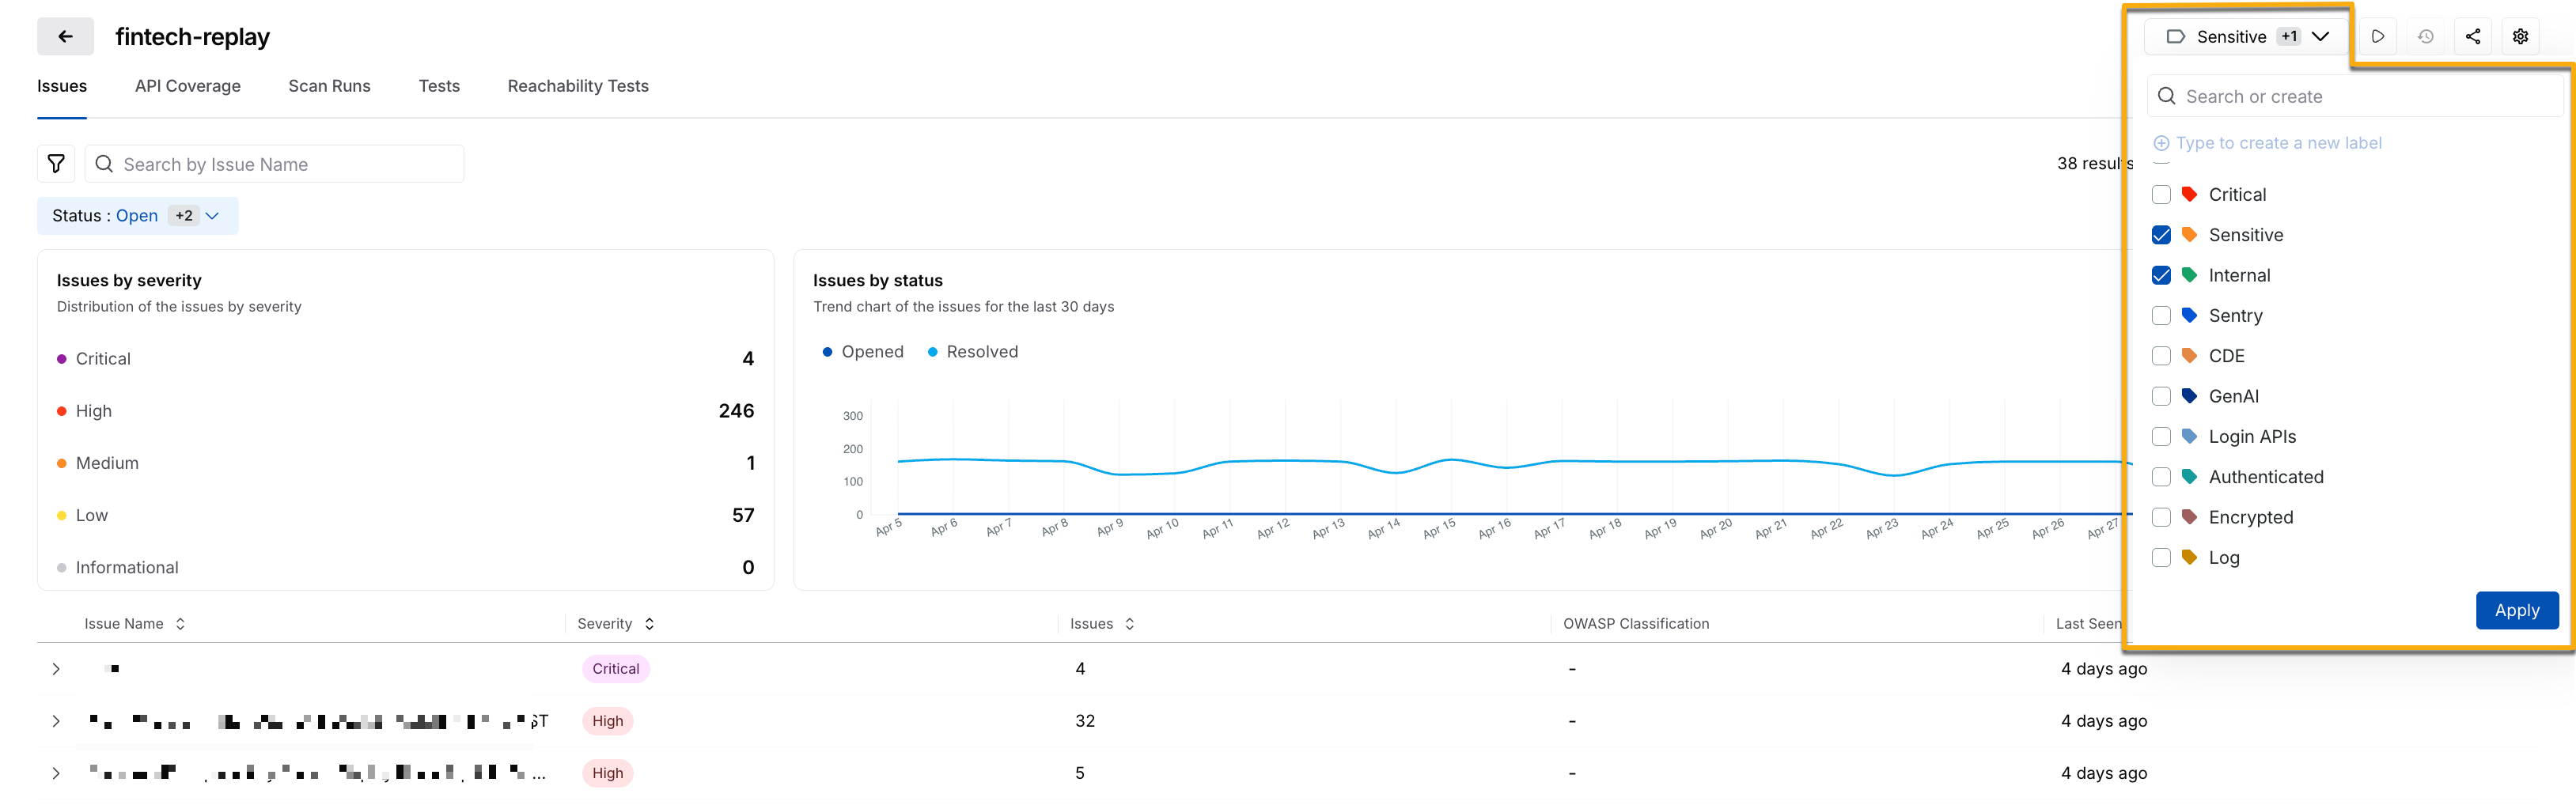
Assign a Scan Label
Click a scan in the table on the Scans page.
In the Scan Details page’s top right corner, click Manage Labels.
Select one or more labels from the list of pre-existing labels and/or type to create a new one.
Click Apply.
Once assigned, the label is available for filtering and grouping on the Scans page.