The Reports page in AST lists reports of all completed scans initiated using the CLI and/or the platform. It acts as a centralized dashboard where you can view the summary of past scans, asses the details, and identify scans that discovered vulnerabilities in your application ecosystem. To view the Reports page, navigate to Testing → Reports.
How are Reports useful?
You can use the reports to:
Track scans across environments and modes (CLI or Platform).
Analyze vulnerabilities discovered using scans.
Access scan details and results for auditing and remediation.
Share scan results with your team and show vulnerability trends.
Understanding the Reports Page
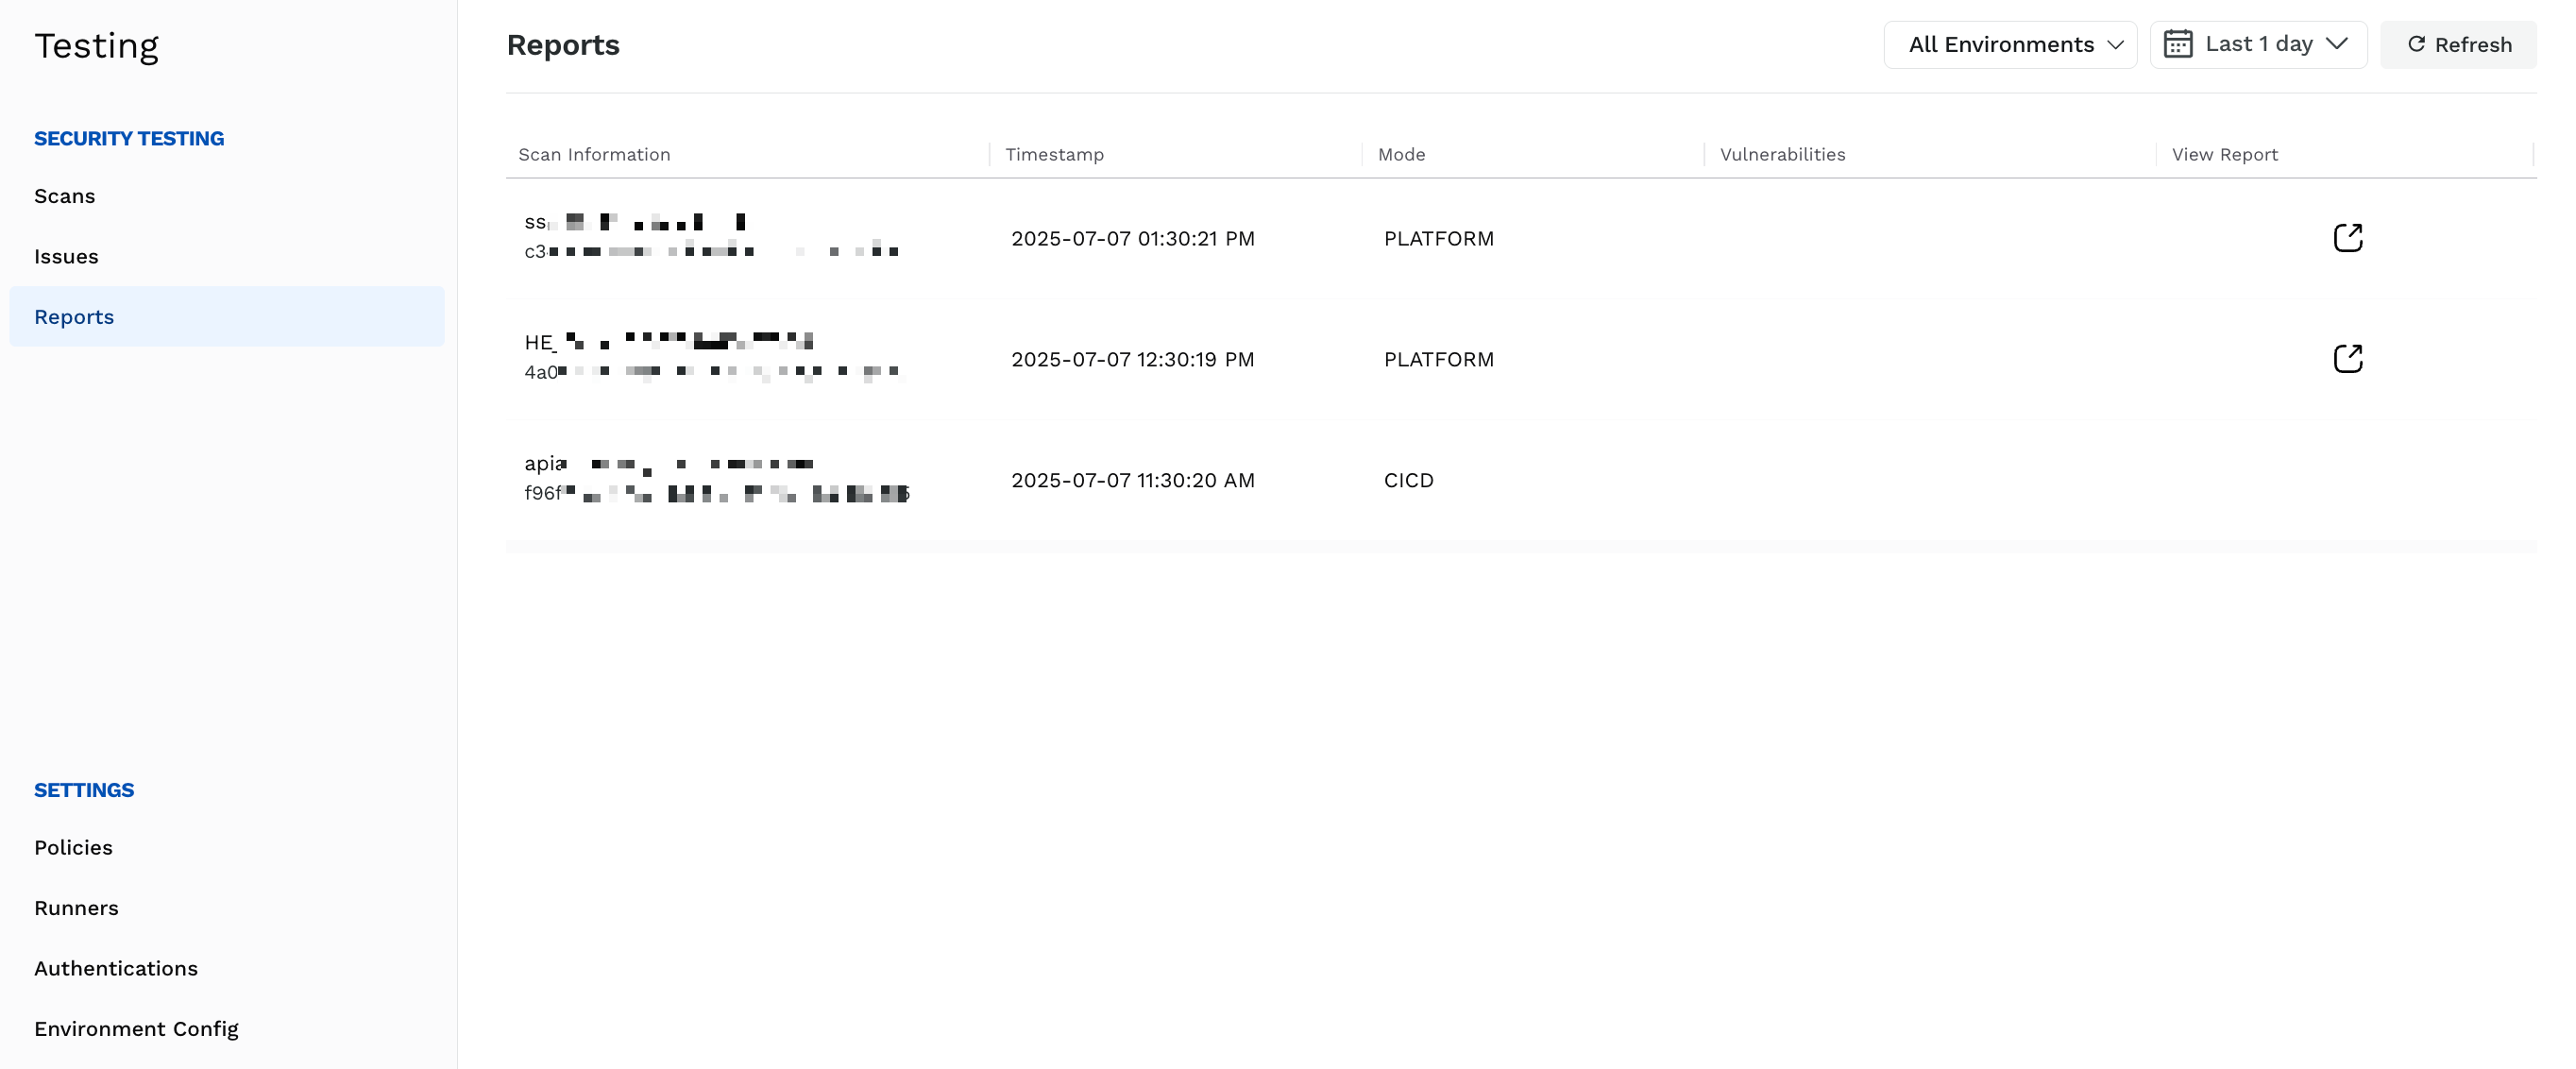
The Reports page lists summaries of all scans across environments. While Traceable shows reports for scans completed across All Environments in the Last 1 day, you can change from the top of the page according to your requirements.
Reports
For each report, Traceable shows the following information on the page:
Column | Description |
|---|---|
Scan Information | The scan name and scan ID. |
Timestamp | The date and time when the scan was last run. |
Mode | Shows if the scan was set up using the CLI or the platform. |
Vulnerabilities | Shows a color-coded bar indicating the number of vulnerabilities detected across severity levels (Low, Medium, High, and Critical). |
View Report | Shows an icon that you can click to view the report details in a new tab. For information on the details shown in each report, see Viewing a Scan Report. |
Viewing a Scan Report
After a scan is completed, Traceable displays its report on the Reports page. You can access the detailed report for your scan by clicking the icon in the View Report column. These reports help you understand what was scanned, which vulnerabilities were detected, analyze, and take the necessary actions to remediate the detected issues.
Report Details
Understanding Scan Context and Setup
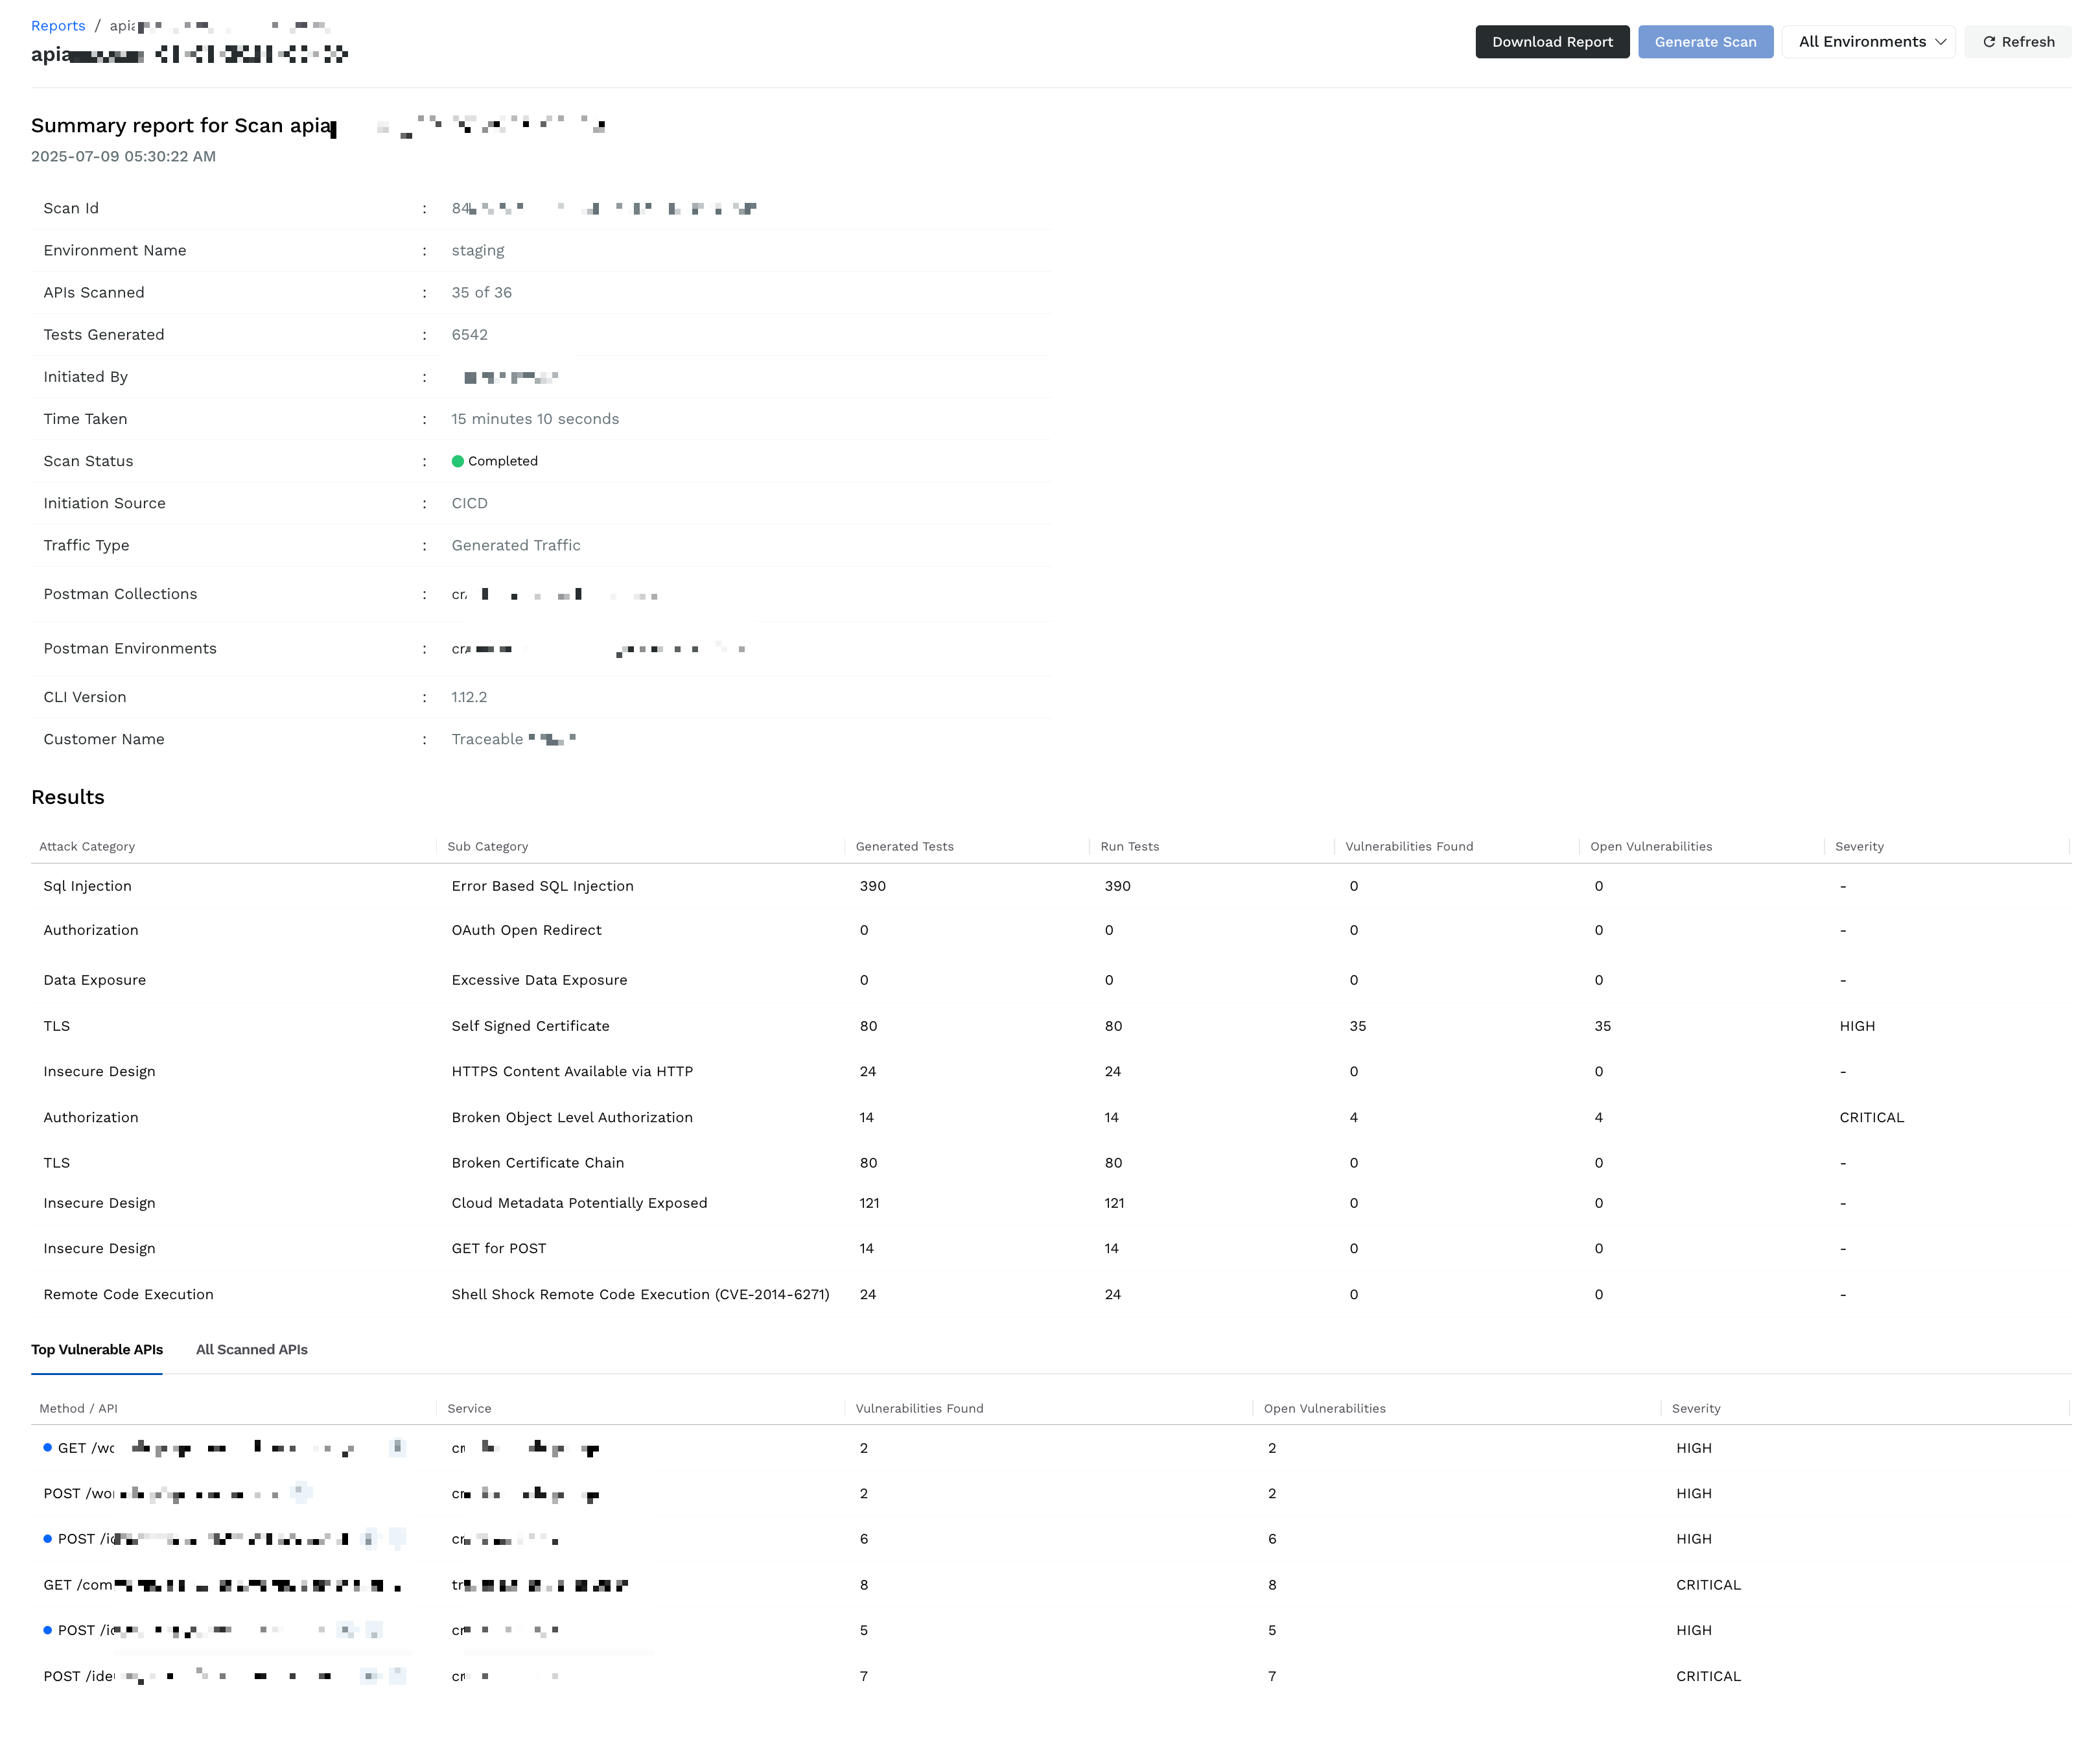
When you view a report, the Summary section of the report provides the following details on scan context:
Scope and Context — The Environment, Traffic Type, Specs (if any), and the number of APIs scanned help you determine whether the scan scope was accurate.
Initiation — The Initiated By, Initiation Source, and CLI Version (if applicable) details help you trace and audit who triggered the scan and how.
Execution — The Tests Generated, Time Taken, and Scan Status help you determine the scan performance and reliability.
Understanding Results
The Results table provides a breakdown of security tests performed and the vulnerabilities (issues) detected in them. The following table explains the columns in the Results section and their purpose:
Column | Purpose |
|---|---|
Attack Category/Sub Category | It helps you understand the attacks carried out on the API endpoints as part of the scan, such as Weak Password and JWT Token Expiry. |
Generated Tests/Run Tests | It helps you understand the scan coverage and validate its effectiveness in testing your APIs for issues. |
Vulnerabilities Found/Open Vulnerabilities | It helps you understand the total issues detected as part of the above tests and unresolved issues among the ones detected. You can take the necessary actions to remediate the open vulnerabilities. |
Severity | It helps you understand and prioritize issue resolution based on its impact on your application. |
Below this table, Traceable also shows a list of endpoints that are most at risk and all APIs scanned as part of the test.
Top Vulnerable APIs
The following table explains the columns in the list of Top Vulnerable APIs and their purpose:
Column | Purpose |
|---|---|
Method/API | It helps you understand the endpoints where Traceable detected vulnerabilities (issues). |
Service | It helps you understand the associated services to involve the accurate teams for remediation. |
Vulnerabilities Found/Open Vulnerabilities | It helps you understand the risks associated with the endpoint. You can You can take the necessary actions to remediate the open vulnerabilities. |
Severity | It helps you understand and prioritize issue resolution based on the endpoint’s business impact. |
All Scanned APIs
The following table explains the columns in the list of All Scanned APIs and their purpose:
Column | Purpose |
|---|---|
Method/API | It helps you understand the endpoints tested as part of the scan. |
Service | It helps you understand the services associated with the endpoints. |
Completed Tests/Generated Tests | It helps you understand the scan coverage and validate its effectiveness in testing an API. |
Leveraging Results
Consider a scenario where you are a security engineer and are reviewing results from a scan. In the Results table, you see that:
Under the TLS Attack Category and TLS Not Implemented Sub Category, you identify that 134 tests were executed, 34 vulnerabilities are open, having Critical severity.
To understand the impact of the vulnerability, you scroll down to the Top Vulnerable APIs section and identify that the POST /workshop/api/shop/apply_coupon is flagged with 6 vulnerabilities, including one related to the same sub-category.
With this information, you can assign remediation tasks to the relevant teams, provide the relevant test evidence, and prioritize remediation based on business impact.
Report Actions
Traceable provides the following actions that you can carry out in a report:
Download Report — Download the report for offline analysis.
Generate Scan — Select a specific Environment from the drop-down and generate a new scan. During generation, you can also select an existing policy or create a new one according to your requirements.