Traceable's Python tracing agent is a lightweight, in-app agent designed to monitor and collect telemetry data from Python applications seamlessly. It captures detailed information about incoming requests, application behavior, and API interactions within your Python application. This data is then sent to the Traceable platform agent, which processes it and forwards it to Traceable's SaaS platform for advanced analysis and actionable insights.
This documentation provides a comprehensive guide to deploying, verifying, troubleshooting, upgrading, and uninstalling the Python tracing agent to ensure seamless integration and operation in your environment.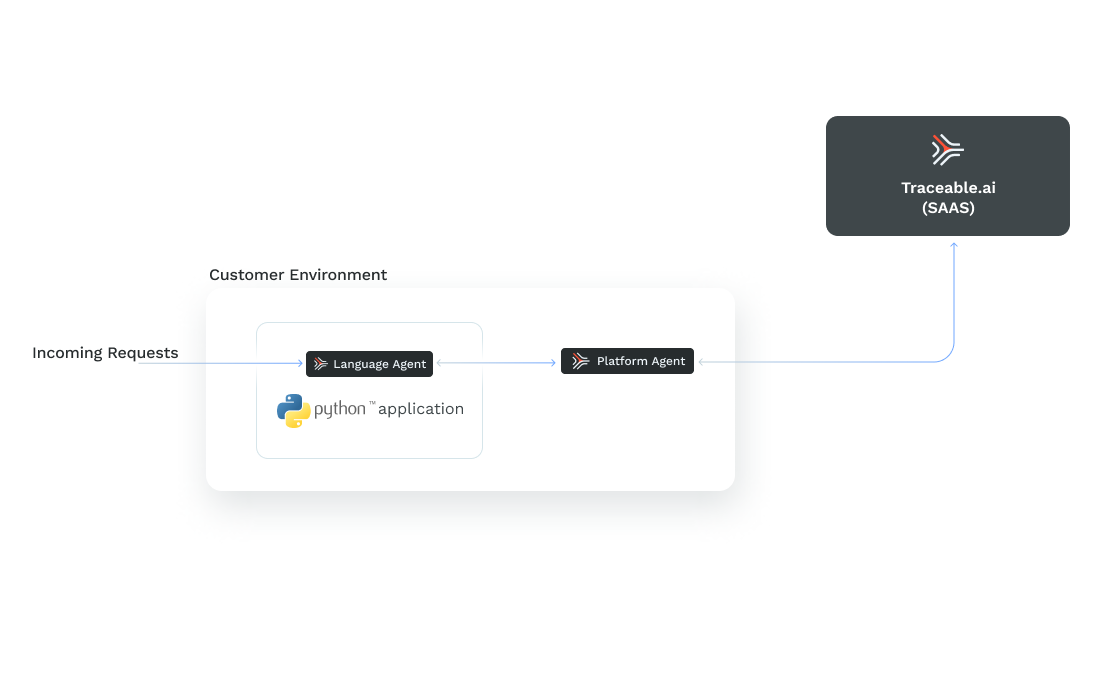
The flow is as follows:
Incoming Requests are intercepted by the Python tracing agent embedded in your application.
Traced data is sent from the Language Agent to the Platform Agent within your environment.
The Platform Agent sends this enriched data to Traceable's SaaS platform for further analysis.
Before you begin
Make a note of the following points before you proceed with the deployment:
Make sure that Traceable's platform agent is already installed. For more information, see Platform agent.
Note the address of the platform agent, as it is configured as an endpoint in the deployment process.
Choose a service name by which you would like your Python application to be identified in the Traceable platform.
Traceable supports Python 3.6+
Support for request blocking
Traceable provides request-blocking support on the following operating system versions. You can install the Traceable Python agent on other operating systems and continue to collect telemetry data. However, request blocking is not supported on any other operating system.
Debian 10+
Ubuntu 18.04+
Amazon Linux 2+
CentOS 7+
Alpine 3.9 and later - While using Traceable's Python agent on Alpine, make sure to install two additional system dependencies as mentioned below:
ActionScript
apk add --no-cache build-base linux-headers
Support Matrix
Module/Framework | Description | Python Versions Tested/Supported |
A micro web framework. | 1.* and 2.* | |
A python web framework. | 1.10 and later | |
Python GRPC library. | 1.27 and later | |
Python MySQL database client library. | 8.* | |
Python Postgresql database client library. | 2.7.3.1 and later | |
Python HTTP client library. | 2.* | |
Python async HTTP client library. | 3.* |
Deployment process
The Python agent deployment process has three parts:
Installation: Install Python tracing agent using pip.
Configuration: Configuration can be done using one of the following options:
YAML
Environment variable
Code-based
Instrumentation: You can instrument the Python tracing agent using one of the two instrumentation options:
Auto instrumentation - Auto Instrumentation option requires zero code for installation.
Manual instrumentation - The manual instrumentation option requires minimal code for installation.
Traceable recommends using Auto instrumentation for most cases because it keeps the instrumentation logic and your application logic separate. However, if you want more granular control over how the Python agent gets initialized, you can choose the manual installation method.
Installation
You can install Traceable's Python tracing agent using pip. Enter the following command:
pip install traceable-agentThe pre-compiled blocking module installation is dependent on the supported operating system version.
Configuration
Option 1: YAML
Create a file named config.yaml with a service_name. The python application is identified by the service_name in the Traceable Dashboard. Following is a sample config.yaml file. Change the endpoint configuration to point to your deployed Traceable platform agent.
# Observability Configuration
service_name: "blocking-python-svc"
reporting:
  endpoint: http://agent.traceableai:4317 # update to point to your deployed traceable-agent
# Blocking Configuration
opa:
  endpoint: http://agent.traceableai:8181 # update to point to your deployed traceable-agent
blocking_config:
  enabled: false
  remote_config:
    endpoint: agent.traceableai:5441 # update to point to your deployed traceable-agent
In the above config.yaml, the blocking_config is set as false. If you wish to enable blocking, set blocking_config as true and restart your application
Initialize an environment variable which points to the location of the configuration file. This environment variable will be automatically detected by the Traceable python agent.
export TA_CONFIG_FILE=./config.yamlIf you have a django app deployed in gunicorn, set the following environment variable:
export DJANGO_SETTINGS_MODULE="<project-name>.settings"Option 2: Environment variables
Following is a list of environment variables that you can configure.
Environment variables take precedence over values set in config.yaml file.
export TA_SERVICE_NAME="example-service-name"
export TA_REPORTING_ENDPOINT="<http://hostname:4317>"
export TA_REPORTING_TRACE_REPORTER_TYPE="OTLP"
export TA_BLOCKING_CONFIG_ENABLED=true
export TA_BLOCKING_CONFIG_EVALUATE_BODY=true
export TA_BLOCKING_CONFIG_MODSECURITY_ENABLED=TRUE
export TA_OPA_ENDPOINT=http://agent.traceableai:8181
export TA_BLOCKING_CONFIG_REMOTE_CONFIG_ENDPOINT=agent.traceableai:5441
If you have a django app deployed in gunicorn, set the following environment variable:
export DJANGO_SETTINGS_MODULE="<project-name>.settings"See manual instrumentation for further details.
Auto Instrumentation
To auto-instrument your application with Traceable's tracing agent, prefix your startup command with traceableai-instrument. For example:
Python
For Python, enter the following command:
traceableai-instrument python app.pyflask CLI
If you are using flask CLI, enter the following command:
traceableai-instrument flask runIf you are using a config.yaml, you can set the config file as follows:
TA_CONFIG_FILE=./config.yaml traceableai-instrument flask rungunicorn
If you are using gunicorn, you can prepend your gunicorn startup command. For example:
traceableai-instrument gunicorn --workers=2 test:appAuto instrumentation with pre-fork Web servers
If you are using gunicorn or other pre-fork Web servers, then as per a known limitation of a deadlock, Python 3.6 spans are not exported. Make a note of the following:
If you are using Python 3.7 or later, forked Web server is also instrumented automatically.
If you are using Python 3.6, the following is a gunicorn example. Add the following code snippet to the gunicorn configuration file, or create one if you are not already using a configuration file.
ActionScript
# gunicorn_config.py
import traceableai

def post_fork(server, worker):
    traceableai.post_fork(server, worker)
Next, reference the configuration file in your gunicorn launch command, for example:
ActionScript
traceableai-instrument gunicorn -w 5 -b 0.0.0.0:5000 wsgi:app -c gunicorn_config.py
Manual Instrumentation
To use manual instrumentation, you have to make some modifications to your application's entry file. For example:
from traceableai.agent import Agent

...

agent = Agent() # initialize the agent
# .instrument() will instrument all available libraries
agent.instrument()

# if you are using flask, you must pass your app instance to the instrument call
agent.instrument(your_flask_app)
agent.add_traceable_filter() # Adds the traceableai blocking filter
...
Startup
Start your application by entering the following command:
python app.pyOr, if you are using the flask CLI, then enter the following command:
flask runTroubleshooting
If you do not see any data in Traceable's platform after a few minutes:
Make sure that there is load on the instrumented Python application.
Check whether Traceable's platform agent has the correct agent token configured. You can copy the agent token by logging into your Traceable platform and navigating to Settings → Account → Agent token.
Check the Traceable platform agent logs for any connectivity issues or errors. You can view the logs by navigating to
/var/traceable/log/.Check the Python tracing agent logs for any connectivity issues or errors. You will have to change the log level to
DEBUGby setting,ENV TA_LOG_LEVEL DEBUG, and restarting the application. For example, in the case of a K8s application, you can configure this in thedockerfile.
If you need further assistance, reach out to Traceable support.
Upgrade
Enter the following command to upgrade to the latest version of Traceable's tracing agentx. Make sure that the current configuration files and environment variables are not changed before you run the upgrade command:
pip install traceable-agent --upgradeUninstall
To uninstall the tracing agent, enter the following command:
pip uninstall traceable-agent