In Traceable, API Security Testing (AST) is facilitated through Scans, which help identify vulnerabilities in your APIs. Scans simulate real-world attack scenarios using different traffic types and evaluate your APIs for potential security weaknesses. Traceable utilizes a collection of predefined security tests and customizable ones to actively test your APIs and identify issues before attackers can exploit them. Scans offer flexible configurations and detailed scan results that you can utilize to ensure your APIs remain secure over time.
What will you learn in this topic?
By the end of this topic, you will understand:
What are Scans, and how do they help improve API security posture
What details are required to create a scan
What details are shown on the Scans page in the Traceable platform
What are the available traffic types, and when to use each type based on your use case
What are scans, and how are they helpful?
Scans in Traceable are targeted, policy-driven security tests that actively evaluate and inspect your APIs for vulnerabilities. You can set the scans up and run them on demand or schedule them to run at regular intervals. Scans use real-time, replayed, or simulated traffic to inspect your API endpoints under various conditions and reveal weaknesses in your APIs.
Scans help you:
Set up centralized testing for endpoints under a common set of configurations.
Execute repeatable tests based on the defined policies.
Automate security testing by scheduling scans to reduce manual effort.
Track and analyze the detected issues (vulnerabilities) and overall security of your APIs through the scan details.
Each scan execution (called Scan Run) lists the details, logs, API coverage metrics, and detected issues, allowing you to trace each run, analyze it, and refine the security of your APIs according to your requirements.
How do you configure scans?
To set up a scan in Traceable, you specify the following key components:
Basic Details — Specify the scan name and select the environment to test APIs.
Schedule (optional) — Run once, or configure scans to run repeatedly at a specific frequency.
Traffic Type — Select the type of traffic Traceable should use to test the APIs. For more information, see Traffic Types.
Targeted Assets — Select the API endpoints you wish to test.
Policy or Attack Set — Select the vulnerability categories or attacks you wish to test the endpoints against.
Note
Traceable requires an active runner to execute scans. A runner is Traceable CLI installed on your machine or server that runs the scan based on your configuration. Each runner can execute one scan at a time. You must ensure that you have at least one runner set up and active before you create a scan. You can install a runner using Docker, Scripts, Helm charts, or cloud templates like CloudFormation and Terraform. For more information, see Runners.
For the detailed steps on creating a scan, see Creating a Scan. Once you create the scan, each execution (called a Scan Run) tests your API endpoints against the configured settings and displays detailed results in a comprehensive dashboard. For more information on the details shown for a scan, see Scan Details.
Understanding the Scans User Interface
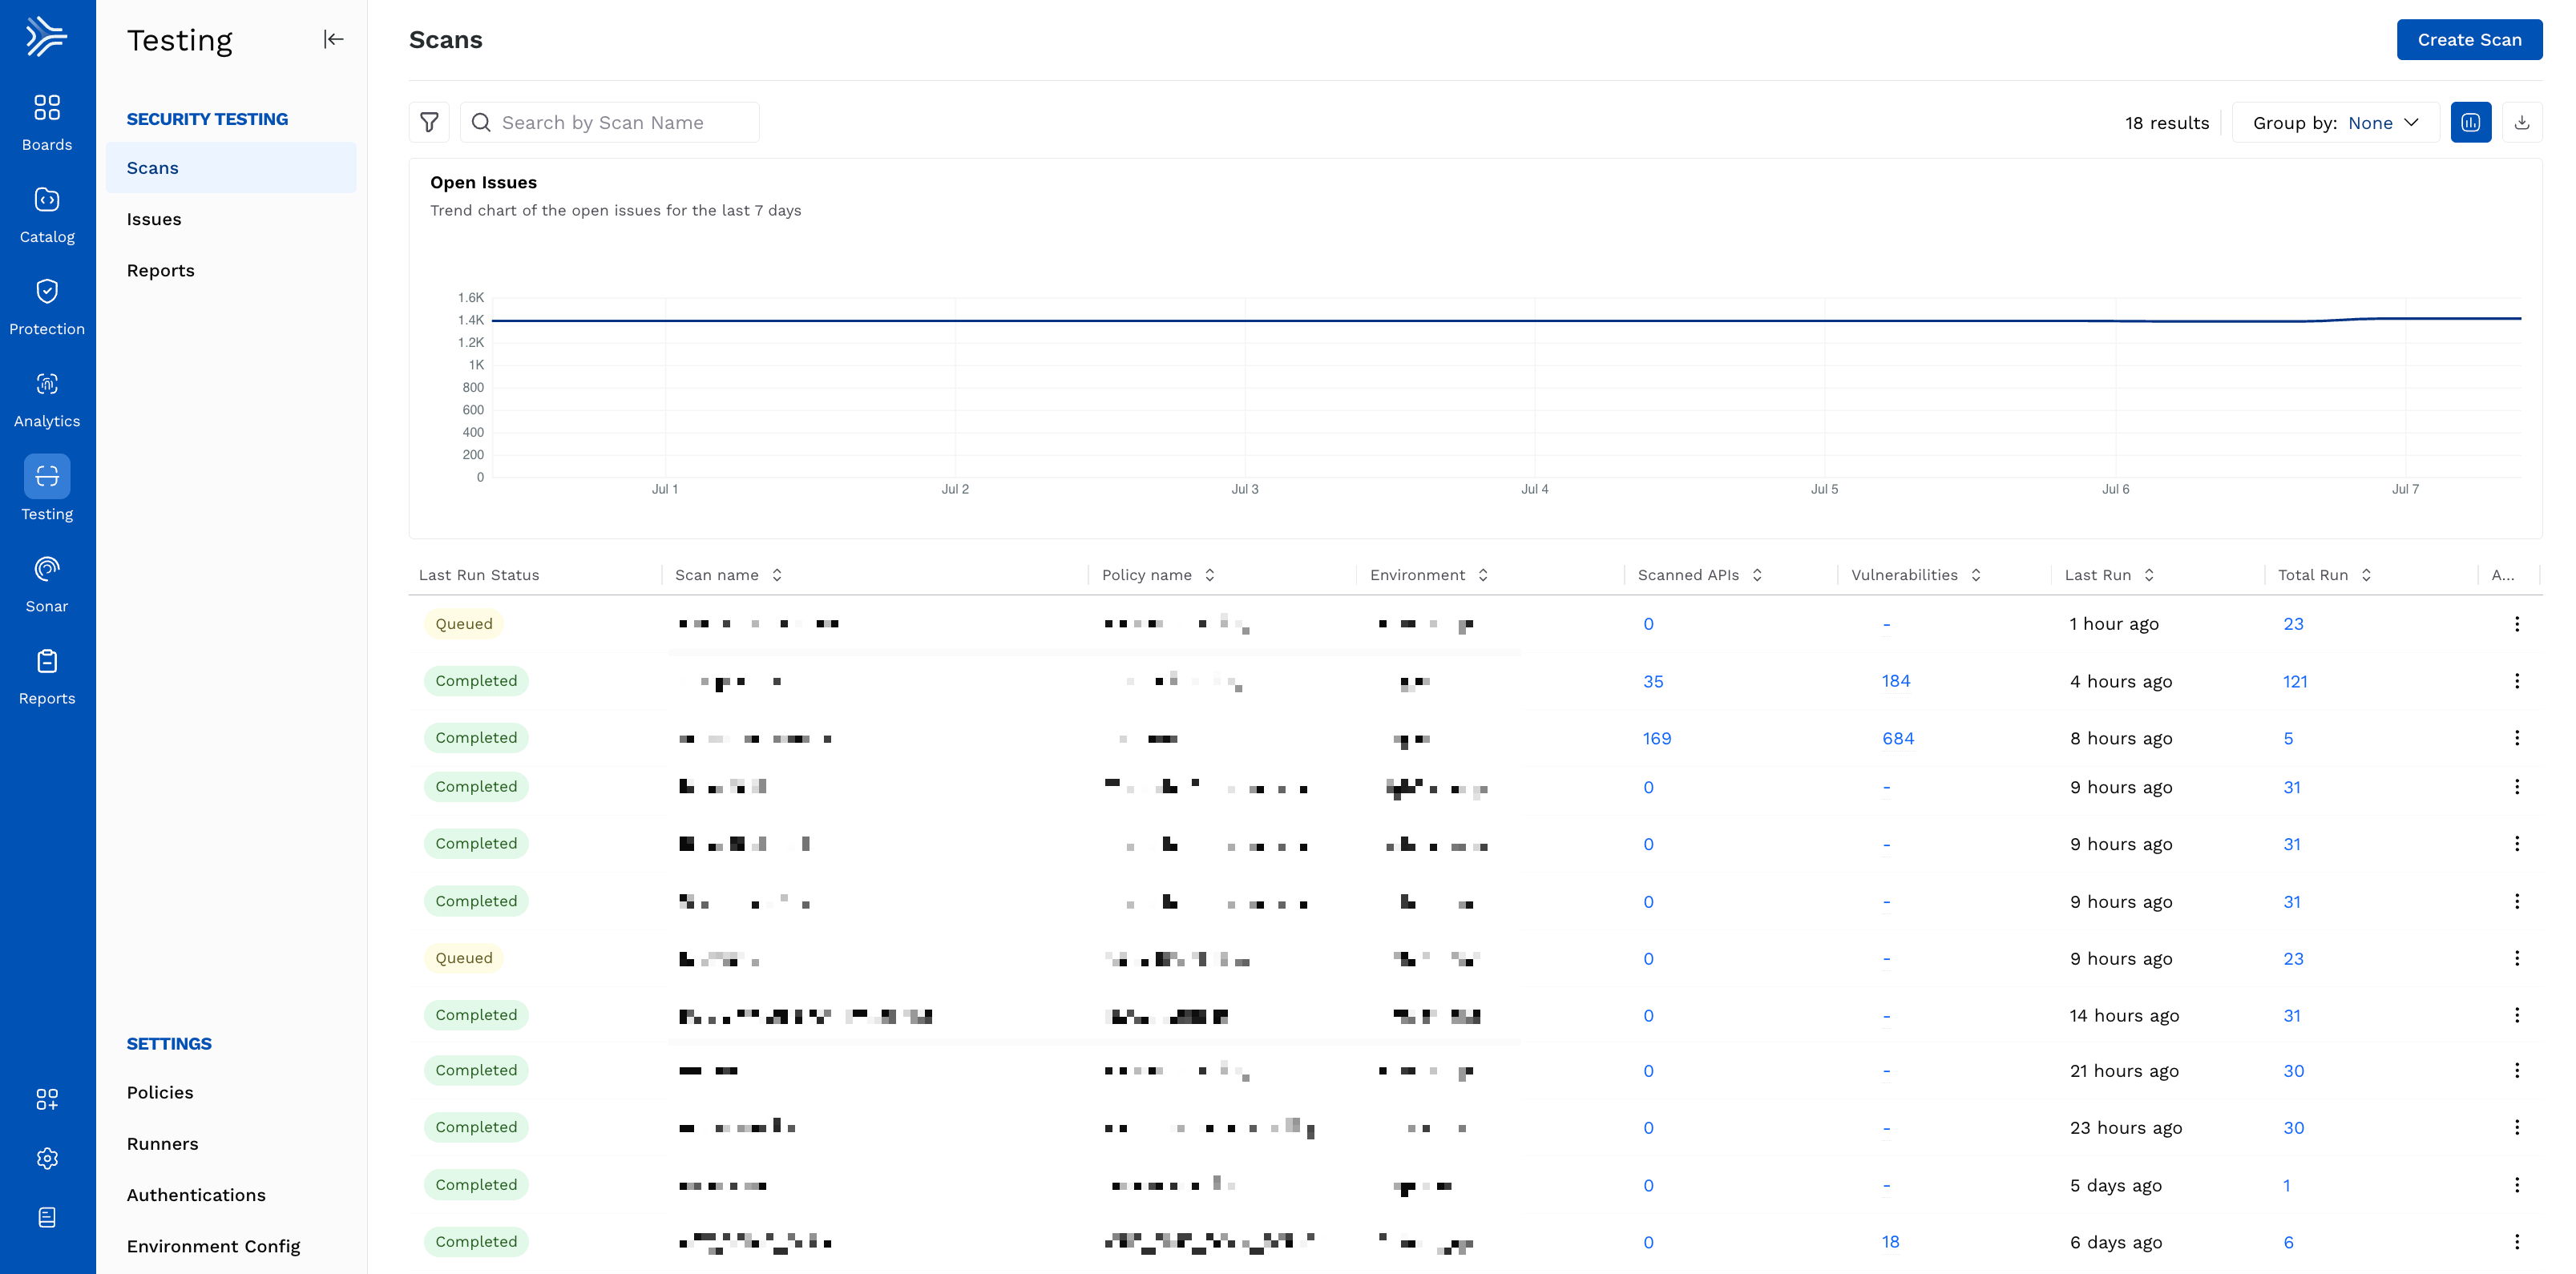
The Scans page provides a summarized view of all scans configured in your account, along with their details. This page helps you monitor the status of scans by displaying important information for each scan in a structured layout.
Scans Layout
The following are some of the key elements visible on the page:
Scans Table — Displays the following details for each scan:
Status — The scan indicator to show if the scan has been completed successfully (green dot) or aborted (red dot).
Scan Name — The name of the scan you specified during creation. You can click the name to view detailed information for the scan. For more information, see Scan Details.
Policy Name — The policy name associated with the scan.
Environment — The environment associated with the scan.
Note
Scans are environment-specific.
Scanned APIs — The number of APIs scanned. You can also click this number to view details about API coverage.
Vulnerabilities — The number of vulnerabilities (issues) identified as part of the scan. You can also click this number to view the list of issues.
Last Run — Shows when the scan was last executed. You can also hover over the value to view the exact date and time for the last scan run.
Total Run — The number of times Traceable has executed the scan post-creation.
Actions (Ellipse icon) — Provides the option to permanently delete the scan.
Note
Scans once deleted cannot be restored.
Search bar — Locate a scan by typing its name.
Filter icon — Apply filters to view scans by Policy, Environment, or Status. After applying, you can also save the filter for future use. The saved filters are visible under Filter → Saved tab.
Visualization toggle — Show or hide the chart highlighting open issues over the past 7 days.
Group By drop-down — Organize scans shown on the page based on their associated Policy, Environment, or view them ungrouped (None).
Download icon — Download the list of scans for offline analysis.
Traffic Types: XAST Live, XAST Replay, DAST, and DAST Web
The creation of a scan is based on the choice of traffic from XAST Live, XAST Replay, DAST, and DAST Web. The table below lists the comparison between these traffic types:
XAST Live | XAST Replay | DAST | DAST Web |
|---|---|---|---|
It uses live traffic in real-time to run the scan. | It uses past traffic to run the scan. | It generates traffic based on the examples provided in the specifications. | It crawls the web application and generates traffic for both frontend and backend APIs. |
It uses Traceable-generated specifications for accuracy and coverage per API. | It uses Traceable-generated specifications for accuracy and coverage per API. | It uses the API specification you provide for accuracy and coverage per API. | It uses the user interface flow and crawls through it to identify the underlying APIs. |
It runs context-sensitive targeted tests using a real-time monitoring and analysis approach. | It runs context-sensitive targeted tests using the historical traffic analysis and replay approach. | It runs simulated attacks on applications using the black-box testing approach. | It performs black-box testing by simulating real user interactions with the web application. |
It does not scan if no traffic is present in an API. | It scans selected APIs/assets if there is any traffic in the past. | It scans all APIs irrespective of traffic. | It scans APIs discovered through real user interaction simulation. |
It has the most penetration power due to context relevance from real traffic. | It has lesser penetration power than XAST Live but more than DAST, as some data may have lost relevance with time. | When Postman is collection-based, it has the same penetration power as XAST Live. When Open API-based, it has the least penetration power if the examples provided are invalid. | It provides deep penetration for APIs invoked via the user workflows in the browser. |
It has lesser coverage than XAST replay but more than DAST, as it uses live traffic. | It has the most coverage as it uses historical traffic. | It has the least coverage because of its black-box nature. | It has high coverage for APIs invoked via browsers, but may not cover the ones that are not invoked via the user interface. |
It does not require a separate authentication hook setup. | It may or may not require an authentication hook setup. | It requires an authentication hook setup. | It requires an authentication setup to simulate user login, maintain the session, and crawl through the web application. |