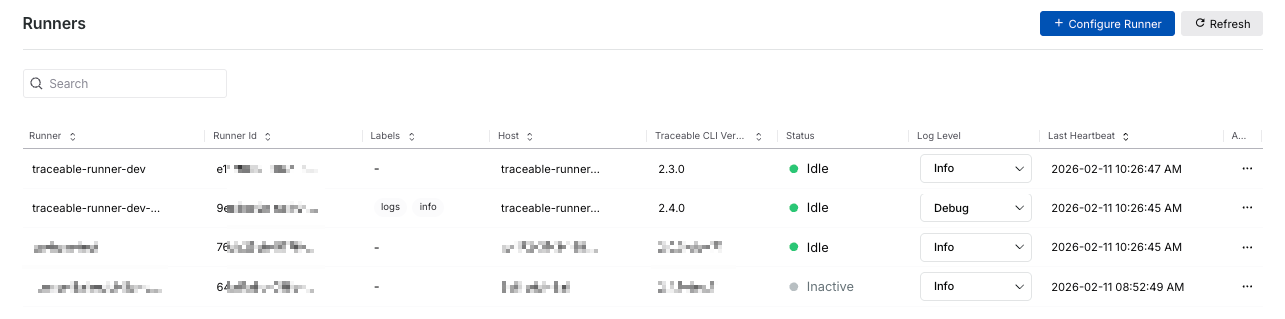
The Runners dashboard provides a centralized view of all runners configured in Traceable, regardless of environment. It helps you monitor runner availability, understand the current execution status, and verify configuration details, ensuring scans are routed and executed as expected. Traceable displays the following information on the Runners page:
Runner Dashboard
Runner — The name you used while configuring the runner. For example, SampleRunner in the above screenshot.
Note
Each runner in Traceable processes one scan at a time.
Runner ID — A unique identifier for the runner instance.
Labels — The label(s) assigned to the runner. For more information, see Understanding runner labels.
Host — The host (server or URL) that the runner is targeting.
Traceable CLI Version — The CLI version associated with the runner.
Status — The current status of the runner. For example, Idle or Busy.
Log Level — The log levels currently available for the runner. For example, Info.
Last Heartbeat — The time at which the runner was last active. For example, 2024-11-12 01:32:34 PM.
You can also hover over a column and the corresponding row value and click the Copy (![]() ) icon to copy the value for use in the Traceable CLI. Traceable also allows you to remove inactive runners from the platform. For more information, see Runner actions.
) icon to copy the value for use in the Traceable CLI. Traceable also allows you to remove inactive runners from the platform. For more information, see Runner actions.
Runner monitoring and logging
The Runners dashboard provides monitoring and logging capabilities to help you understand runner health, resource usage, and execution behavior. When you select a runner from the dashboard, Traceable opens a slide-out panel with the Health Metrics and Logs, enabling you to proactively monitor and troubleshoot issues.
The Runners dashboard also includes a Log Level column, which indicates the log level for which logs are currently available for each runner. This provides you with visibility into the depth of diagnostic information available before opening the runner details.
Health metrics
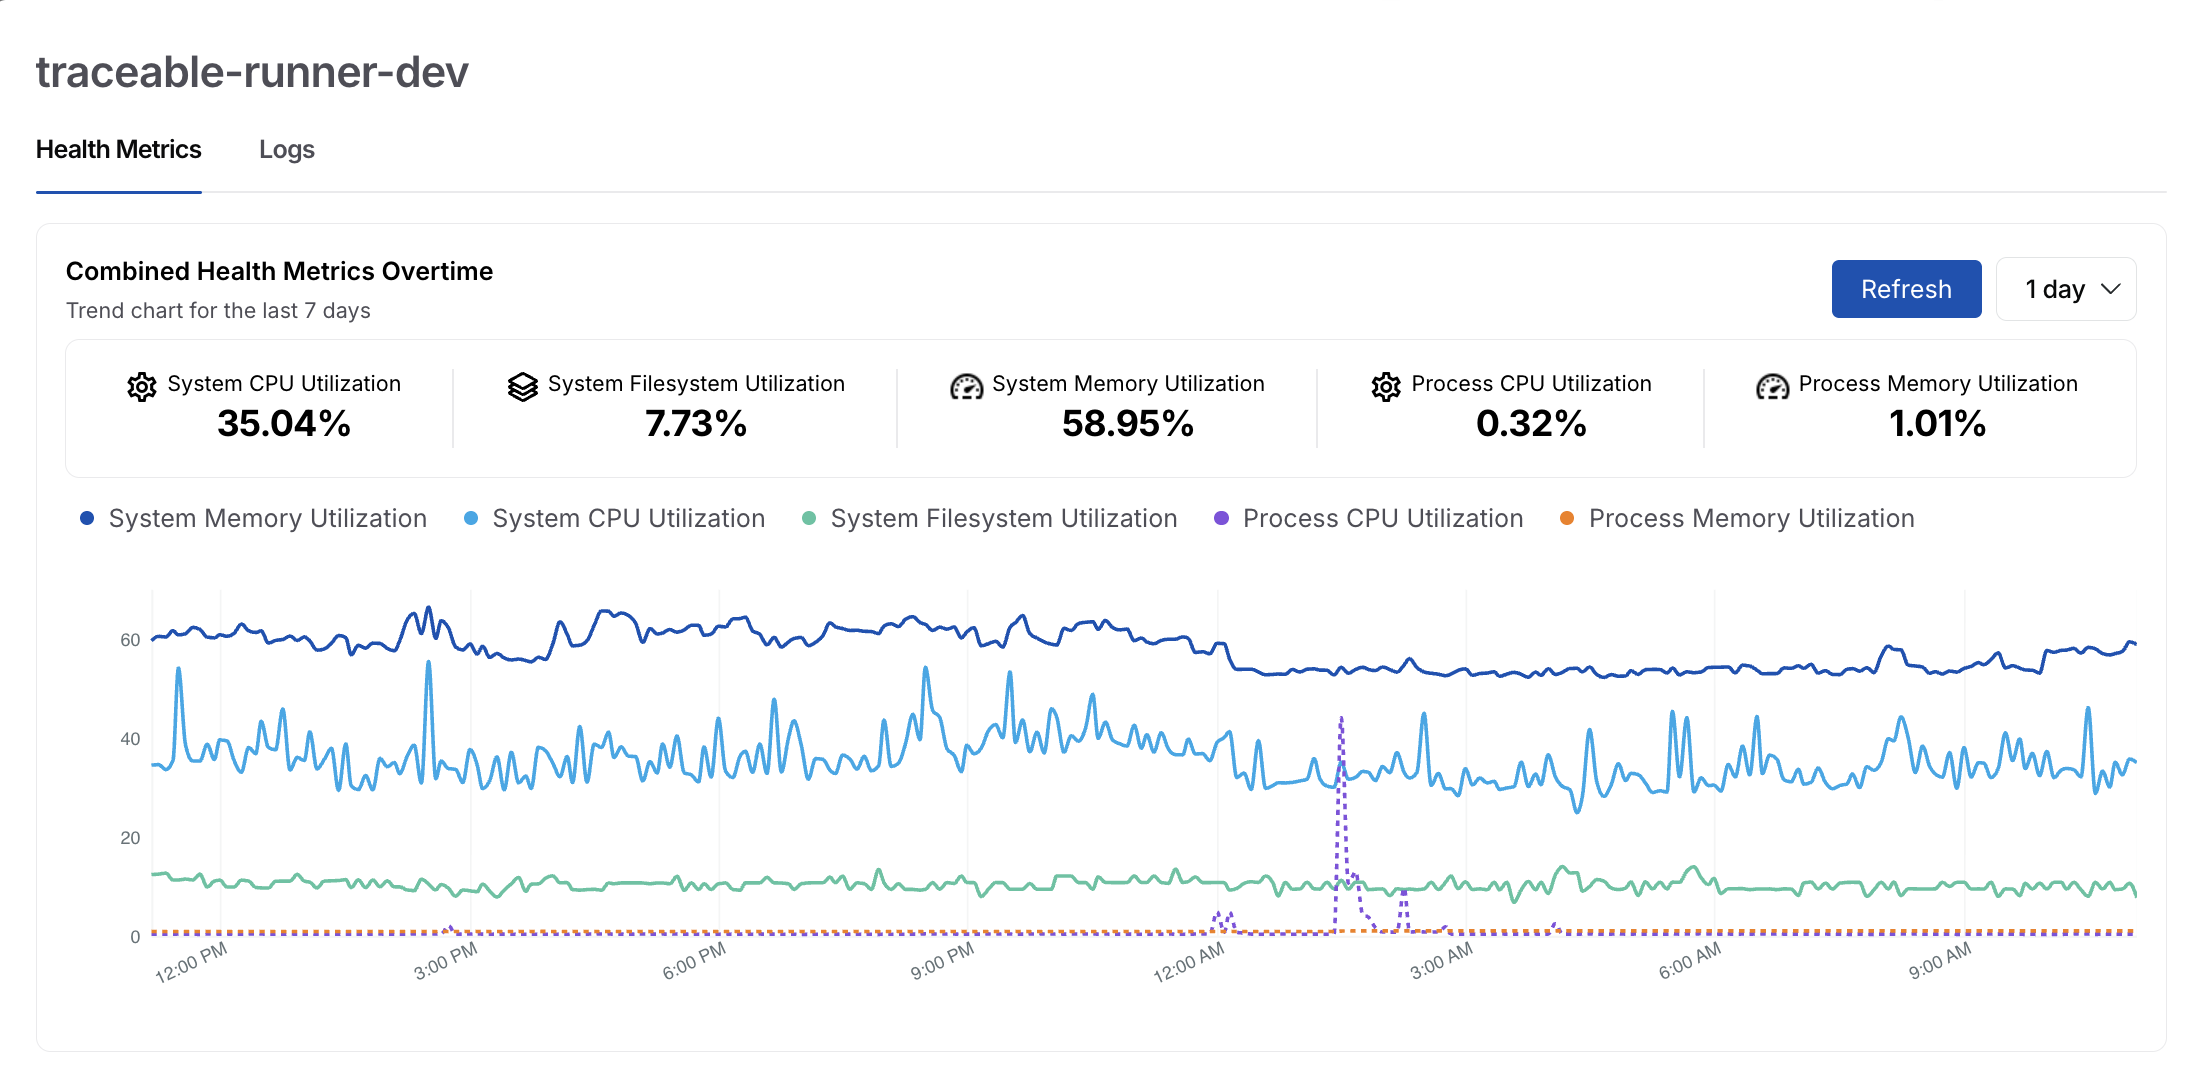
The Health Metrics tab provides near-real-time visibility into both system-level and process-level resource consumption for the selected runner. This helps you validate whether the runner has sufficient capacity and identify potential performance bottlenecks.
Runner Health Metrics
Traceable displays the following metrics:
System CPU Utilization — Displays the percentage of CPU currently used on the host. Sustained high CPU usage may indicate the host is overloaded or running multiple resource-intensive scans, slowing scan execution or causing delays.
System Filesystem Utilization — Displays the percentage of disk space consumed on the host system. Rising filesystem usage can signal accumulation of scan artifacts, logs, or temporary files, and may eventually affect runner stability if disk space becomes constrained.
System Memory Utilization — Displays the percentage of total system memory consumption. Consistent high memory usage can lead to memory pressure, increased garbage collection, or process instability during complex scans.
Process CPU Utilization — Displays CPU usage for the runner process. This helps you understand how CPU-intensive the runner itself is, independent of other processes on the host, and identify scans or plugins that demand higher compute.
Process Memory Utilization — Displays the memory usage specific to the runner process. This helps you detect memory leaks or unusually large scan workloads that could impact long-running runner performance.
In addition to current values, Traceable shows a combined health metrics trend chart over a selectable time range. This chart correlates CPU, memory, and file system utilization, allowing you to:
Understand how runner resource usage changes during scans
Identify abnormal spikes tied to specific execution windows
Validate whether resource constraints align with scan failures or delays
This historical view is particularly helpful when tuning runner sizing or investigating intermittent issues.
Logs
The Logs tab displays logs generated by the runner for the currently available log level. The available log level is reflected in the Log Level column of the Runner dashboard.
.png)
Runner Logs
Traceable displays the following log levels:
Error — Displays error logs
Warning — Displays warning and error logs
Info — Displays informational, warning, and error logs
Progress — Displays execution progress logs
Logs are displayed in time order and include details, such as timestamps, severities, and descriptive messages. This allows you to quickly isolate relevant error messages without having to scan through the complete output.
While Traceable displays 2000 log lines by default, you can download (![]() ) the logs to view up to 10000 log lines for a runner.
) the logs to view up to 10000 log lines for a runner.
Runner logs are useful for:
Debugging scan execution failures
Verifying runner connectivity and heartbeat issues
Identifying configuration or environment-related errors
Together, health metrics and logs provide a comprehensive view of runner behavior, ensuring scans are executed reliably and that issues are diagnosed promptly when they arise.
Runner actions
If a runner is no longer in use or remains Inactive, Traceable allows you to remove it from the platform. Removing inactive runners helps you:
Keep the dashboard clean and focused on the current infrastructure.
Avoid confusion caused by stale or decommissioned runner entries.
Maintain an accurate view of the available scan execution capacity.
To remove a runner, click the Ellipse (![]() ) icon corresponding to an Inactive runner and click Remove.
) icon corresponding to an Inactive runner and click Remove.
Once removed, the runner is de-listed from the platform and no longer appears in the Runners list. However, if Traceable later detects a heartbeat for the same runner instance, it is automatically displayed on the dashboard again.