Reports provide insights into your API activity, security events, and potential issues within a specific environment over a specified time period. Using these reports, you can identify security metrics, such as sensitive data, a list of threats, issues, etc. You can then use or analyze this data to make informed decisions for improving the security of your application.
Reports
Navigating the Reports page
You can view the Reports page in your Traceable account by navigating to Insights → Reports.
Data visible on the page
By default, Traceable lists the reports for all environments. However, you can select the desired environment from the Environments drop-down in the page’s top right corner. You can also create reports according to your requirements. Traceable provides pre-defined templates from the following areas of the product for generating reports:
Discovery
Sensitive Data — This lists any sensitive data flowing through the APIs (internal or external) in your application system. For more information, see Sensitive data.
API Inventory — This lists the APIs (internal or external) in your application system. For more information, see Inventory.
Vulnerabilities — This lists the issues that Traceable has detected in your APIs. For more information, see Issues.
Discovery Change Insights — This lists any inventory or issue changes in your application system.
Protection
Threats and Events — This lists any threat activity that Traceable has detected in your application system. For more information, see Threat Activity.
API security testing (AST)
API Security Testing — This lists the details for the last scan that Traceable executed on your environment. For example, if you have five scans running weekly, the report is generated for the latest available scan. For more information, see Scan Details.
You can choose one of the above templates and configure a report. For the configuration steps, see Create a report.
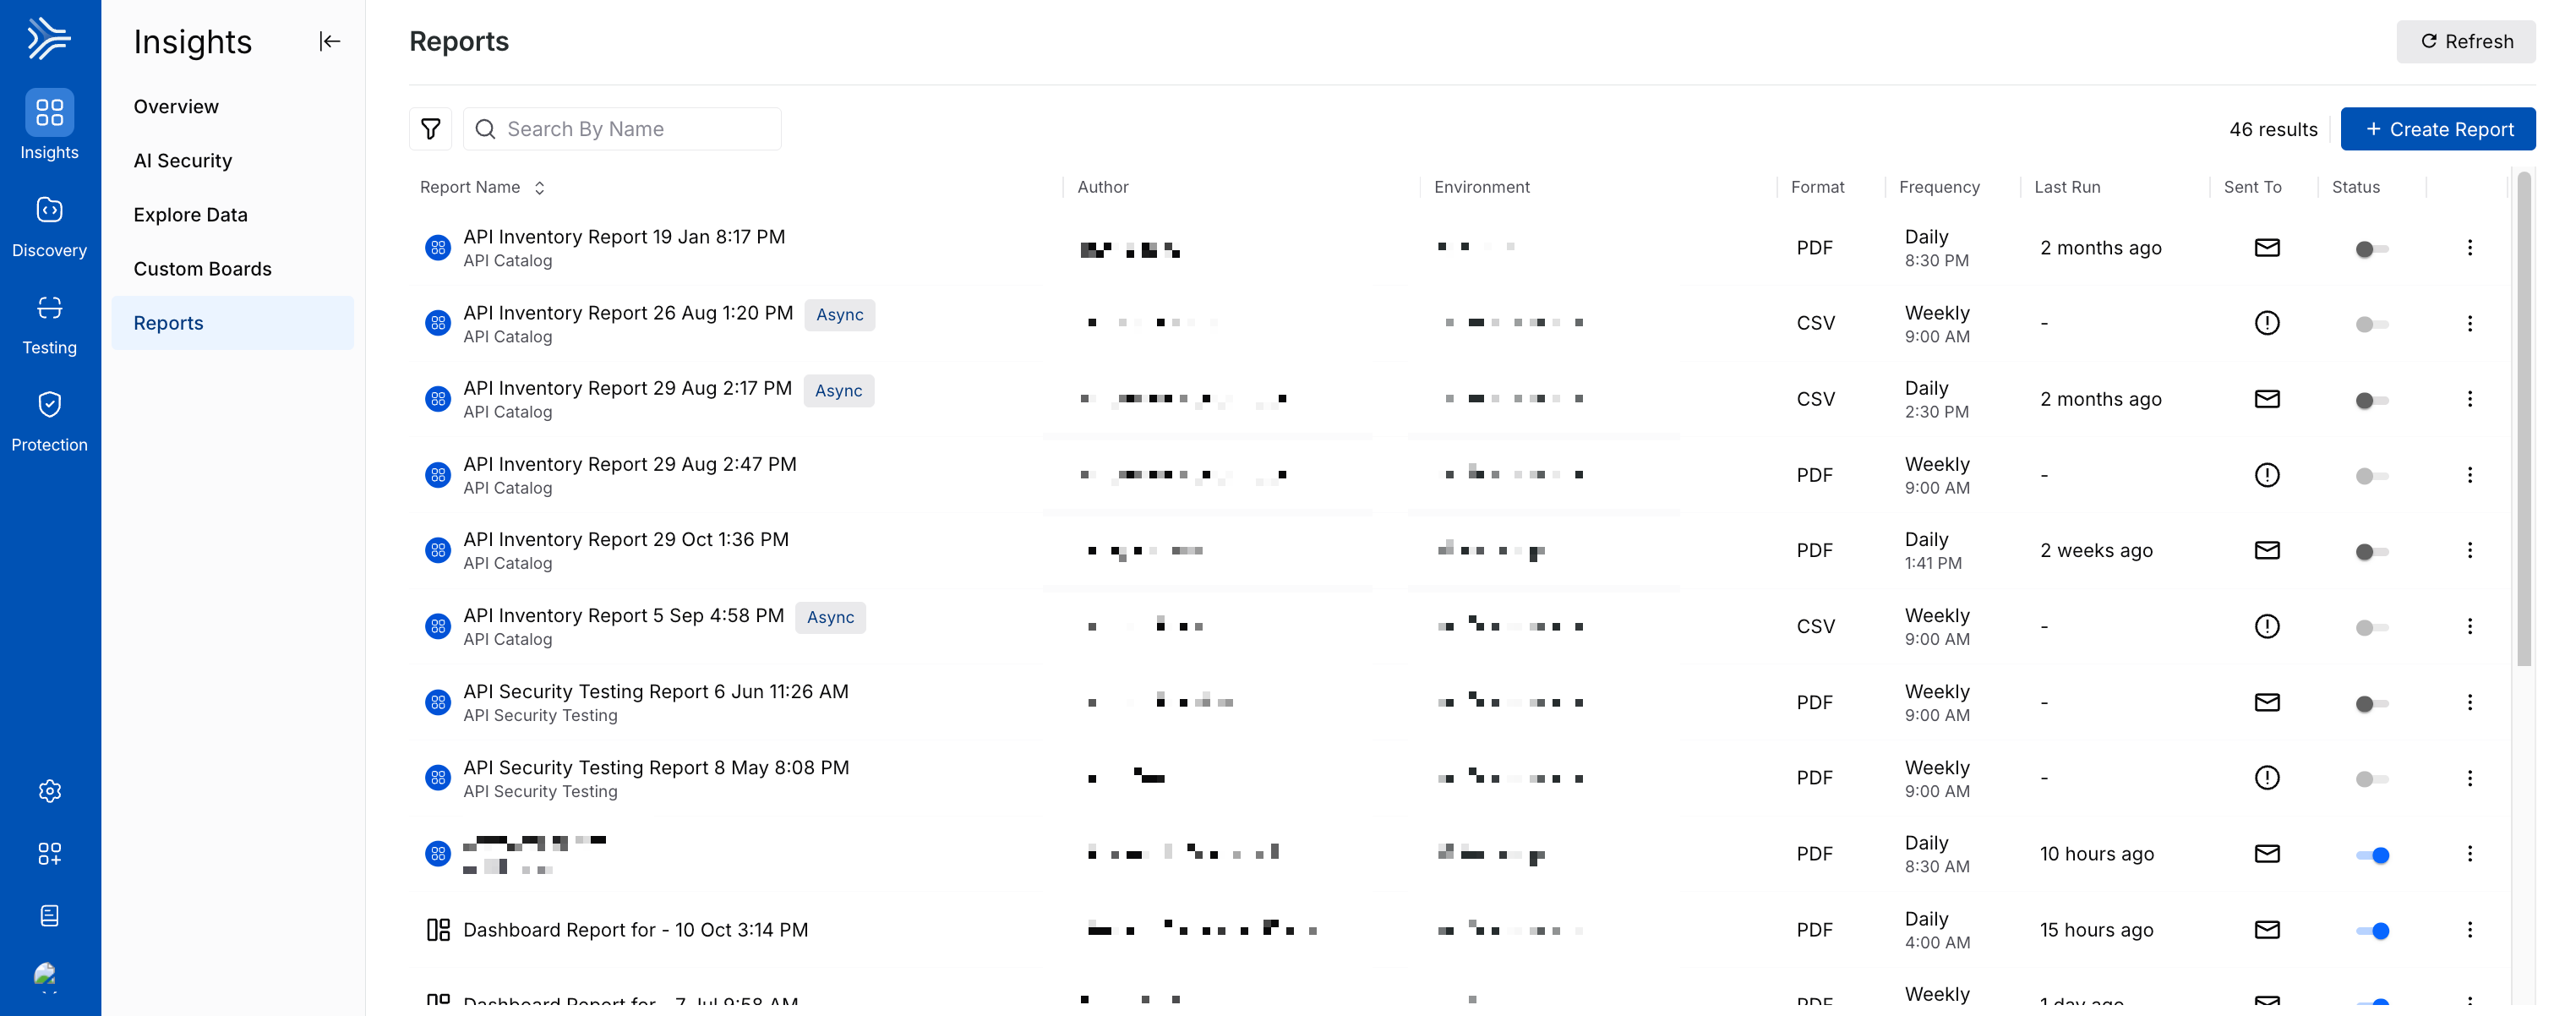
Once you create a report, Traceable shows it on the Reports page. On this page, you can view the following:
The Name of the report.
The name of the person who created the report.
The Environment for which Traceable generates the report.
The format in which Traceable generates the report.
The frequency at which Traceable generates the report.
The time at which Traceable last generated the report.
The email address(es) to which Traceable sends the report. The Exclamation (
 ) icon denotes that an email recipient is not configured. To configure this, you can edit the policy. For more information, see Actions on Reports.
The status of the report. A disabled toggle means Traceable does not generate the report according to the configured frequency. However, you can always navigate to the reports page and see the Live View.
For information on additional actions, see Actions on Reports.
Create a Report
Creating a report involves the following four steps:
Navigate to the Reports section and click + Create Report in the page’s top right corner to start creating a report. You can configure a report using either of the available templates according to your requirements.
Step 1 — Configurations
As part of configuring the report, you must complete the following:
Report Name — The name of the report. The report is shown on the page using this name. Additionally, Traceable uses this name as the email subject while sending the report via email.
Environment — The environment from which you want Traceable to generate the report.
Report Format — The format (PDF or CSV) in which you want Traceable to generate the report. For more information on the interactive features in the report, see Interactive Report.
Configurations (Sections) — Configure the report to display the most important information according to your requirements by selecting the relevant sections.
Title — The title of the section. Traceable uses this as the section name in the report.
Table Columns — The columns that you wish to add to the table for the corresponding section.
Filters — The filters that you wish to apply to the data shown in the section. You can apply one or more filters according to your requirements.
Number of rows to display — The maximum number of rows that you wish to view in the section.
Each section in a report serves a distinct purpose within the report. You can configure the above fields in the other sections as well, and create meaningful reports according to your requirements.
Once you have specified the above fields, click Next.
Step 2 — Scheduling
As part of scheduling the report, you must complete the following:
Enable Scheduled Report — Enable or disable the toggle to allow Traceable to send the report to your specified email address according to the frequency you select.
Note
If you enable the schedule toggle, you must specify at least one email address at which you wish to receive the report.
Set Frequency — The frequency at which you want Traceable to send the report.
Daily — The time at which you want Traceable to send the report.
Weekly — The day(s) and time at which you want Traceable to send the report.
For example, if you schedule the report for Friday at 3:30 AM, you will get the weekly report every Friday at the same time. If you schedule the report for Daily at 3:30 AM, Traceable sends you the data of the last 24 hours at the same time.
Emails — The email address(es) at which you want to receive the report.
Note
Multiple email addresses should be separated by a comma.
Traceable sends the reports using the no-reply@traceable.ai email ID. Ensure that these emails are not directed to the spam folder.
Once you have specified the above fields, click Next.
Step 3 — Review Configurations
As part of the review, you can verify the above configurations to ensure the delivery of an accurate report. If you wish to edit any configuration during the review, click the Edit (![]() ) icon corresponding to a section. Once you have reviewed the configurations, click Next.
) icon corresponding to a section. Once you have reviewed the configurations, click Next.
Step 4 — Preview
As part of the preview, Traceable shows a report sample with the configured sections. It also displays the filters applied to a section and its corresponding data.
Example
This section shows a demo for configuring a report using the API Security Testing template. You can refer to the demo below, follow similar steps for a predefined template, and create a report tailored to your requirements.
Actions on Reports
You can carry out the following actions on the report:
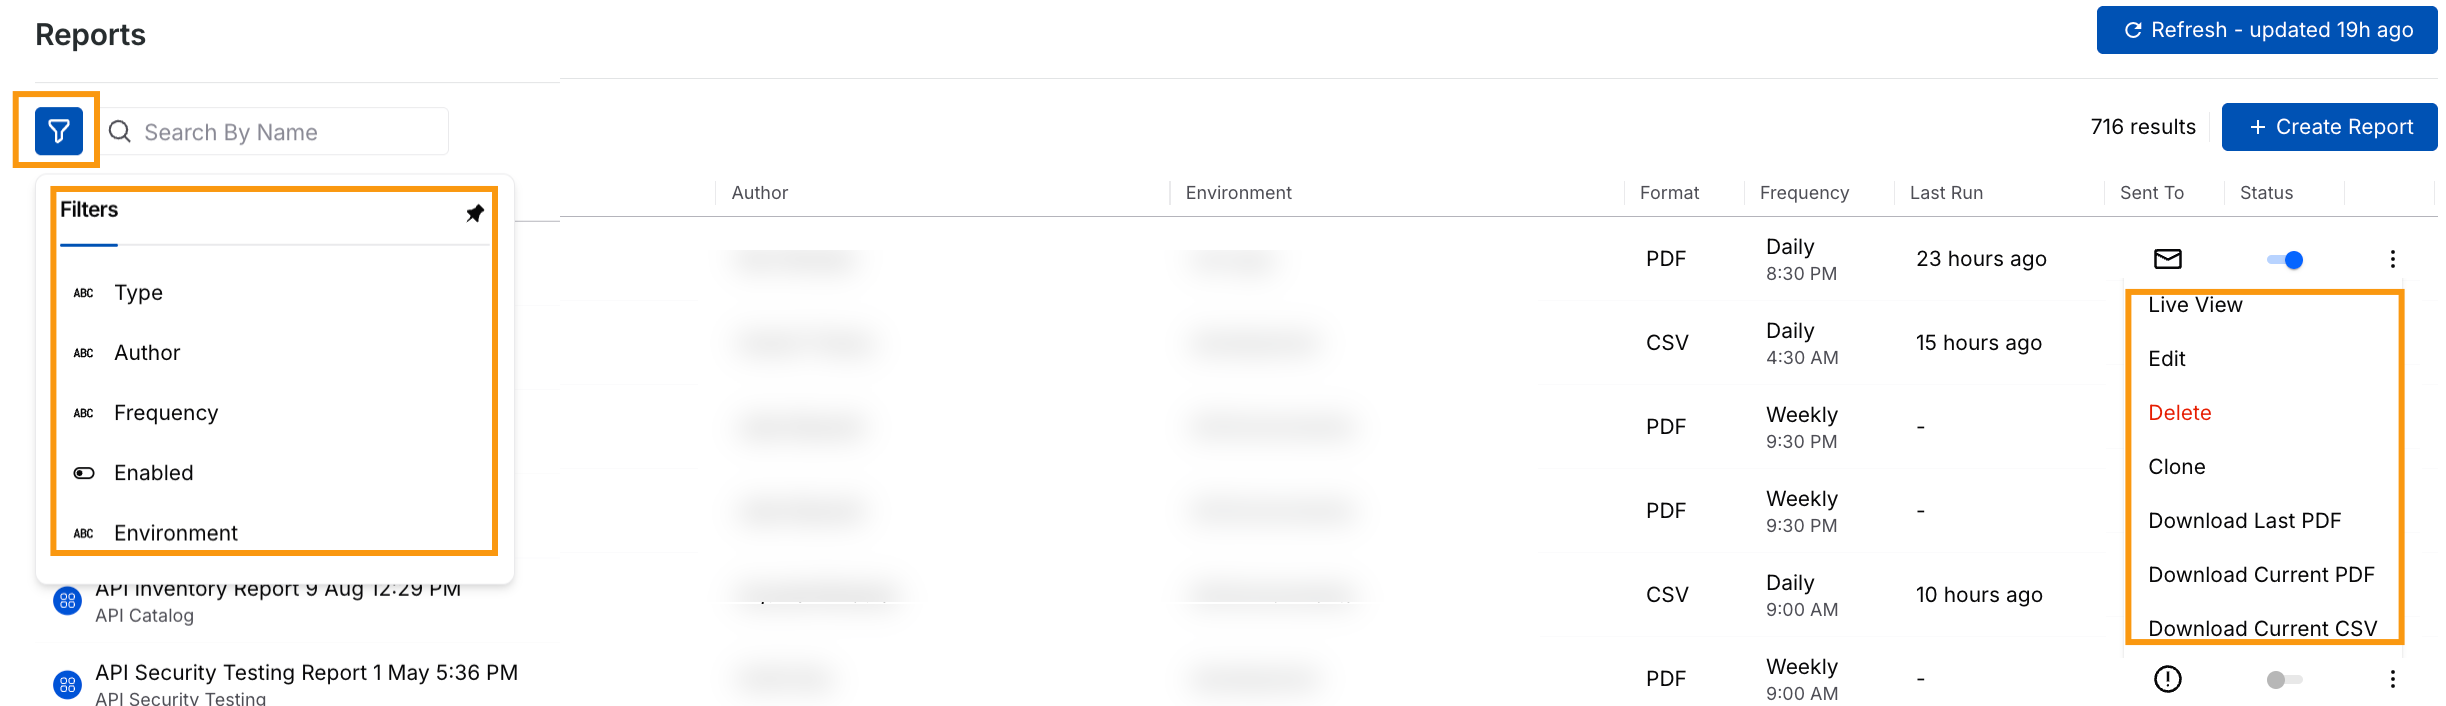
Filters
Filters — Add filters to fine-tune the list of reports shown on the page based on Type, Author, Frequency (daily or weekly), Enabled (True or False), or Environment according to your requirements.
Live View — A view of the report at that point in time. Live view is helpful when you do not want to schedule a report but still need to generate one. The time range for the live view is based on the report's schedule frequency (daily or weekly). If the frequency is weekly, the live view will display a report from one week back to the current time. Similarly, the live view is generated for daily frequency reports.
Edit — Modify the report’s configuration according to your requirements. For more information on the fields, see Create a Report.
Delete — Delete the report if you do not wish to receive it.
Note
A deleted report cannot be restored. You must create a new report.
Clone — Create a copy of the report and modify its configurations to create a report different from the original one. For more information on the fields, see Create a Report.
Download last/current PDF — Download the PDF format of the last report Traceable generated according to the configured schedule.
Download current/last CSV — Download the CSV format of the latest report Traceable generated according to the configured schedule. Multiple CSVs are downloaded based on the number of configuration sections in the report. For example, the API Security Testing report has four configuration sections, so four separate CSVs are downloaded, one for each section.
Note
The data in the Live View and downloaded PDF may differ as some new data may have been reported since its last run. For example, in a sensitive data report, any new reported data may be visible in the Live View while the downloaded PDF may not have it.
Interactive Report
Traceable provides interactive Live View and PDF reports for easy navigation and deeper insights. You can click on a report to view its details, and if you wish to see information about a specific activity, click on that activity. Traceable redirects you to the relevant screen within the platform for further analysis. For example, if you click on an endpoint, it takes you to the Endpoint Details page with details such as metrics, request patterns, and security insights about that API endpoint. You can analyze the data through these interactive reports and quickly address any issues or security concerns that may arise.