Pivotal Cloud Foundry (PCF) is a cloud-native platform that is designed to build, deploy, and manage applications at scale. PCF provides a platform for developers to build and deploy cloud-native applications using modern development frameworks and languages, such as Spring, .NET, Node.js, and Ruby. It also provides a range of services, including data management, messaging, and authentication, that developers can use to build and deploy their applications.
Traceable integrates with PCF using its eBPF solution. The solution works with VMWare Tanzu Operations Manager. VMware Tanzu Operations Manager, commonly referred to as Tanzu Ops Manager, is a tool designed to simplify the deployment, management, and monitoring of Kubernetes clusters and related services in modern application development environments. It is part of the larger VMware Tanzu portfolio, which focuses on helping build, run, and manage containerized applications.
Before you begin
Make a note of the following before you proceed with the configuration:
This solution is only applicable for Traceable's eBPF deployment.
Keep Traceable's access token handy. It will be used when you configure the variables. You can copy the access token by logging into your Traceable platform and then navigate to Settings (
 )→ Account → Agent Token. Note that the token is displayed only once, hence save it before proceeding further.
.png "traceable_generate_refresh_token(1).png")
Make sure that Traceable Platform agent is already installed, and you have the IP address or the domain name of the Platform agent's endpoint. For more information, see Platform agent.
Make sure you have an admin account on Tanzu Ops Manager.
Download
Download the Pivotal file from Traceable's download site. Navigate to install → pcf → tile → latest.
Configuration
Log into your Tanzu Ops Manager account and complete the following steps:
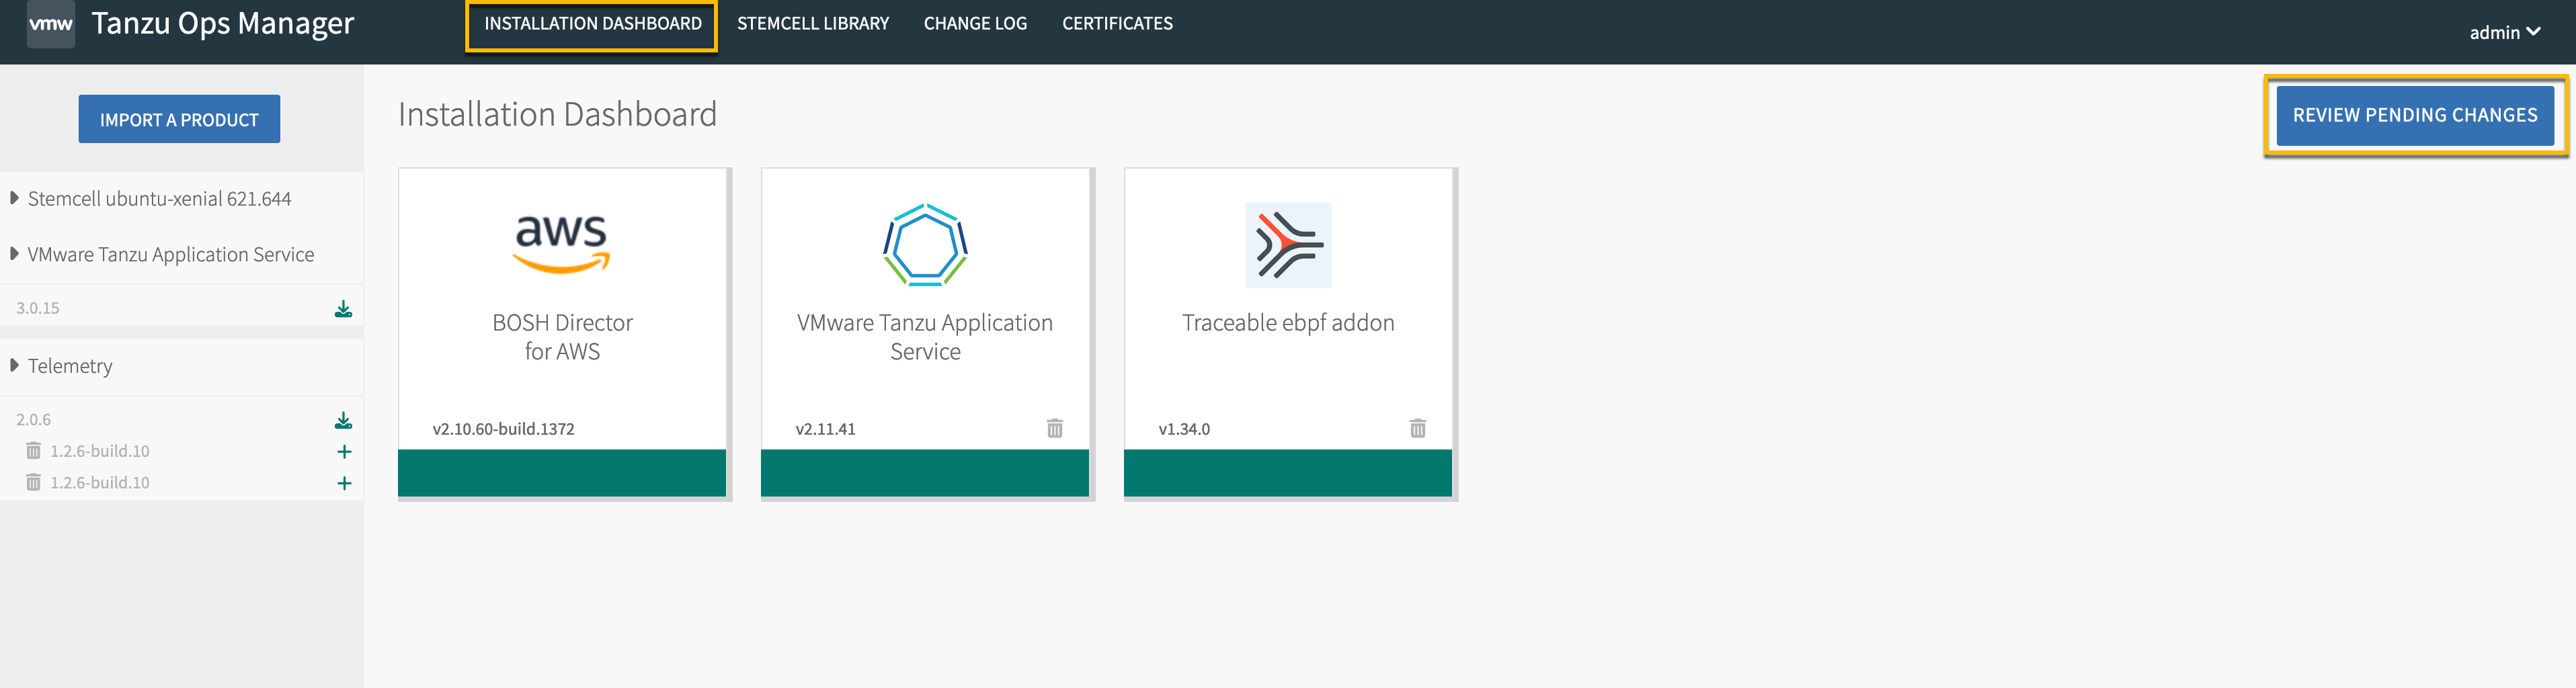
Click on Installation Dashboard.
Click on Import a Product and open the Pivotal file that you downloaded earlier. This would add the Traceable ebpf addon to the Dashboard.
Note
An orange color as shown below means that configuration is incomplete.
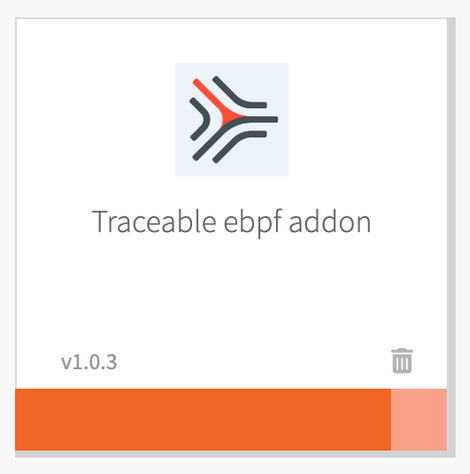
.png)
Click on Traceable eBPF addon card to display the Settings tab.
eBPF tracer configuration
Click on eBPF Tracer Configuration in the Settings tab to configure the different options.
.png)
The following table describes the configuration options for eBPF Tracer Configuration.
Configuration | Value | Description |
|---|---|---|
eBPF Tracer Only checkbox | - |
|
Service Name | string | Service name to be used by the eBPF Tracer |
Process to exclude from tracking | list of strings containing the process names | By default, eBPF Tracer tracks all the processes in the VM. It captures the traffic from the processes serving HTTP traffic. Configure the name of the processes that you wish not to track. |
Listening ports of processes to track | List of port numbers | eBPF Tracer tracks the processes that are listening on these ports. Note By default, eBPF tracer starts tracking all the processes running on the VM. To restrict the tracking of processes, provide the ports numbers. If you wish to track more than one process, add another port by clicking on the Add button. Usually, the applications running in the diego_cell, run on port number 8080. However, if you have customized the port number, provide those port numbers. |
Memory | - | Memory size in bytes. If the number is suffixed with K, M, G, or T, then the memory is processed as Kilobytes, Megabytes, Gigabytes, or Terabytes. The default value is 1G. |
Endpoint configuration for eBPF Tracer
Click on Endpoint configuration for eBPF Tracer in the Settings tab to configure the different options.
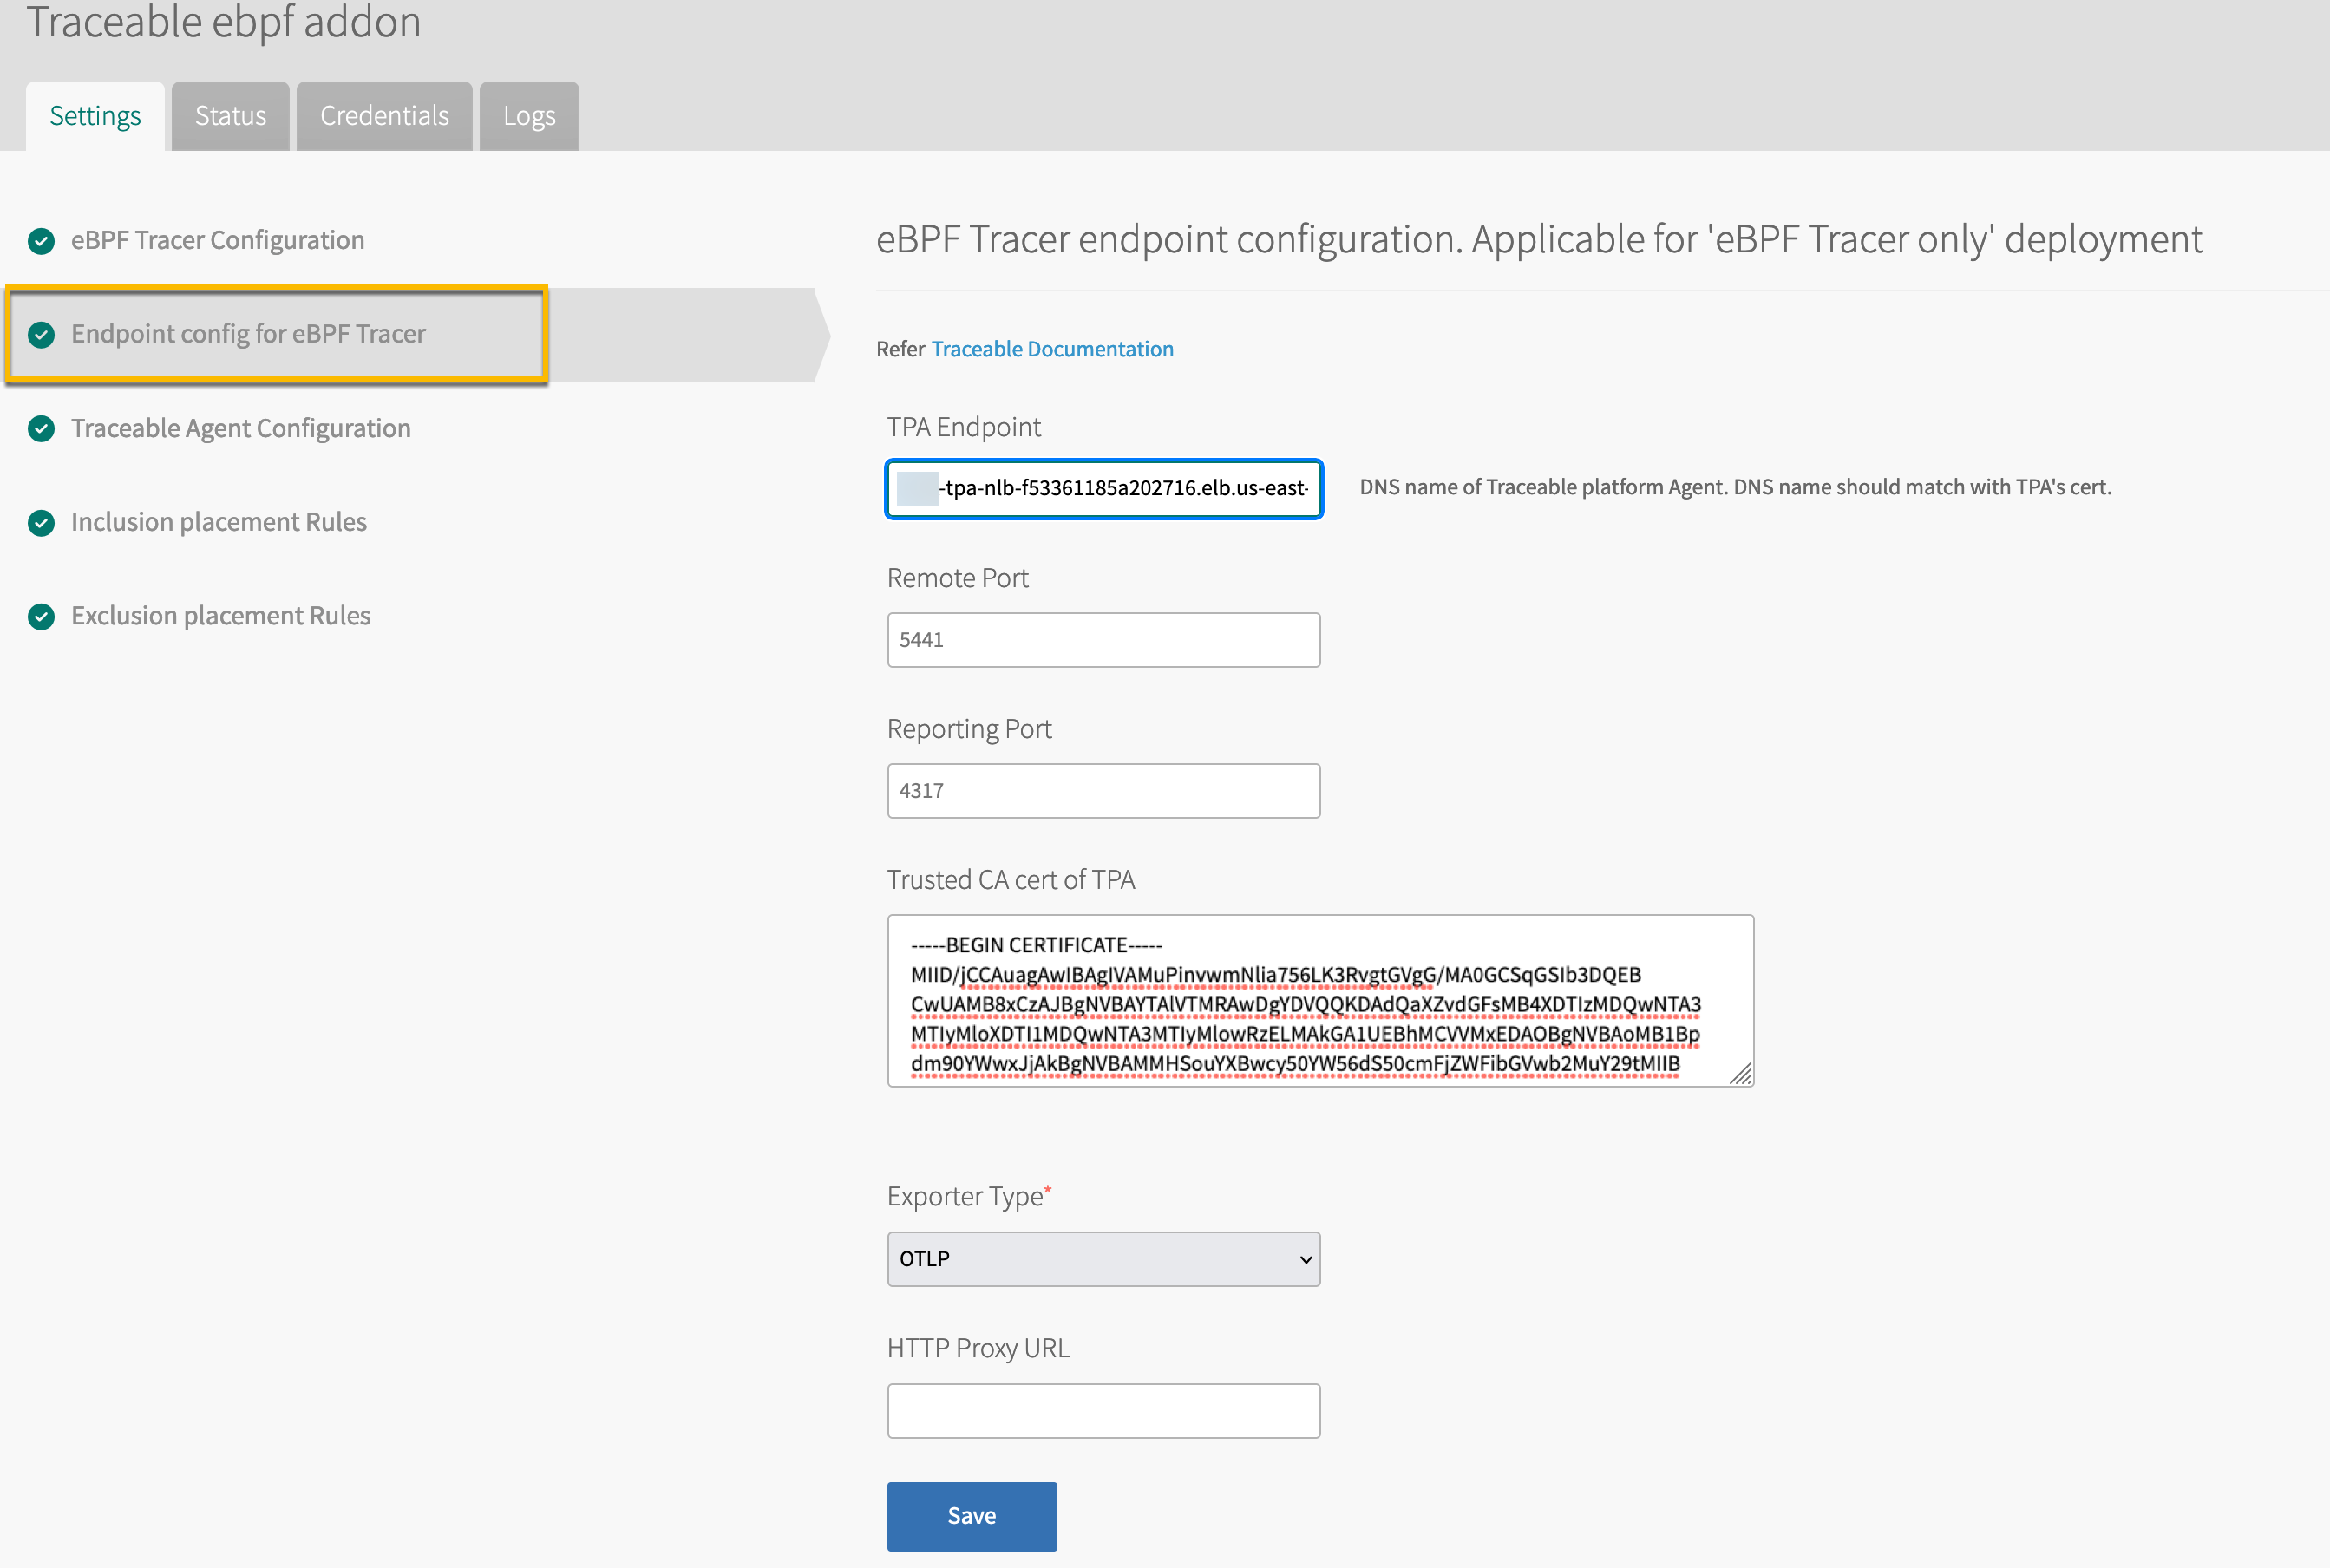
The following table describes the configuration options for Endpoint configuration for eBPF Tracer.
Note
This section is applicable only if the eBPF Tracer Only checkbox is checked in the previous section.
Configuration | Value | Description |
|---|---|---|
Traceable Platform agent endpoint | Domain name or IP address | Endpoint domain or the IP address of pre-installed Traceable Platform agent. |
Remote port | Port number |
|
Report port | Traceable Platform agent's span reporting port |
|
Trusted CA cert of Traceable Platform agent | Certificate text | Text content of CA certificate used by Traceable Platform agent. |
Exporter type of eBPF tracer | - | Select the type of exporter. The default value is OTLP. The other option is ZIPKIN. |
HTTP Proxy URL | URL | URL of the HTTP proxy for a case when eBPF Tracer and Platform agent can only connect through an HTTP proxy. |
Traceable agent configuration
Click on Traceable Agent Configuration in the Settings tab to configure the different options. 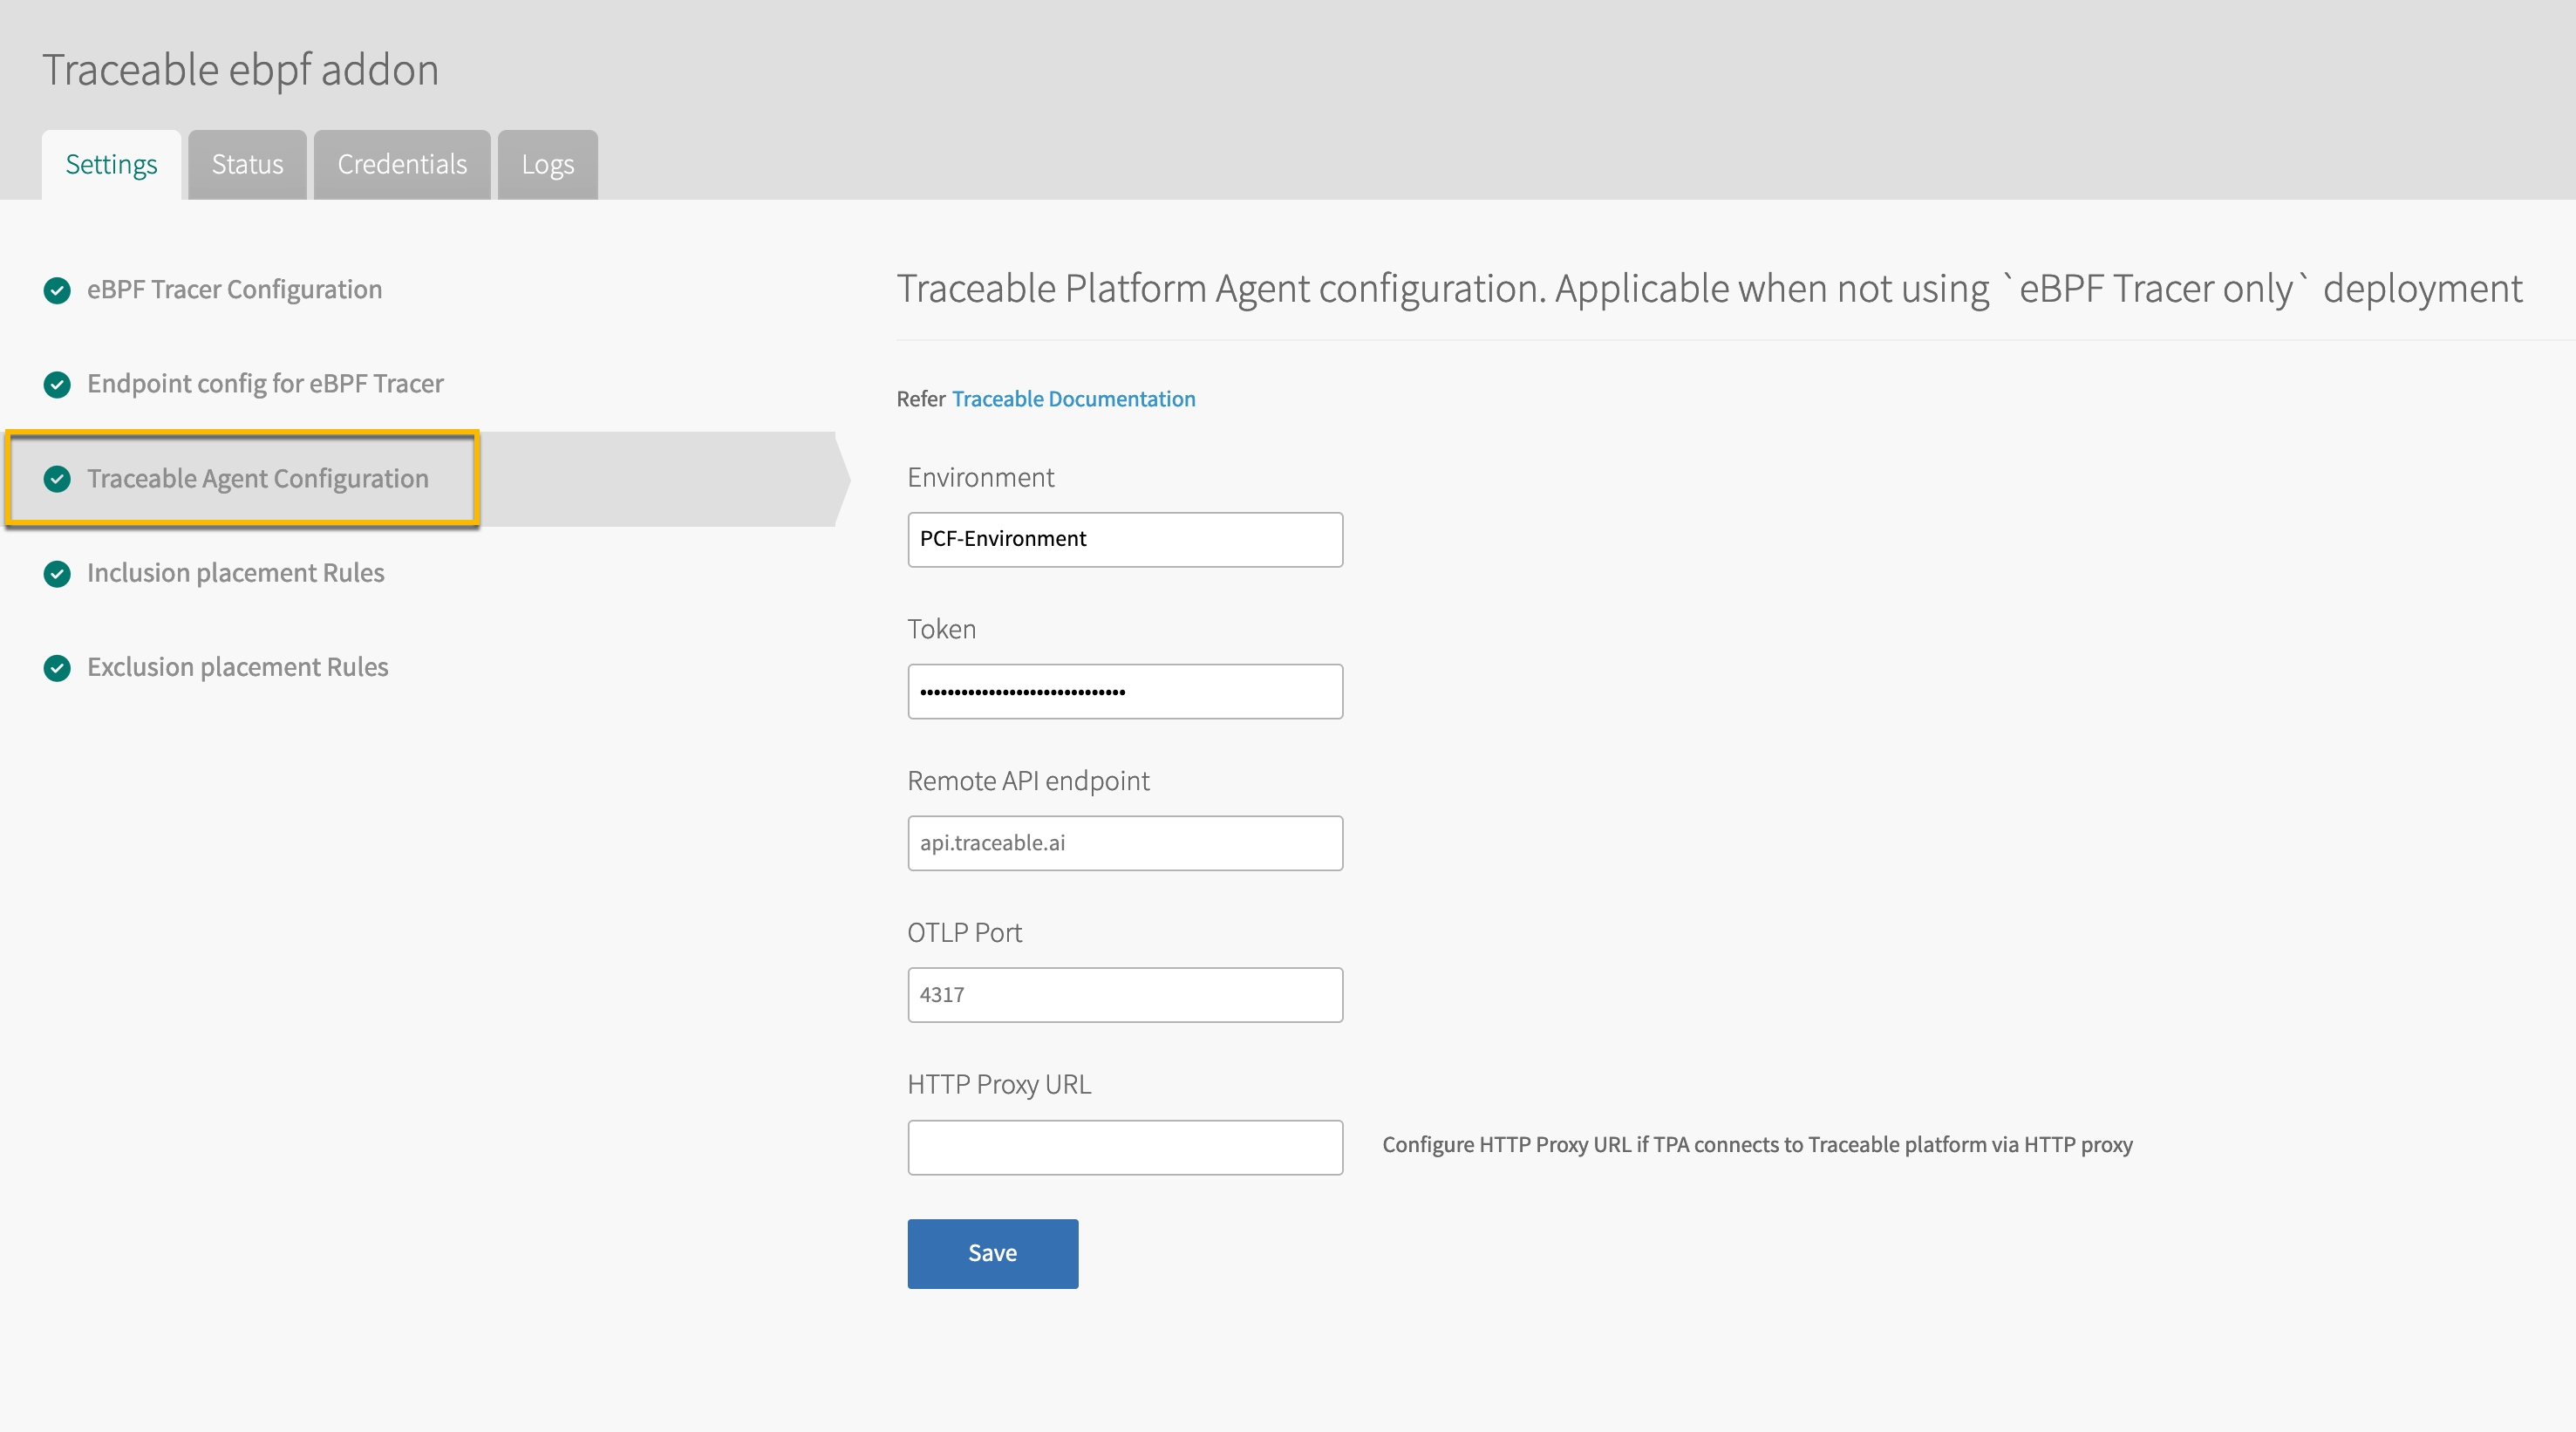
The following table describes the configuration options for Traceable Agent.
Note
This section is applicable only if the eBPF Tracer Only checkbox is unchecked in the eBPF tracer configuration section.
Configuration | Value | Description |
|---|---|---|
Environment | String | Environment name for reporting |
Token | Secret | Platform agent token. The token that you saved in the Before you begin section. |
Remote API endpoint | Domain | API endpoint of Traceable Platform. |
OTLP Port | Port number | Traceable Platform agent binds to this port host's localhost IP address. |
Memory | Number | Memory size in bytes. If the number is suffixed with K, M, G, or T, then the memory is processed as Kilobytes, Megabytes, Gigabytes, or Terabytes. The default value is 1G. |
Inclusion and Exclusion placement rules
Configure the inclusion and exclusion placement rules. The inclusion and exclusion rules are used to define what is captured for processing and what is not. For more information, see Placement rules. Make sure to match the text diego_cell in the inclusion rule and errands for Lifecycle exclusion rule as shown below.
Inclusion rule
.png)
Exclusion rule
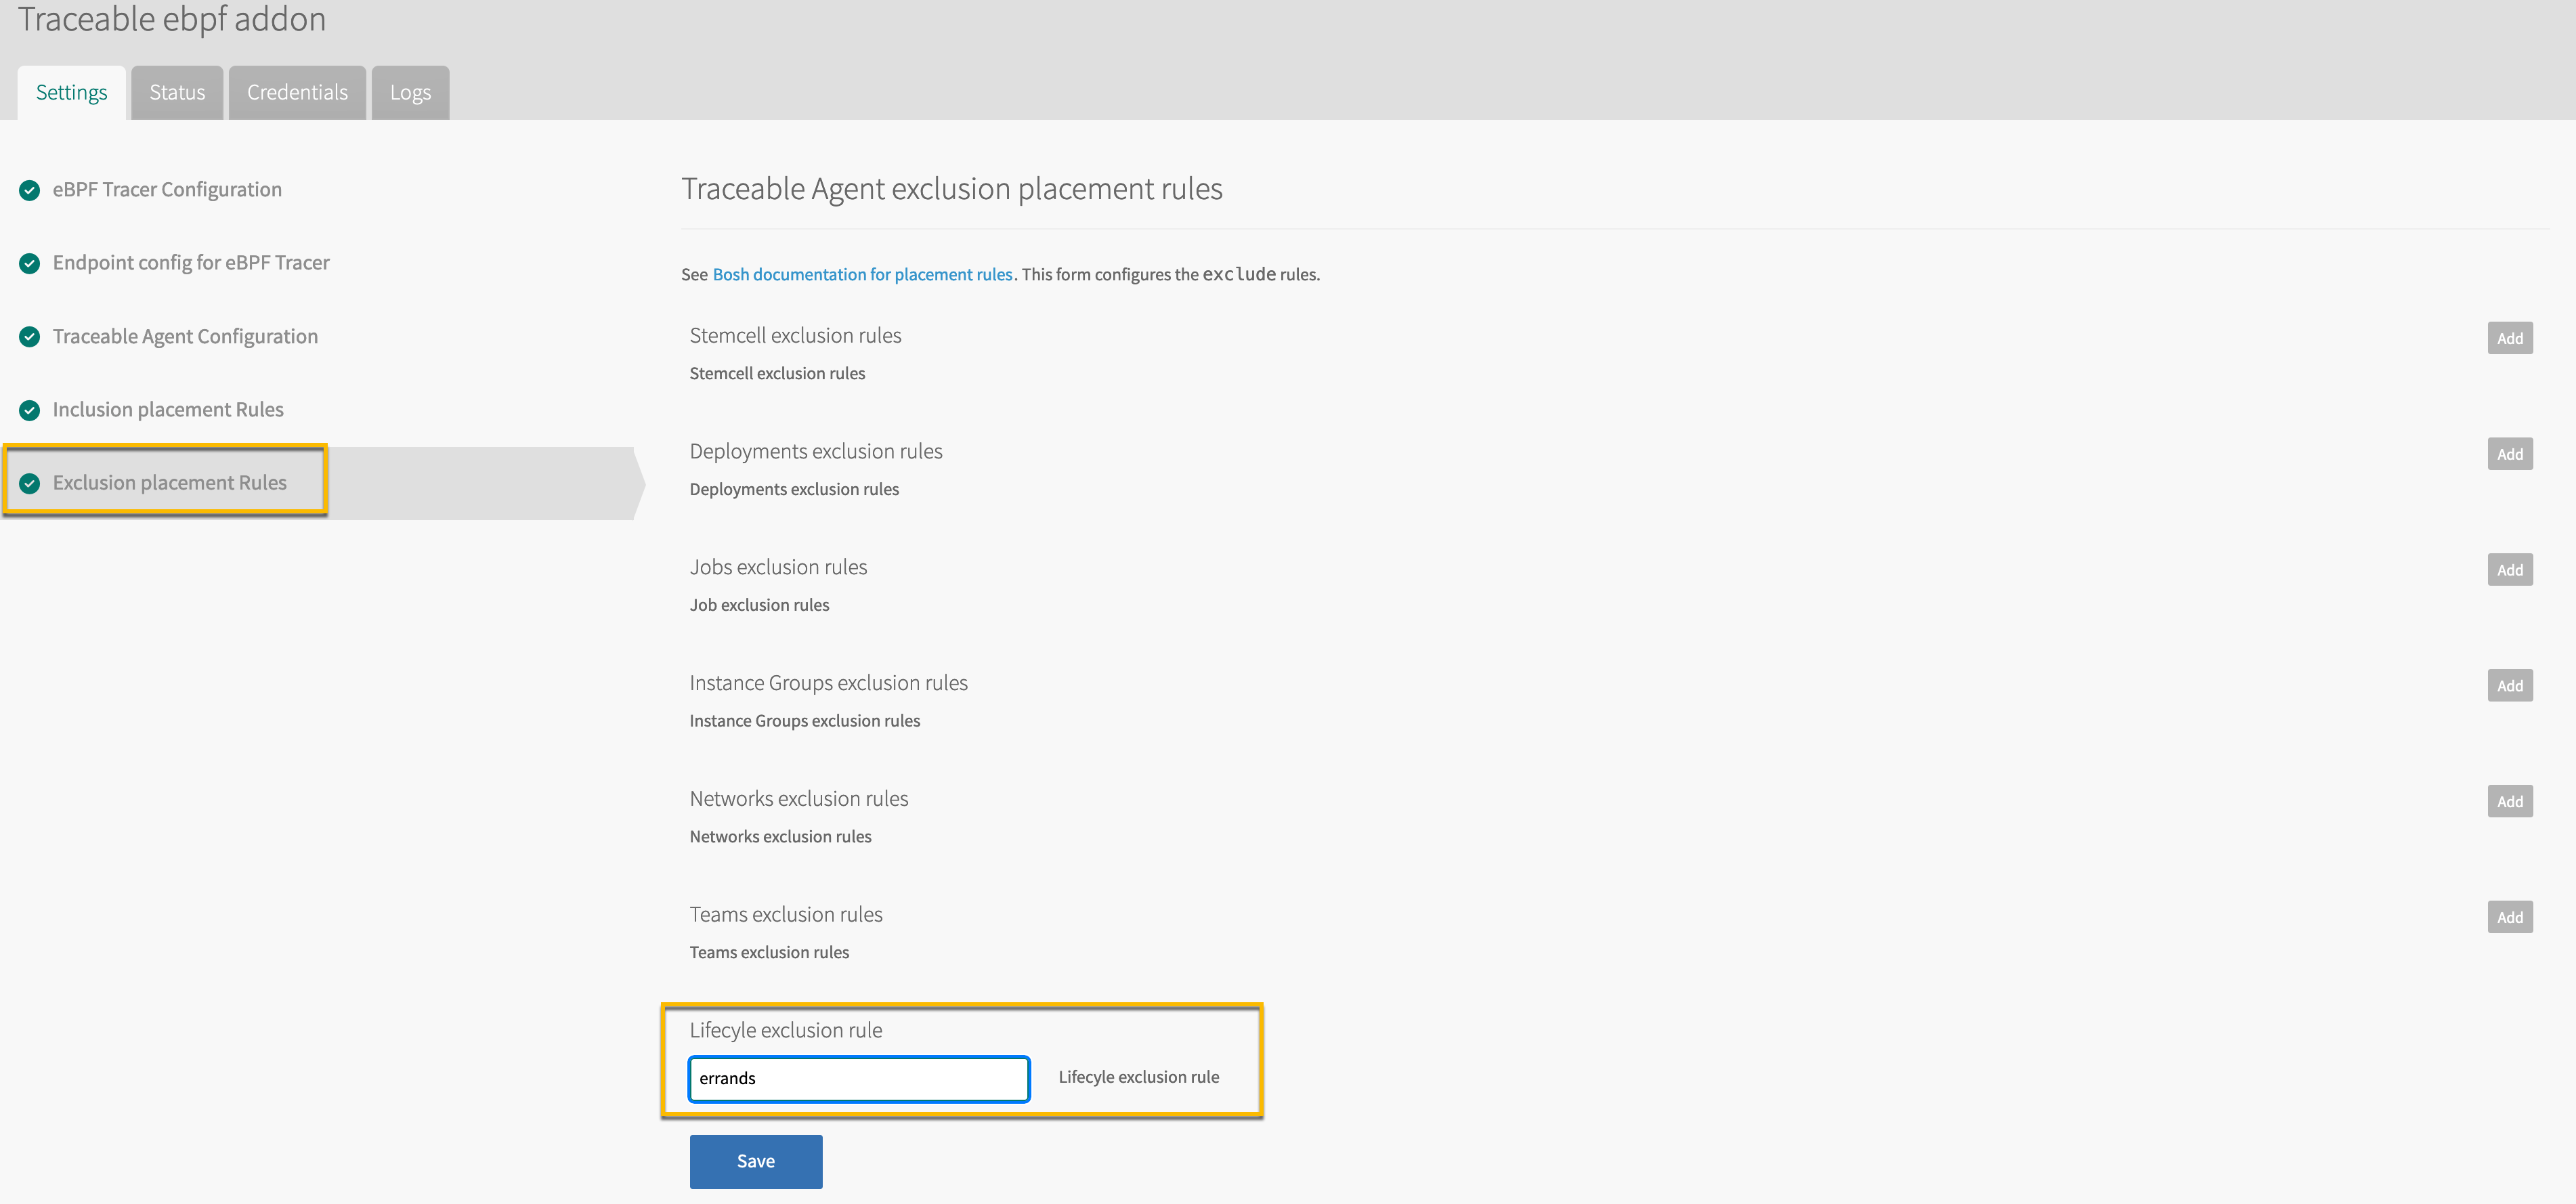
Make sure to Save all the configurations.
Apply changes
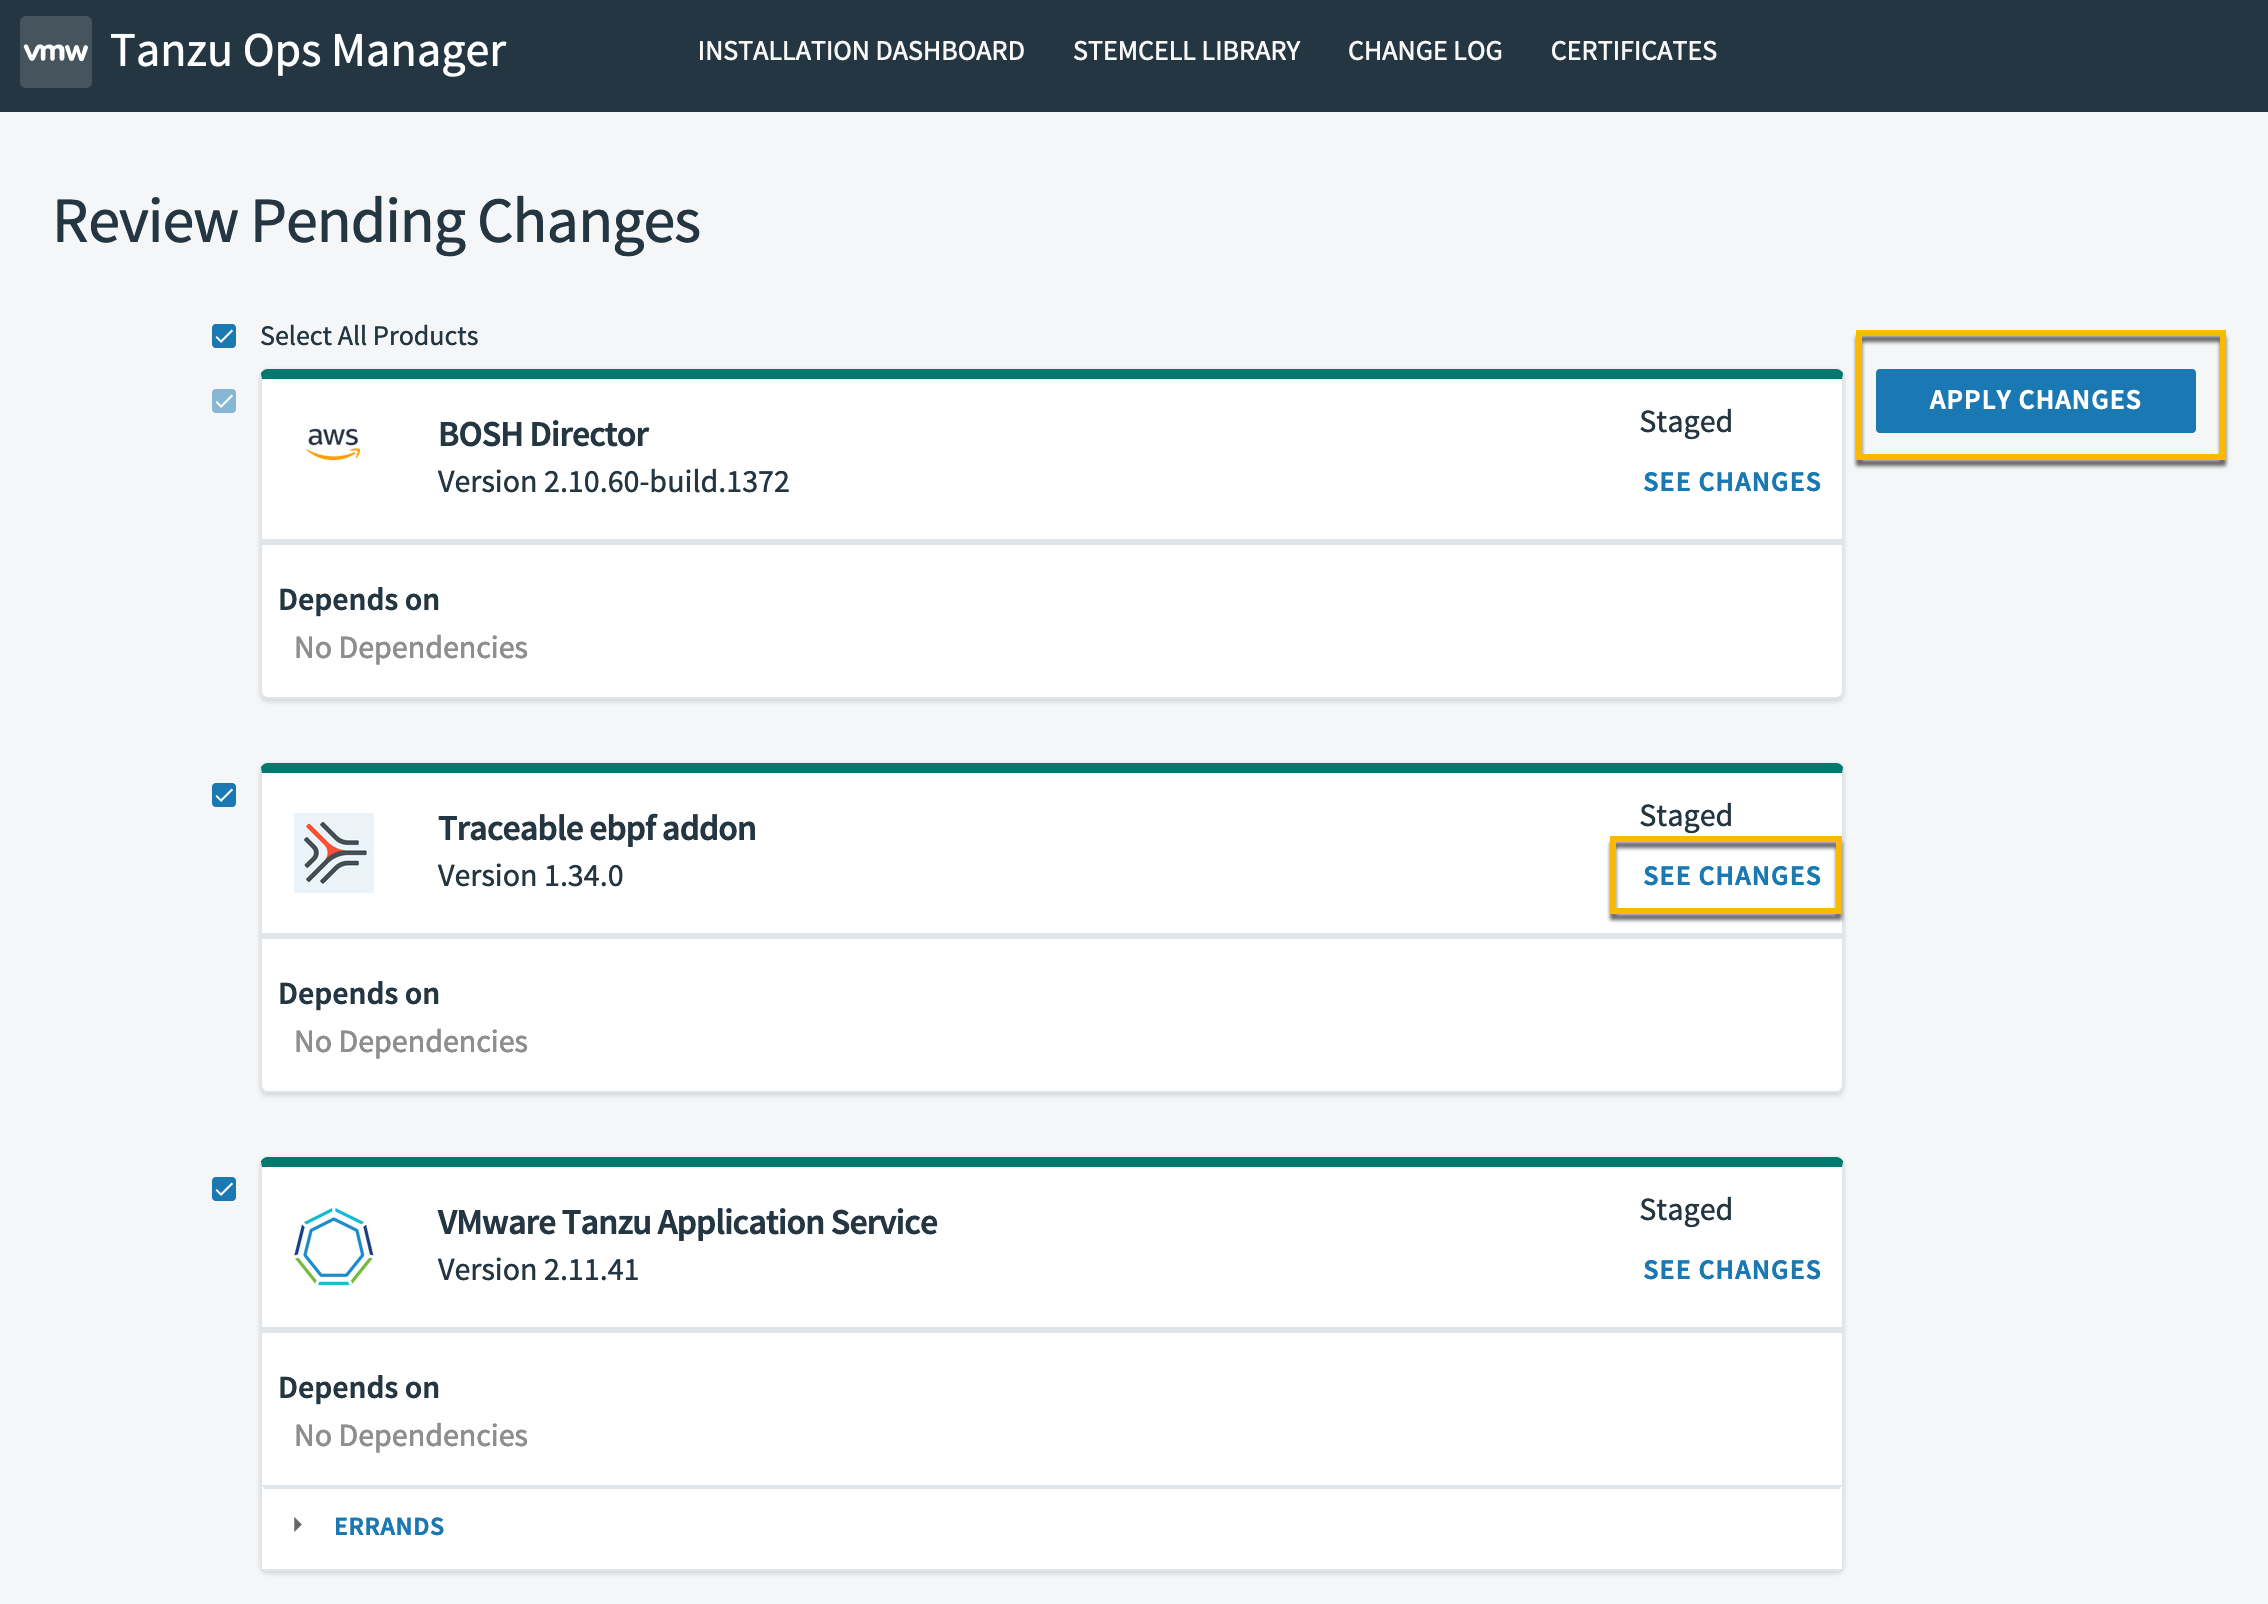
Navigate to the Installation Dashboard and click on Review Pending Changes.
Review the changes on the Review Pending Changes page and Apply Changes.