The Application Flow page under API Discovery depicts the flow of data between multiple components, essentially the Edge, Services, and Backends. The flow visually represents how data and requests traverse through your application. Traceable provides this visibility through a map showing traffic flow between services according to your chosen time frame from the top menu bar.
(1).png)
Application Flow
The application flow is useful for simple to complex applications, helping users understand the application’s architecture and functionality quickly and comprehensively. This can help users understand the kind of data flowing and easily identify failures and bottlenecks in the application, leading to faster resolution.
The flow map contains three components:
EDGE — This component represents the entry point of incoming API requests. This may include API gateways, load balancers, or web application firewalls. Edge components are responsible for handling requests, authenticating, and directing them to the appropriate services in the deployment.
SERVICES — The requests from the Edge are routed to the services. This component contains the processing units or microservices within your application. Each service handles specific tasks, such as data processing, and interacting with backend databases.
BACKEND — This component includes databases, file systems, and third-party APIs and services that you use in your application to store, manage, and retrieve data. These backends maintain the data and provide it to the services component for processing user requests.
Note
Availability of the above components depends on whether or not there was an interaction between the components in your chosen time frame.
The components on the flow map are connected using arrows that display the data flow from one component to the other. The color of an arrow represents the sensitivity of data flowing through the component. For example, in the first screenshot, the interaction between the NGINX gateway and the auth-api service contains highly sensitive data, highlighted by the red arrow.
Traceable also groups three or more entities (services, backends, or third parties) within a component to simplify and ensure efficient organization of the application flow. The grouping criteria are as follows:
Entities with no arrows — These entities are grouped as they do not have any dependencies or interactions with other entities.
Entities with incoming arrows — These entities are grouped based on receiving requests or data from other entities.
Entities with both incoming and outgoing arrows — These entities are grouped together as they are intermediaries, receiving inputs and sending outputs to other entities.
Entities belonging to the same type — These entities are grouped based on their type and functionality. For example, Python entities are grouped together.
You can click on a Service Group to view the entities present under it. For example, in the screenshot below, the open-API-service, tagsapi, userservice, and cluster…-manager service are grouped. You can also click on an entity to view its list of associated APIs.
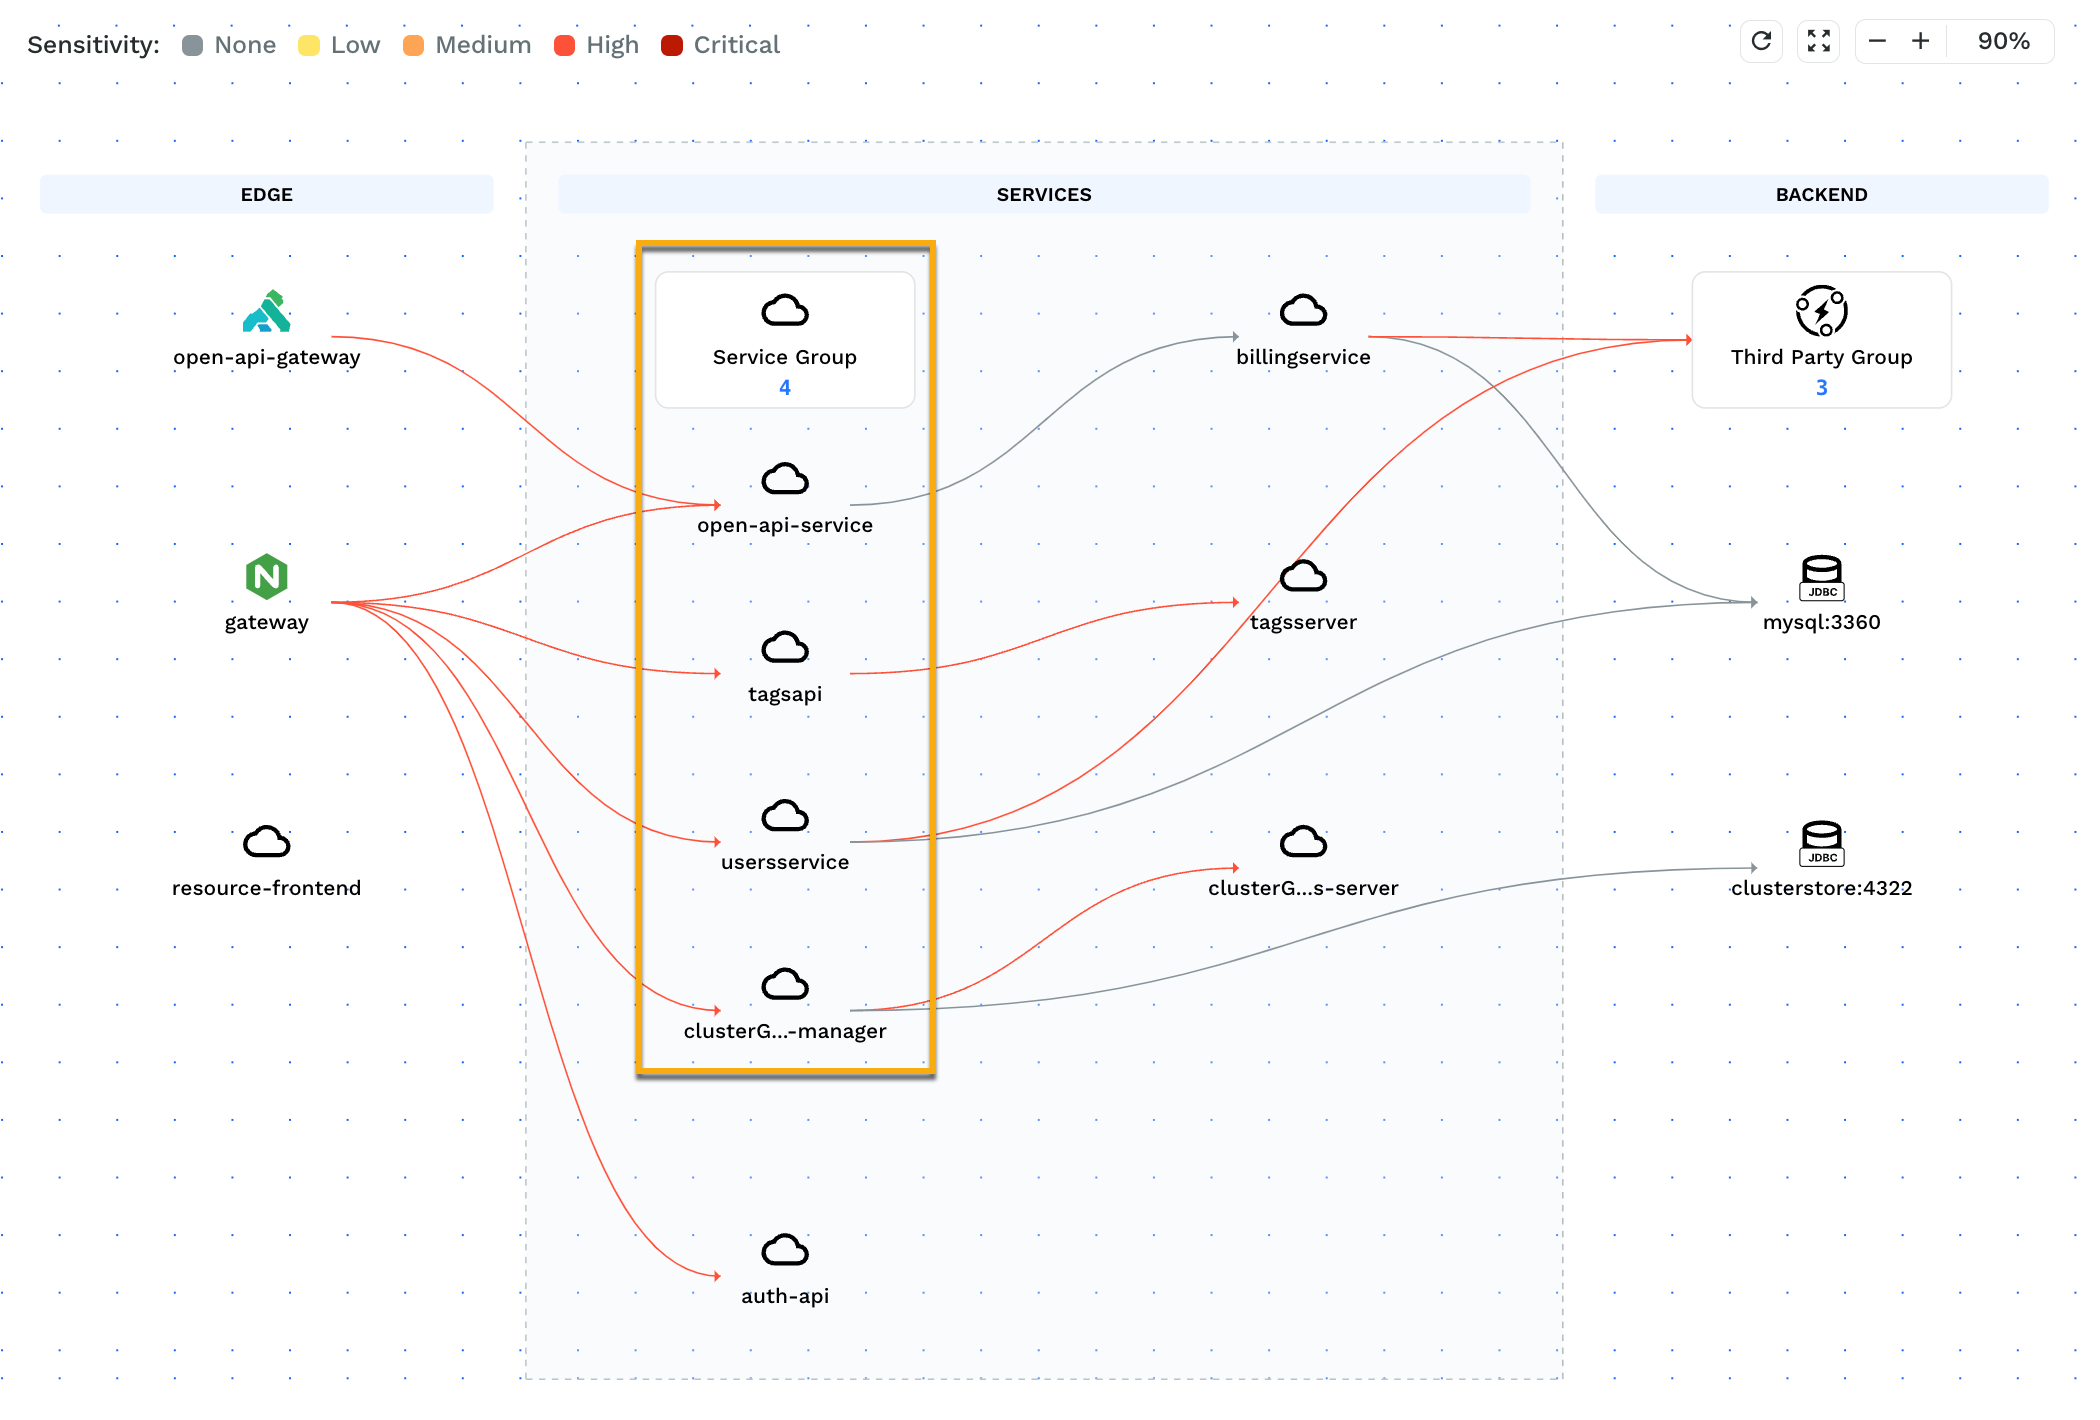
Service Group
Traceable also allows you to filter the components in the application flow to view the ones according to your requirements. To do so, you can complete either of the following:

Application Flow Filters
Click on the Filter (
 ) icon in the top left corner.
Hover over a service and click the drill-down icon (
.png "traceable_drill_down_icon(1).png") ) to filter components according to that service.
) to filter components according to that service.