As organizations continue to grow and deploy new applications while integrating with diverse hosting providers, the number of exposed APIs increases, expanding the external attack surface. With this rapid evolution, traditional security measures often struggle to provide complete visibility into these external APIs, making it challenging to secure public-facing assets.
Traceable provides Sonar, a comprehensive external attack surface management tool to address these challenges. Sonar helps organizations discover, monitor, and secure their public-facing APIs and associated assets. By automating the discovery process and using advanced scanning and vulnerability detection techniques, Sonar allows security teams to proactively identify and mitigate risks, ensuring the safety of their digital ecosystems.
The Use of Sonar
Sonar is designed to cater to multiple use cases, including External Attack Surface Management, API Compliance, Due Diligence, and Sensitive Data Detection. Whether it's discovering undocumented or deprecated APIs, monitoring public APIs for regulatory compliance, or identifying misconfigurations during mergers and acquisitions, Sonar helps organizations safeguard their digital assets by providing real-time visibility and actionable insights.
Run the Sonar scan
To run the Sonar scan for your organization, reach out to Traceable’s support at support@traceable.ai or contact your sales representative.
The following sections provide a detailed walkthrough of Sonar’s key features, highlighting each section’s functionality and the insights they offer.
Sonar overview
The Sonar Overview screen provides a high-level summary of the assets and issues identified during the scanning process. This page offers a quick snapshot of key findings and insights.
Key elements of this screen include:
Assets Discovered — Displays the total number of assets identified by Sonar, categorized by asset type. In this updated example, Sonar has discovered a total of 8.7K assets, broken down into:
API: 6621
Service: 1772
Domain: 304
The breakdown is visualized in a pie chart, providing a clear and immediate understanding of the types of assets under scrutiny.
Issues Found — This section presents the number of issues discovered during the scan, categorized by severity (Critical, High, Medium, Low).
Top 10 Issues — This section at the bottom of the page highlights the most critical issues detected during the scan.
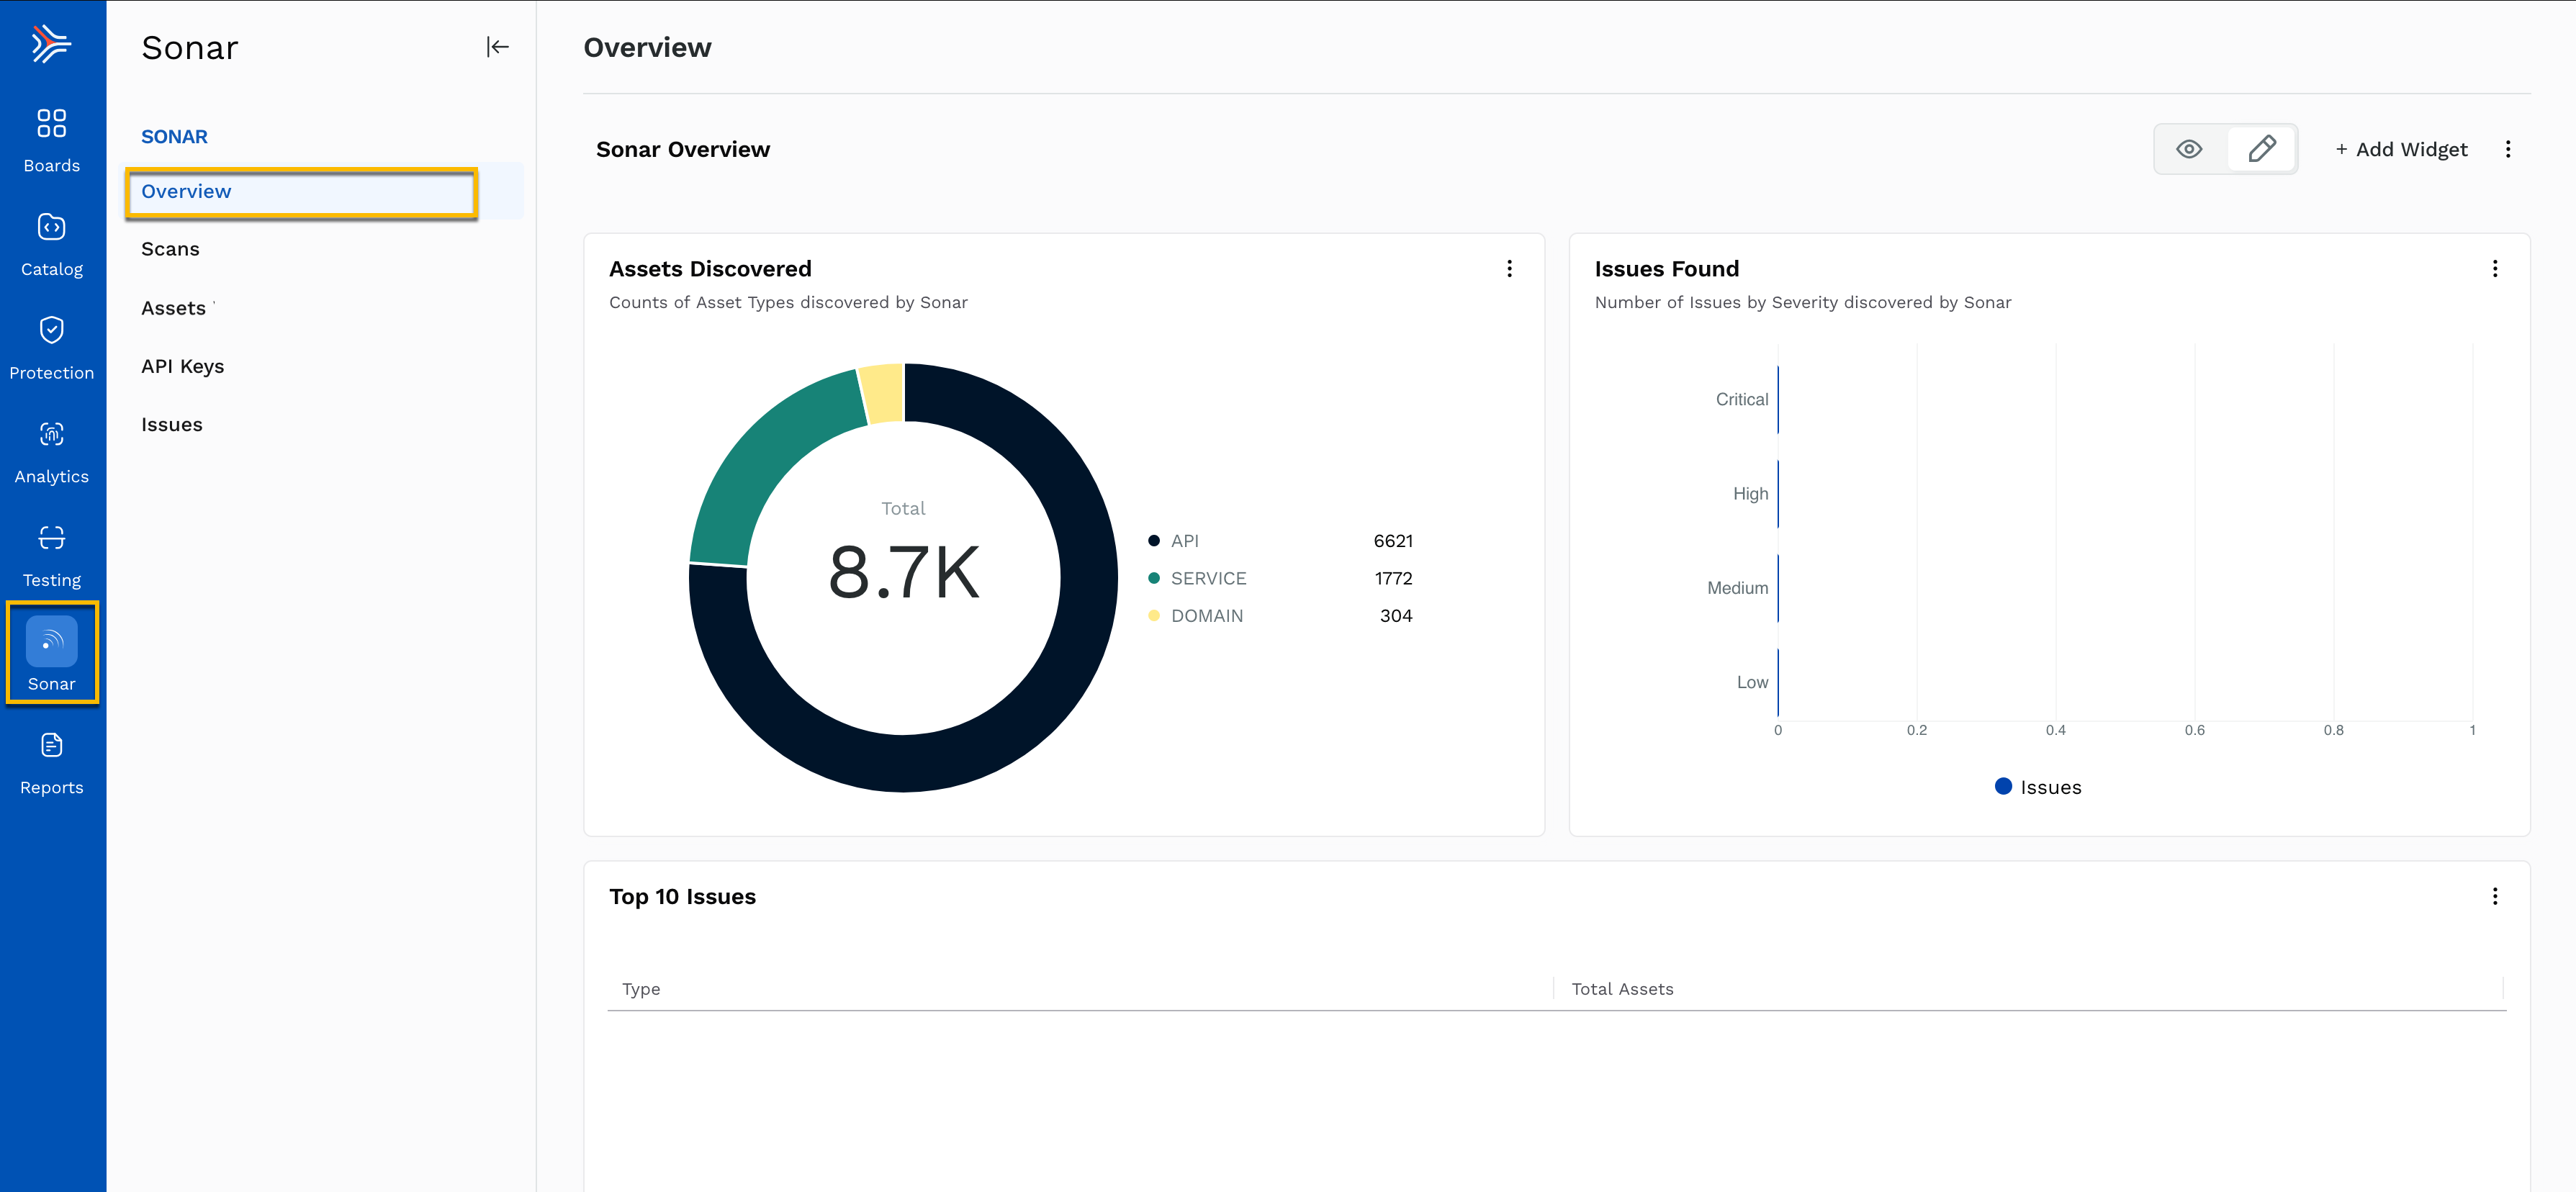
Sonar Overview
The Sonar Overview provides a concise view of your organization's external attack surface, enabling security teams to understand the scope of their discovered assets and prioritize resolving any potential issues.
Sonar Scans
The Sonar Scans page provides a detailed view of all the scans that have been run, allowing users to track the domains and assets discovered during each scan. This page is essential for understanding the breadth of the external attack surface that Sonar is monitoring and discovering.
Key elements of this screen include:
Scan Name — The unique name assigned to each scan, whether automated or manually triggered. This field helps users differentiate between different scan types and their purposes.
Domains — The specific domain(s) associated with each scan. For example, some scans are run on
api-production-2.abc.us, while others may have no associated domains listed.Assets Discovered — The number of assets identified in each scan. In this example, some scans have discovered up to 8 assets, while others have found none.
API Keys Discovered — This column indicates if any exposed API keys were found during the scan.
Issues Discovered — Displays the total number of issues (vulnerabilities, misconfigurations, etc.) identified during each scan. As shown, some scans report discovered issues, such as two issues detected in the TraceableSonarScan.
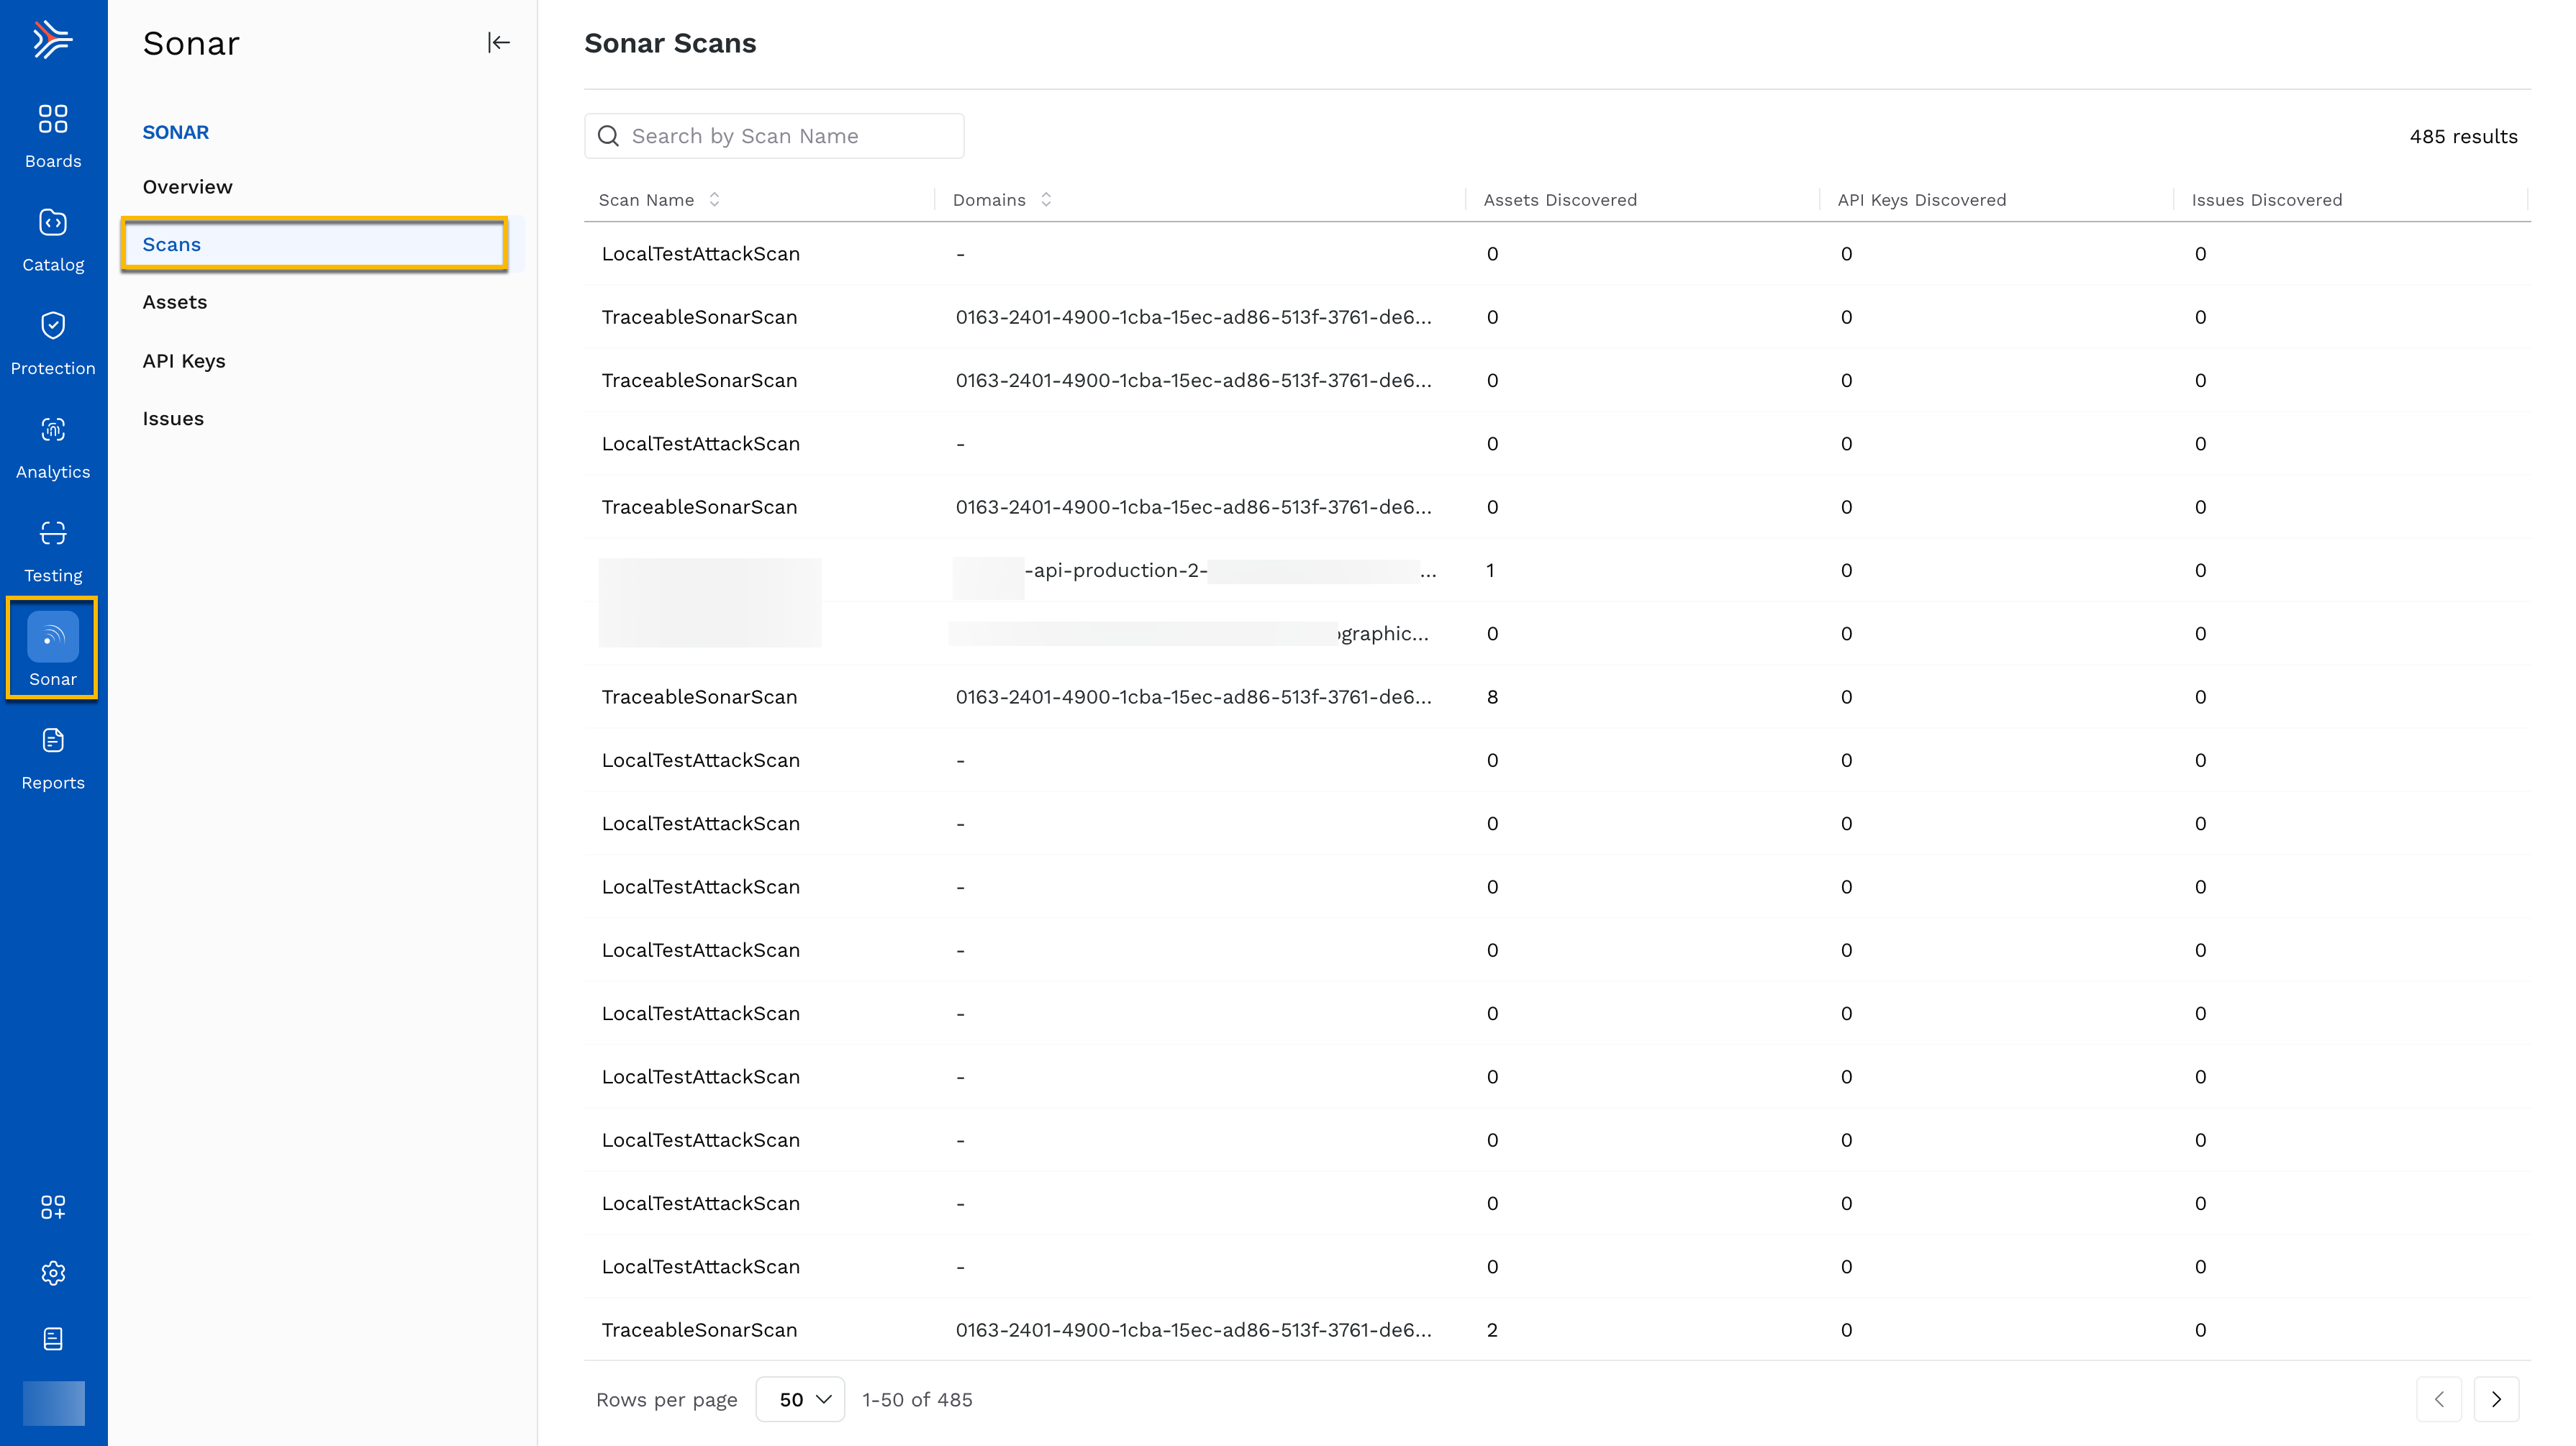
Sonar Scans
The Sonar Scans page provides a complete record of all scans performed, offering a comprehensive look into which domains and assets have been assessed and what vulnerabilities or exposed information were detected. This page allows security teams to focus on scans that have discovered the most assets or issues and to prioritize their remediation efforts.
Sonar Assets
The Sonar Assets page lists all the assets discovered during the scans, categorized by Asset Type, Source, or Domain name. This page provides a complete inventory of the organization's public-facing assets, providing visibility into which assets may require attention due to potential vulnerabilities.
Key elements of this screen include:
Asset Type — Identifies the type of asset discovered. In this example, all listed assets are of type DOMAIN.
Asset — Lists the specific asset names discovered during the scan. Some examples include domains like traceable.ai, etc.
Source — This shows the source associated with each asset. For many of these assets, the source is traceable.ai, indicating that they are internal assets monitored by Sonar.
Issues — Indicates whether any issues (vulnerabilities, misconfigurations, etc.) have been found for the asset.
You can click on an asset to view more information about it, including a Lineage Graph and a description of how it was found.
.png)
Sonar Assets
The Sonar Assets page offers an extensive view of the discovered assets, enabling security teams to monitor and evaluate their exposure comprehensively.
Sonar API Keys
The Sonar API Keys page provides a detailed view of all API keys exposed during the scans. Grouped by their source, this page lets users quickly identify where the API keys originate and take necessary action to mitigate potential security risks.
Key elements of this screen include:
Source — Lists the source from which the API keys were discovered. In this case, the API keys are found within files hosted on ngrok-free.app and other related URLs.
API Key — Shows the specific API keys that were exposed. These keys can be crucial for controlling access to sensitive services, making their exposure a critical security concern.
Target API — This field indicates the target API the exposed keys are associated with, but it remains unpopulated in this screenshot.
Source Type — Indicates the type of source where the API key was discovered, though this column is not populated in the current example.
Creation Timestamp — Displays the time and date when the API keys were first discovered. This helps track when the keys were exposed and allows for more accurate remediation.
In the example above, one source, ngrok-free.app/config.js, has six exposed API keys, while other sources like ngrok-free.app/services.js and ngrok-free.app/auth.js contain multiple additional API keys.
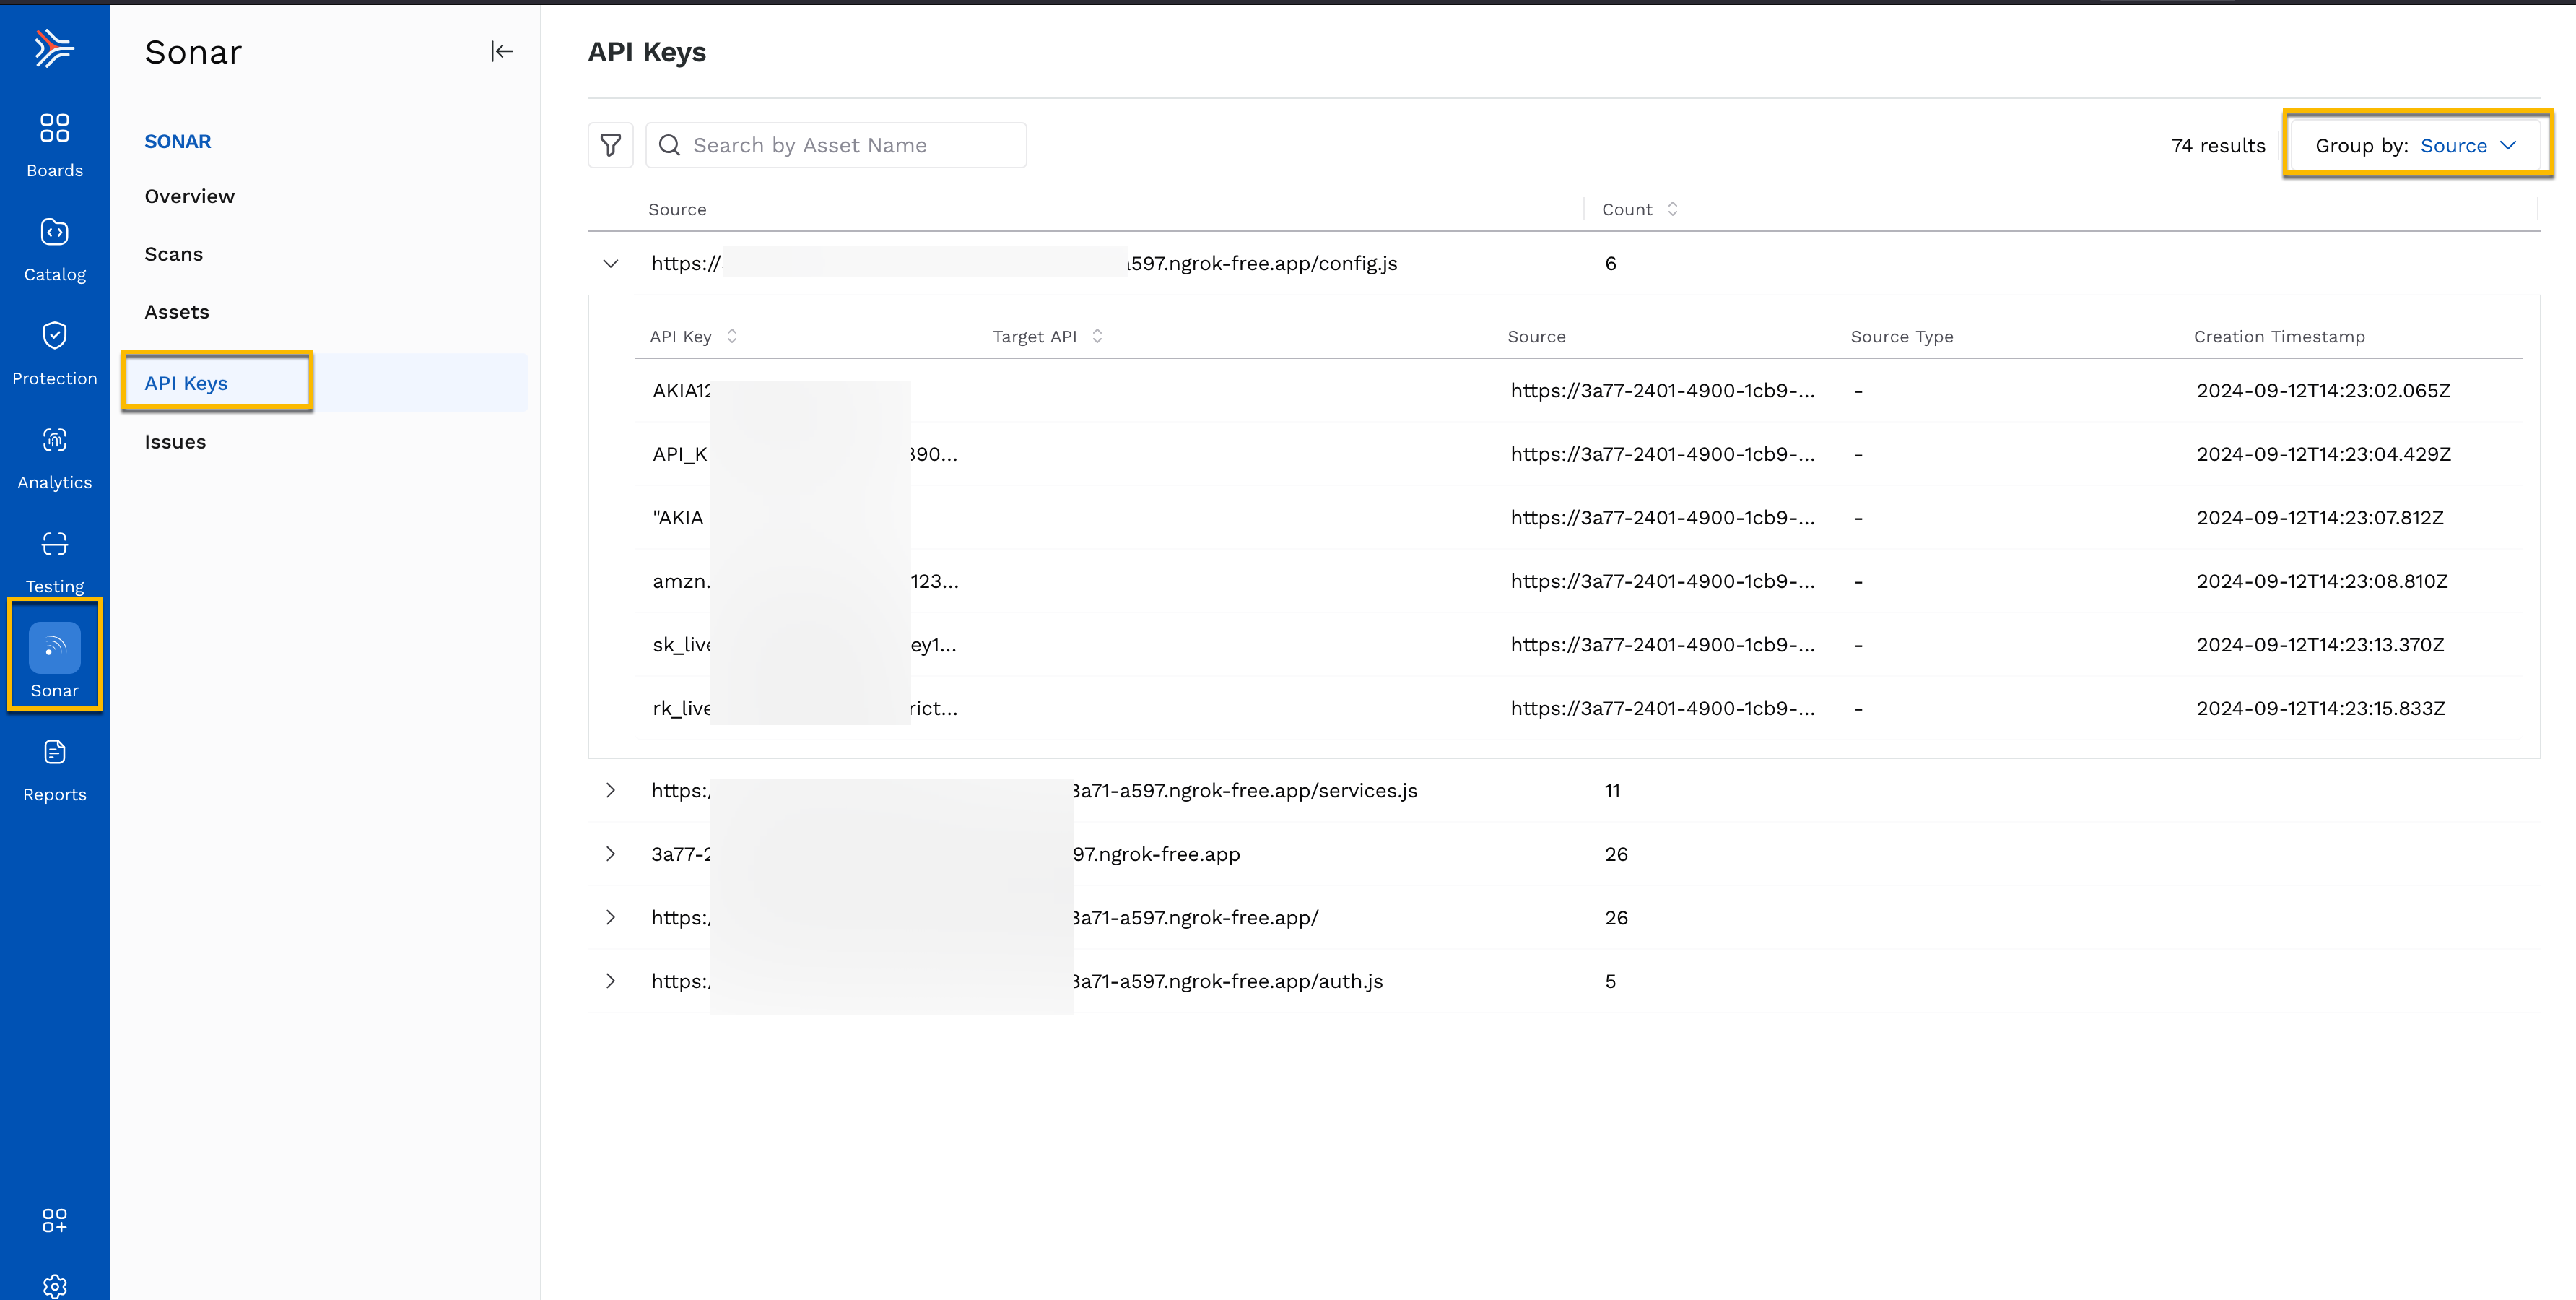
Sonar API Keys
The Sonar API Keys page enables security teams to identify and address exposed API keys effectively, preventing unauthorized access and mitigating potential breaches.
Sonar Issues
The Sonar Issues page provides a comprehensive view of all identified vulnerabilities and misconfigurations across your public-facing assets. This section allows users to track, prioritize, and manage security issues, focusing on severity, affected assets, and remediation efforts.
Key elements of the Sonar Issues page include:
Issues in All Assets — This summary shows the total number of issues detected across all assets. In this example, there are 342 open issues.
Severity Breakdown — Issues are categorized by severity, such as high, medium, and unspecified. The visual breakdown helps prioritize the most critical issues for immediate action — for instance, one high-severity issue, one medium-severity issue, and 340 unspecified issues.
Status — Displays the number of issues currently open and requiring attention. In this case, all 342 issues are open.
The table below the summary provides detailed information on each identified issue:
Issue Name — The specific vulnerability or misconfiguration detected (e.g., Debug Mode Detection, TLS Not Implemented Vulnerability, Server Version Disclosure).
Assets — The number of affected assets linked to each issue. For example, the Certificate Name Mismatch issue affects 51 assets.
Severity—The severity level for each issue (High, Medium, etc.) indicates its potential impact on security. Critical issues, such as Debug Mode Detection, are marked in red.
CVSS Score — This displays the Common Vulnerability Scoring System score for each issue, which is a standardized measure of its severity. For instance, Debug Mode Detection has a CVSS score of 7.5, which is categorized as high.
OWASP API Top 10 — Indicates whether the issue is classified as an OWASP API Top 10 vulnerability, such as API9 or API8. For example, Web Server Misconfiguration falls under 2023-API9.
Source — Identifies the origin of the issue, which in this case is Sonar.
Last Seen — The most recent date and time the issue was detected. For example, the Debug Mode Detection issue was last seen on 2024-10-02.
.png)
Sonar Issues
This screen helps prioritize high-risk vulnerabilities while providing insight into which assets and endpoints are affected, allowing for focused remediation efforts.