Updates (July 2025 to September 2025)
September — Updated the topic to include Snyk region selection and the flexibility to add custom findings. For more information, see Add new Snyk integration.
Snyk is a cloud-based software development platform that helps developers find and fix security issues in their open-source dependencies. It provides a range of tools and services to help developers identify and remediate issues (vulnerabilities) in their applications before they are deployed to production. Snyk scans application dependencies to identify known issues and guides how to remediate them. Traceable provides a Snyk integration with its API Security Testing (AST). This integration allows you to correlate issues found by AST with static code analysis performed by Snyk.
What will you learn in this topic?
By the end of this topic, you will be able to:
Learn about the Snyk Traceable integration.
Understand the prerequisites required for Snyk integration with Traceable.
Understand how to add a new Snyk integration.
Understand the Traceable Snyk correlation.
Before you begin
Make a note of the following before you proceed with Snyk integration with Traceable:
Make sure you have the Snyk API Token. For more information on generating one, see Revoke and regenerate a Snyk API token.
Make sure you have the Region information. For more information, see Snyk Region and Integrations Consideration.
Add new Snyk Integration
To set up the Snyk integration, log in to your Traceable account, navigate to Integrations ( ![]() ), and do one of the following:
), and do one of the following:
Search for Snyk in the search bar.
Under All Integrations, navigate to CI/CD → Snyk.
Click Configure, and in the Add New Snyk Integration window, complete the following steps:
Specify the Snyk API Token.
Select the appropriate Snyk Region from the drop-down. You can also select Custom and provide your own reporting endpoints. Upon selection, you can specify the following:
API Base URL — The API URL Traceable should use to communicate with the Snyk API.
App Base URL — The APP URL Traceable should use to access the Snyk web application in your selected region. For more information, see Before you begin.
Click Validate. Once Traceable validates the connection, Save is enabled.
The following interactive demo walks you through the steps to navigate and integrate Snyk with Traceable.
Configuring Snyk during scan creation
After you have successfully integrated Snyk with Traceable, you can enable it when Creating a Scan under API Security Testing. To do so, in the Integration step of Create New Scan, complete the following steps:
Enable the Snyk toggle to enable the integration.
Select the Snyk Organization and Snyk Projects for which you wish to correlate the results and run the scan.
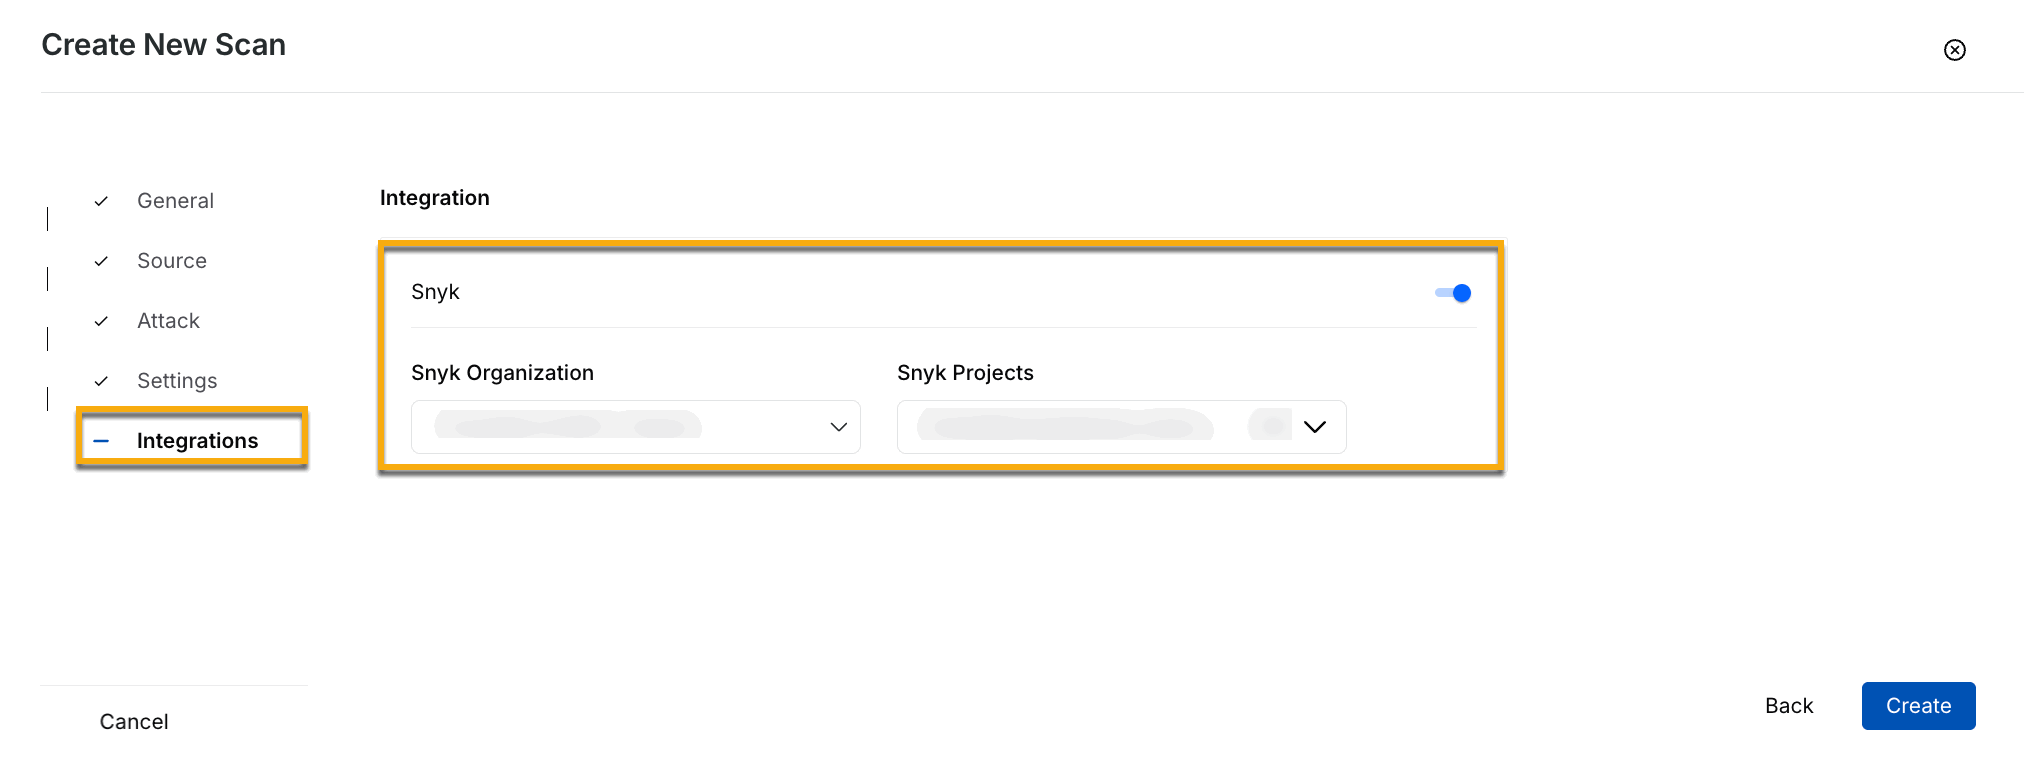
Enabling Snyk Integration
Correlate Issues with Snyk
The security issues detected during the scan are shown in the Issues tab on the Scan Details page.
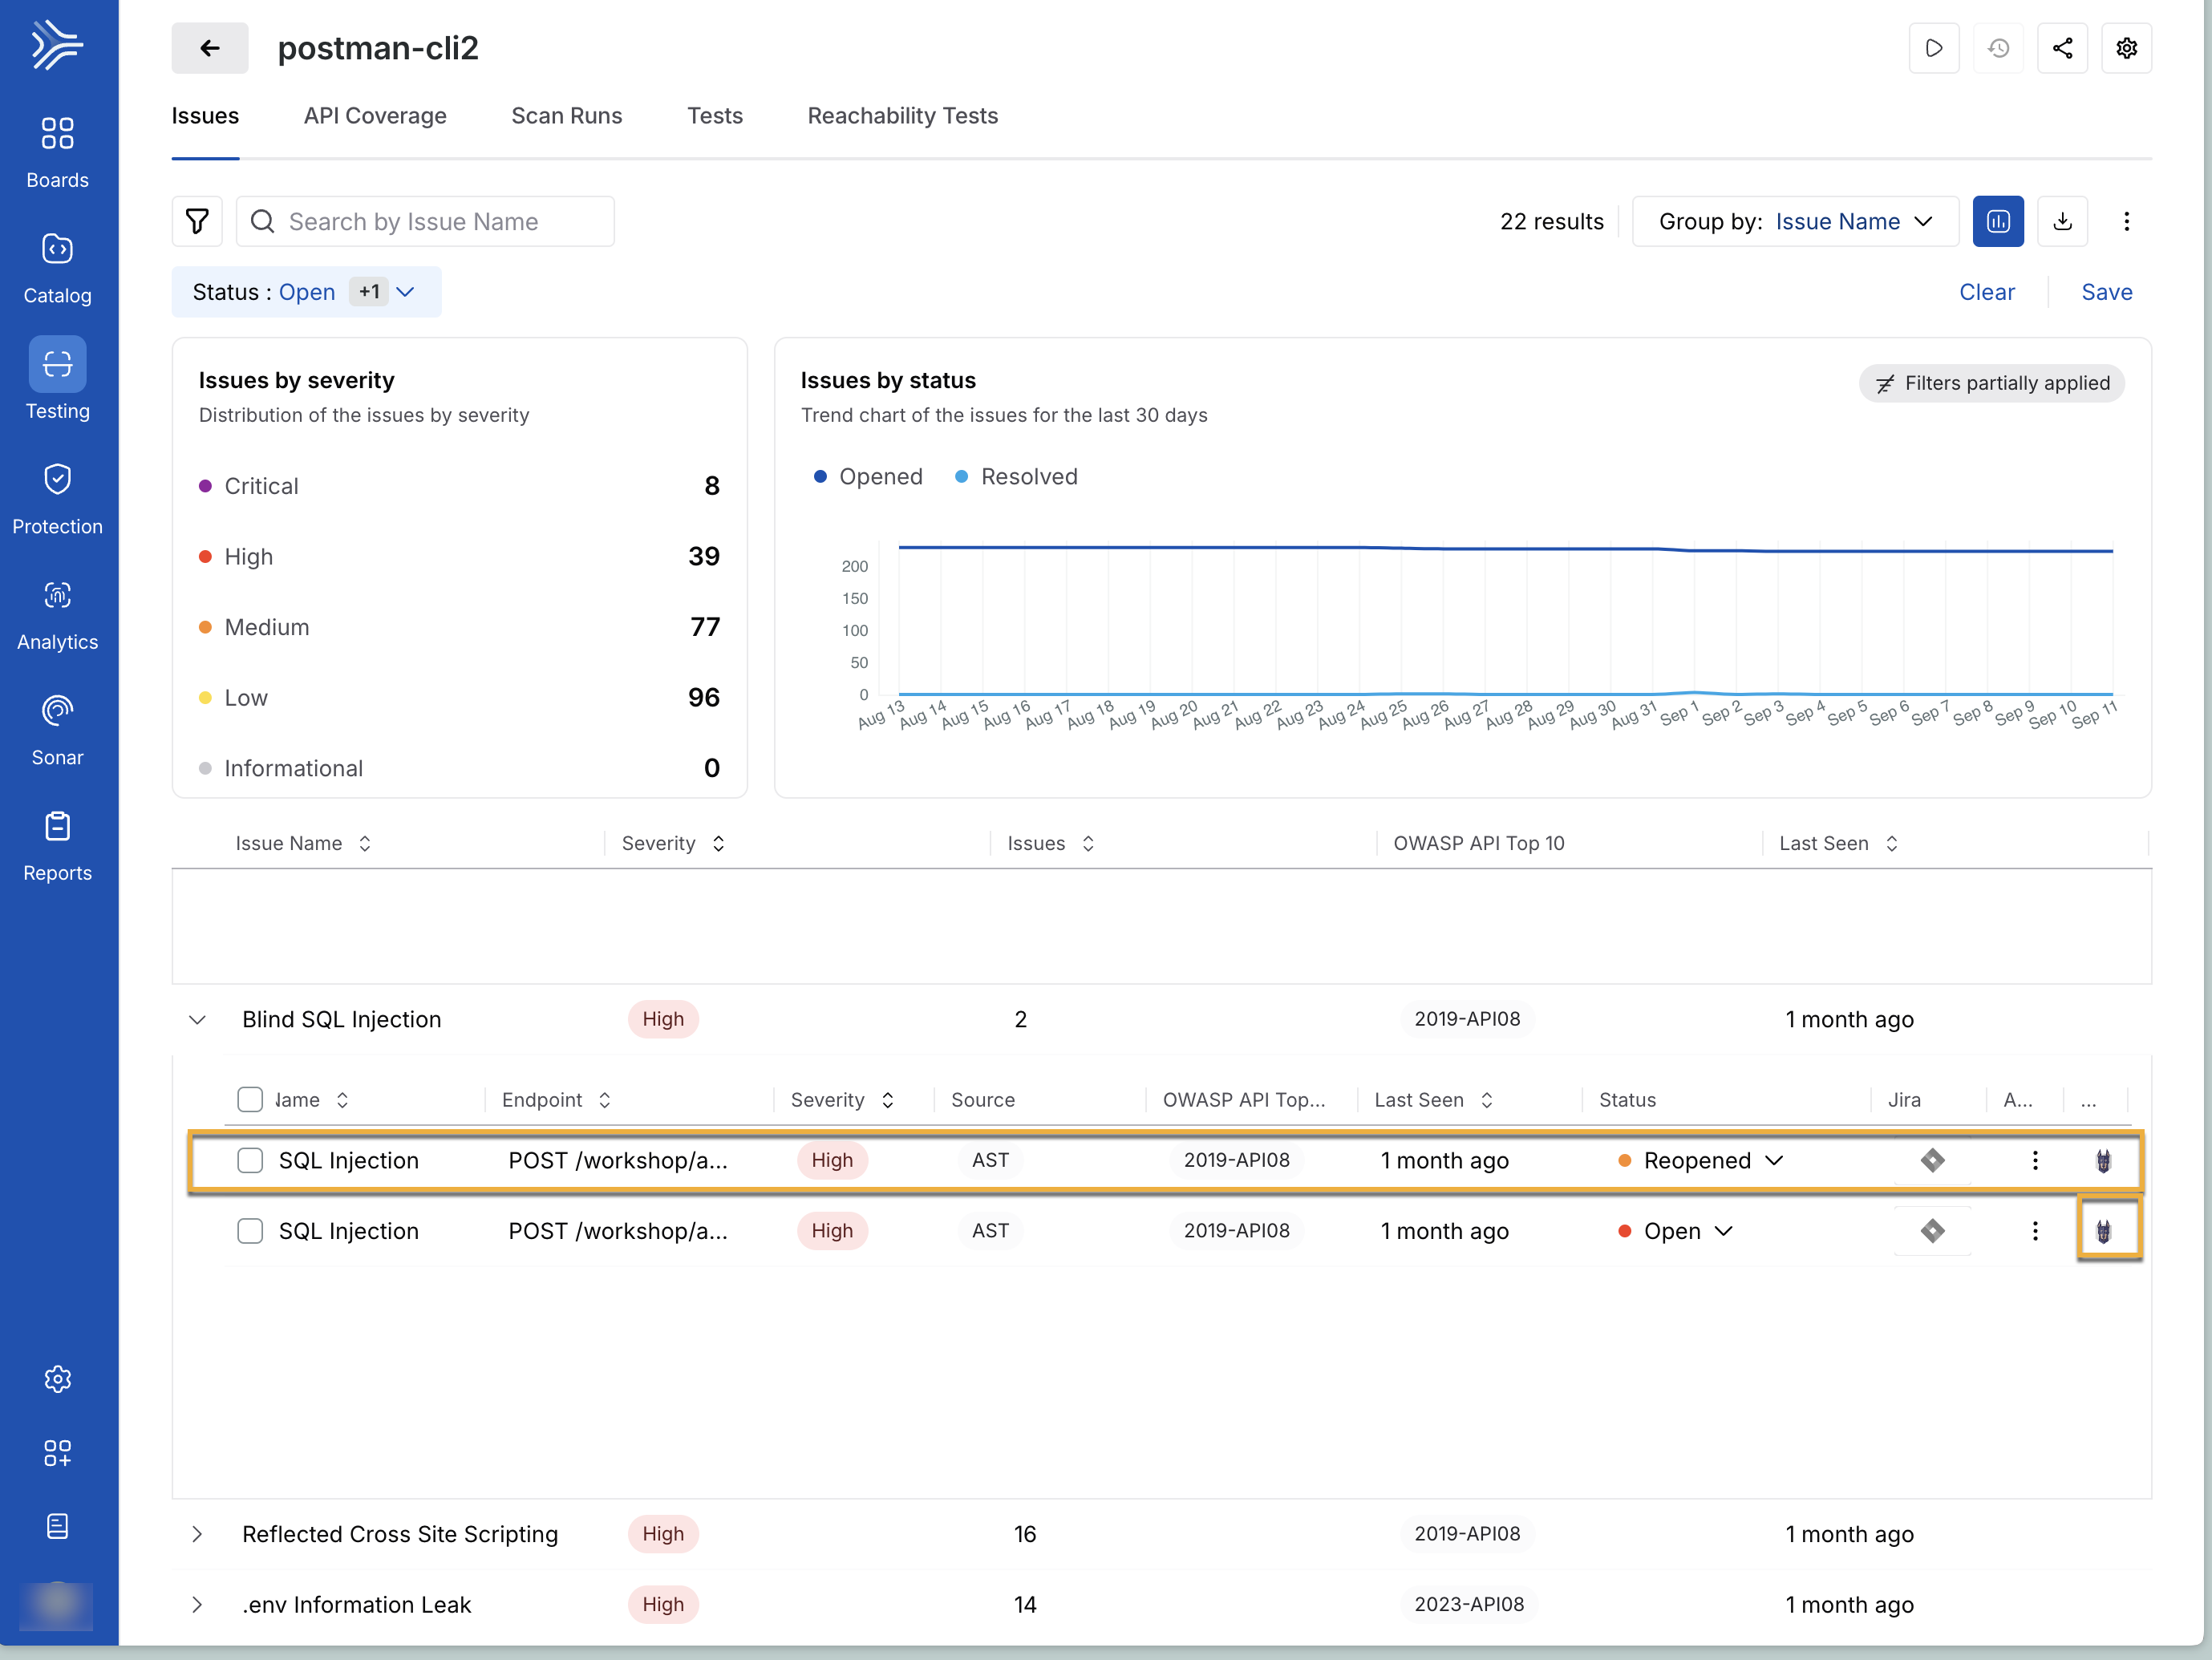
Scan Details
You can click any Issue Name to get its detailed report, as shown below.
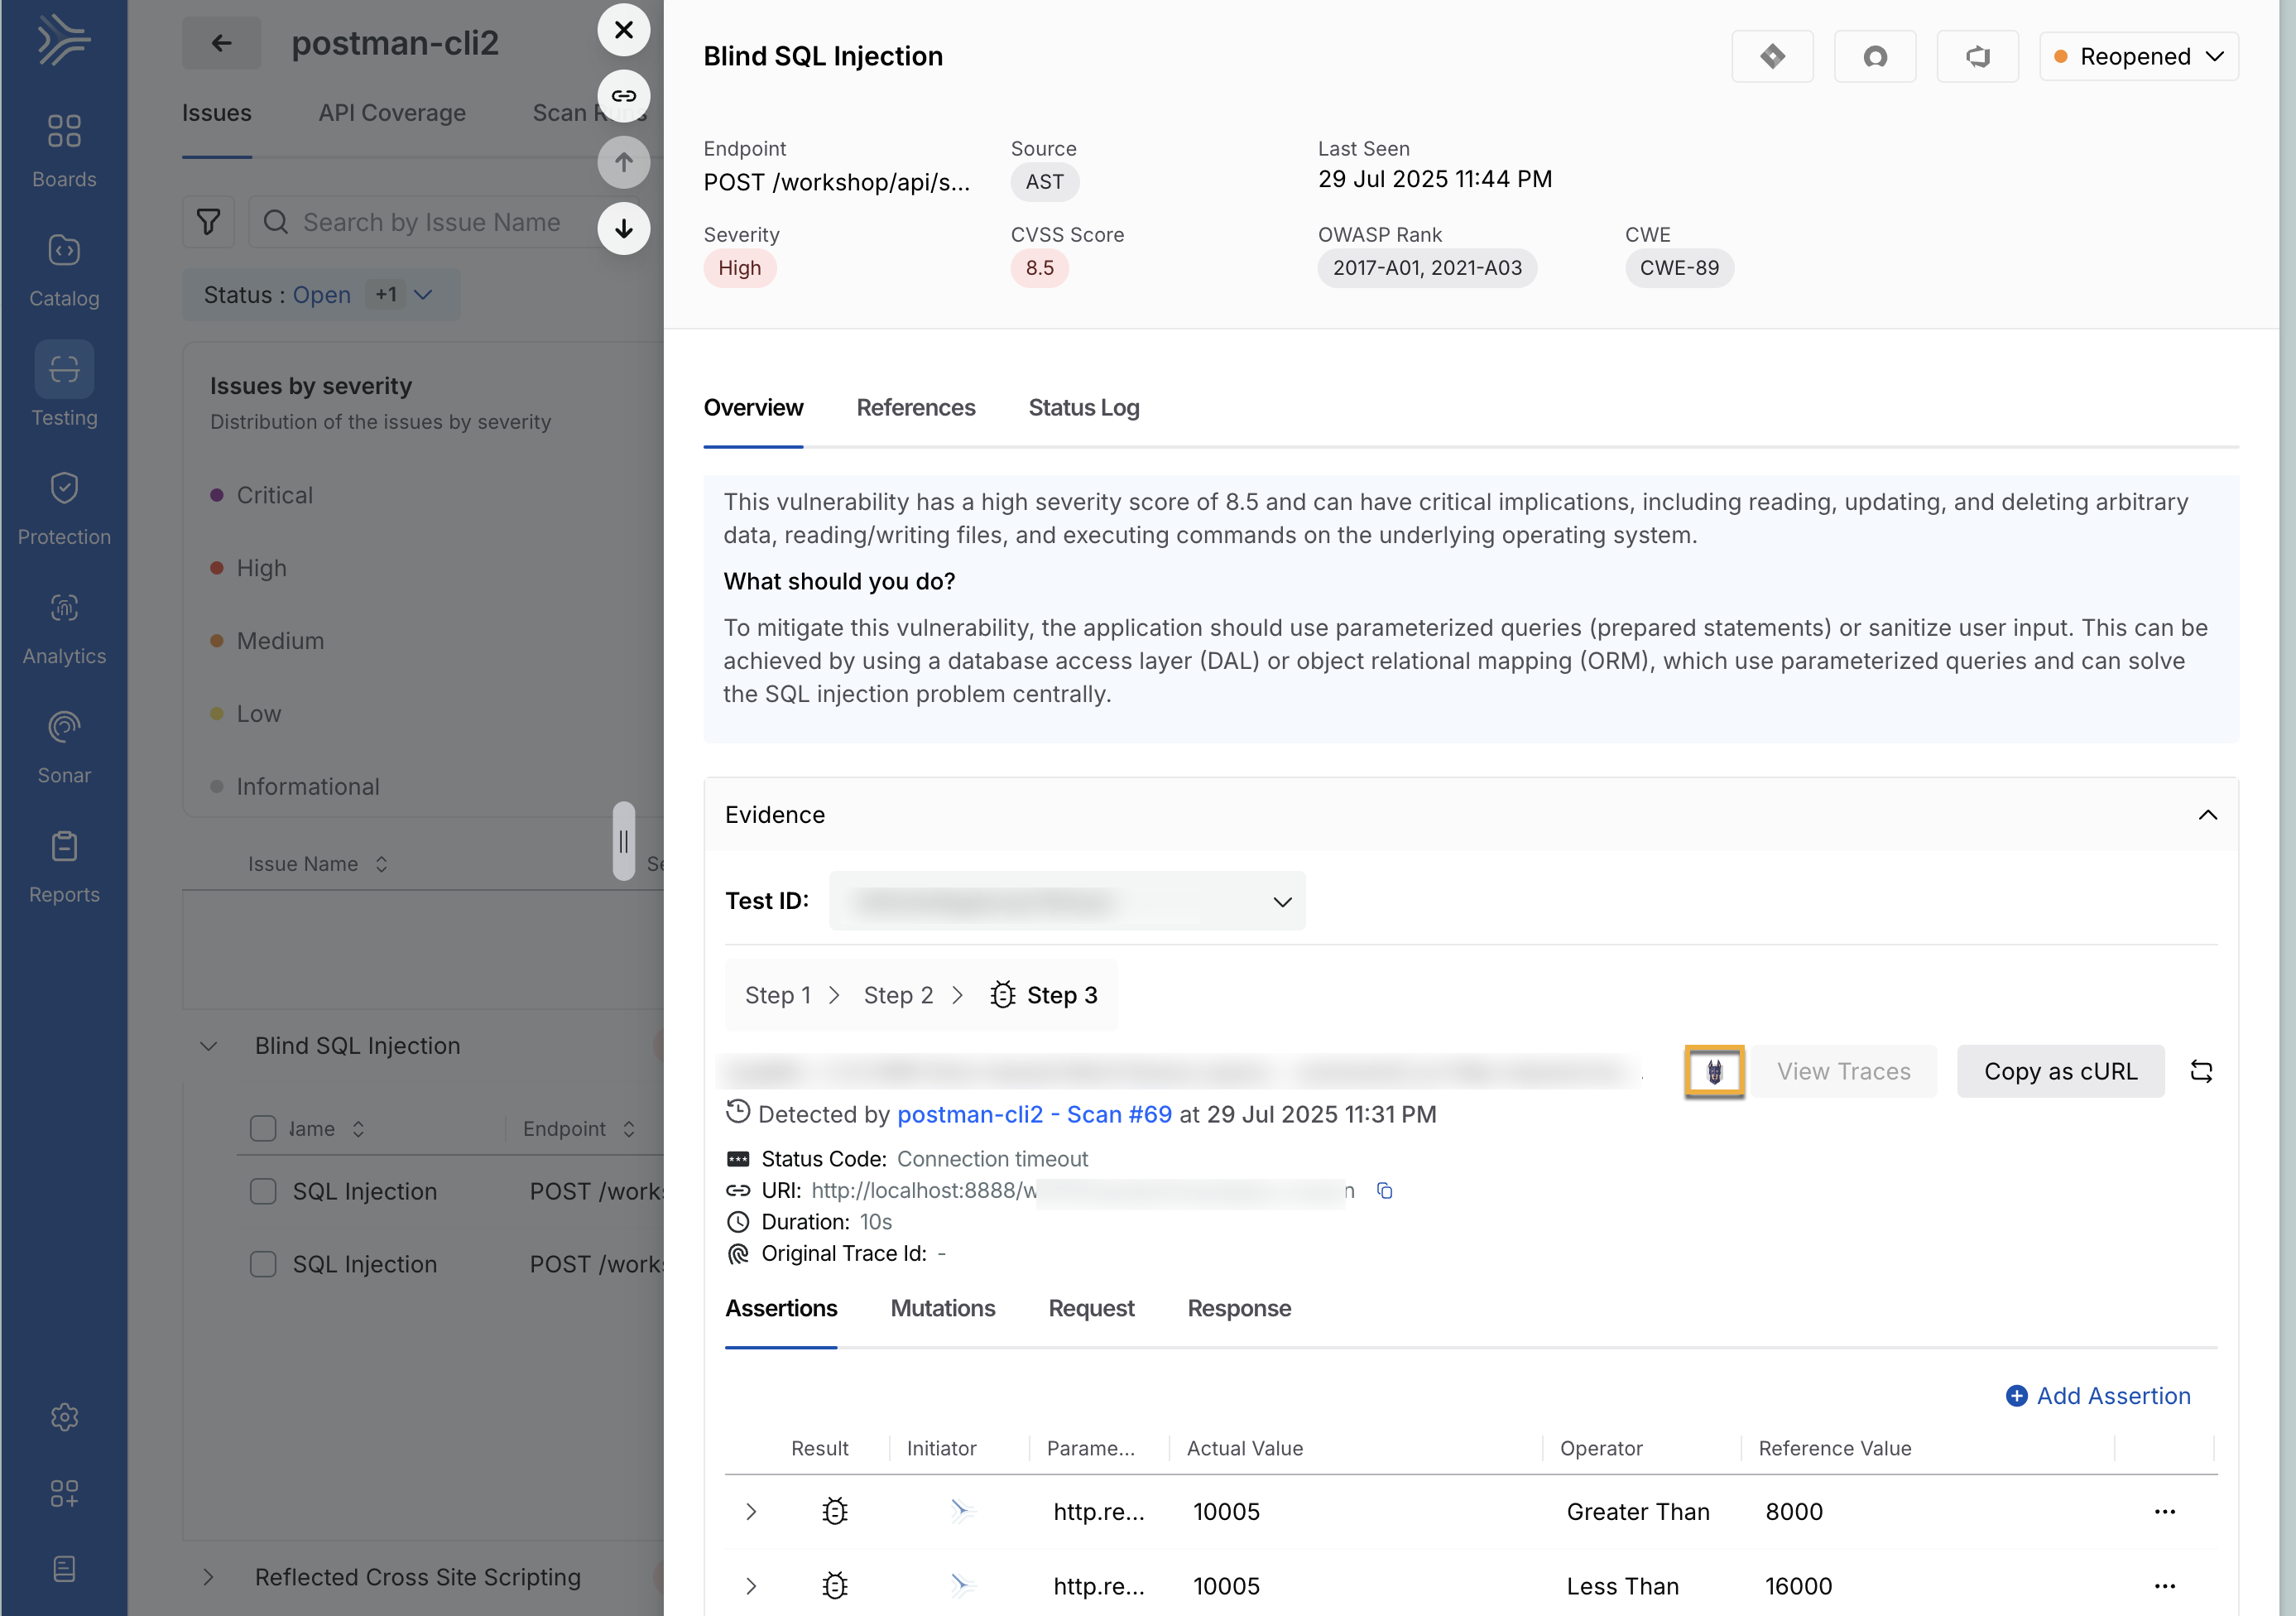
Issue (vulnerabilities) Details
The Issue Detailed View window shows the API Endpoint where Traceable identified the issue. You can click an API endpoint to view its Evidence. The Snyk icon on this page is enabled if there are any correlations between issues found during the test and Snyk-identified code issues; otherwise, it is not visible.
Evidence and Snyk details
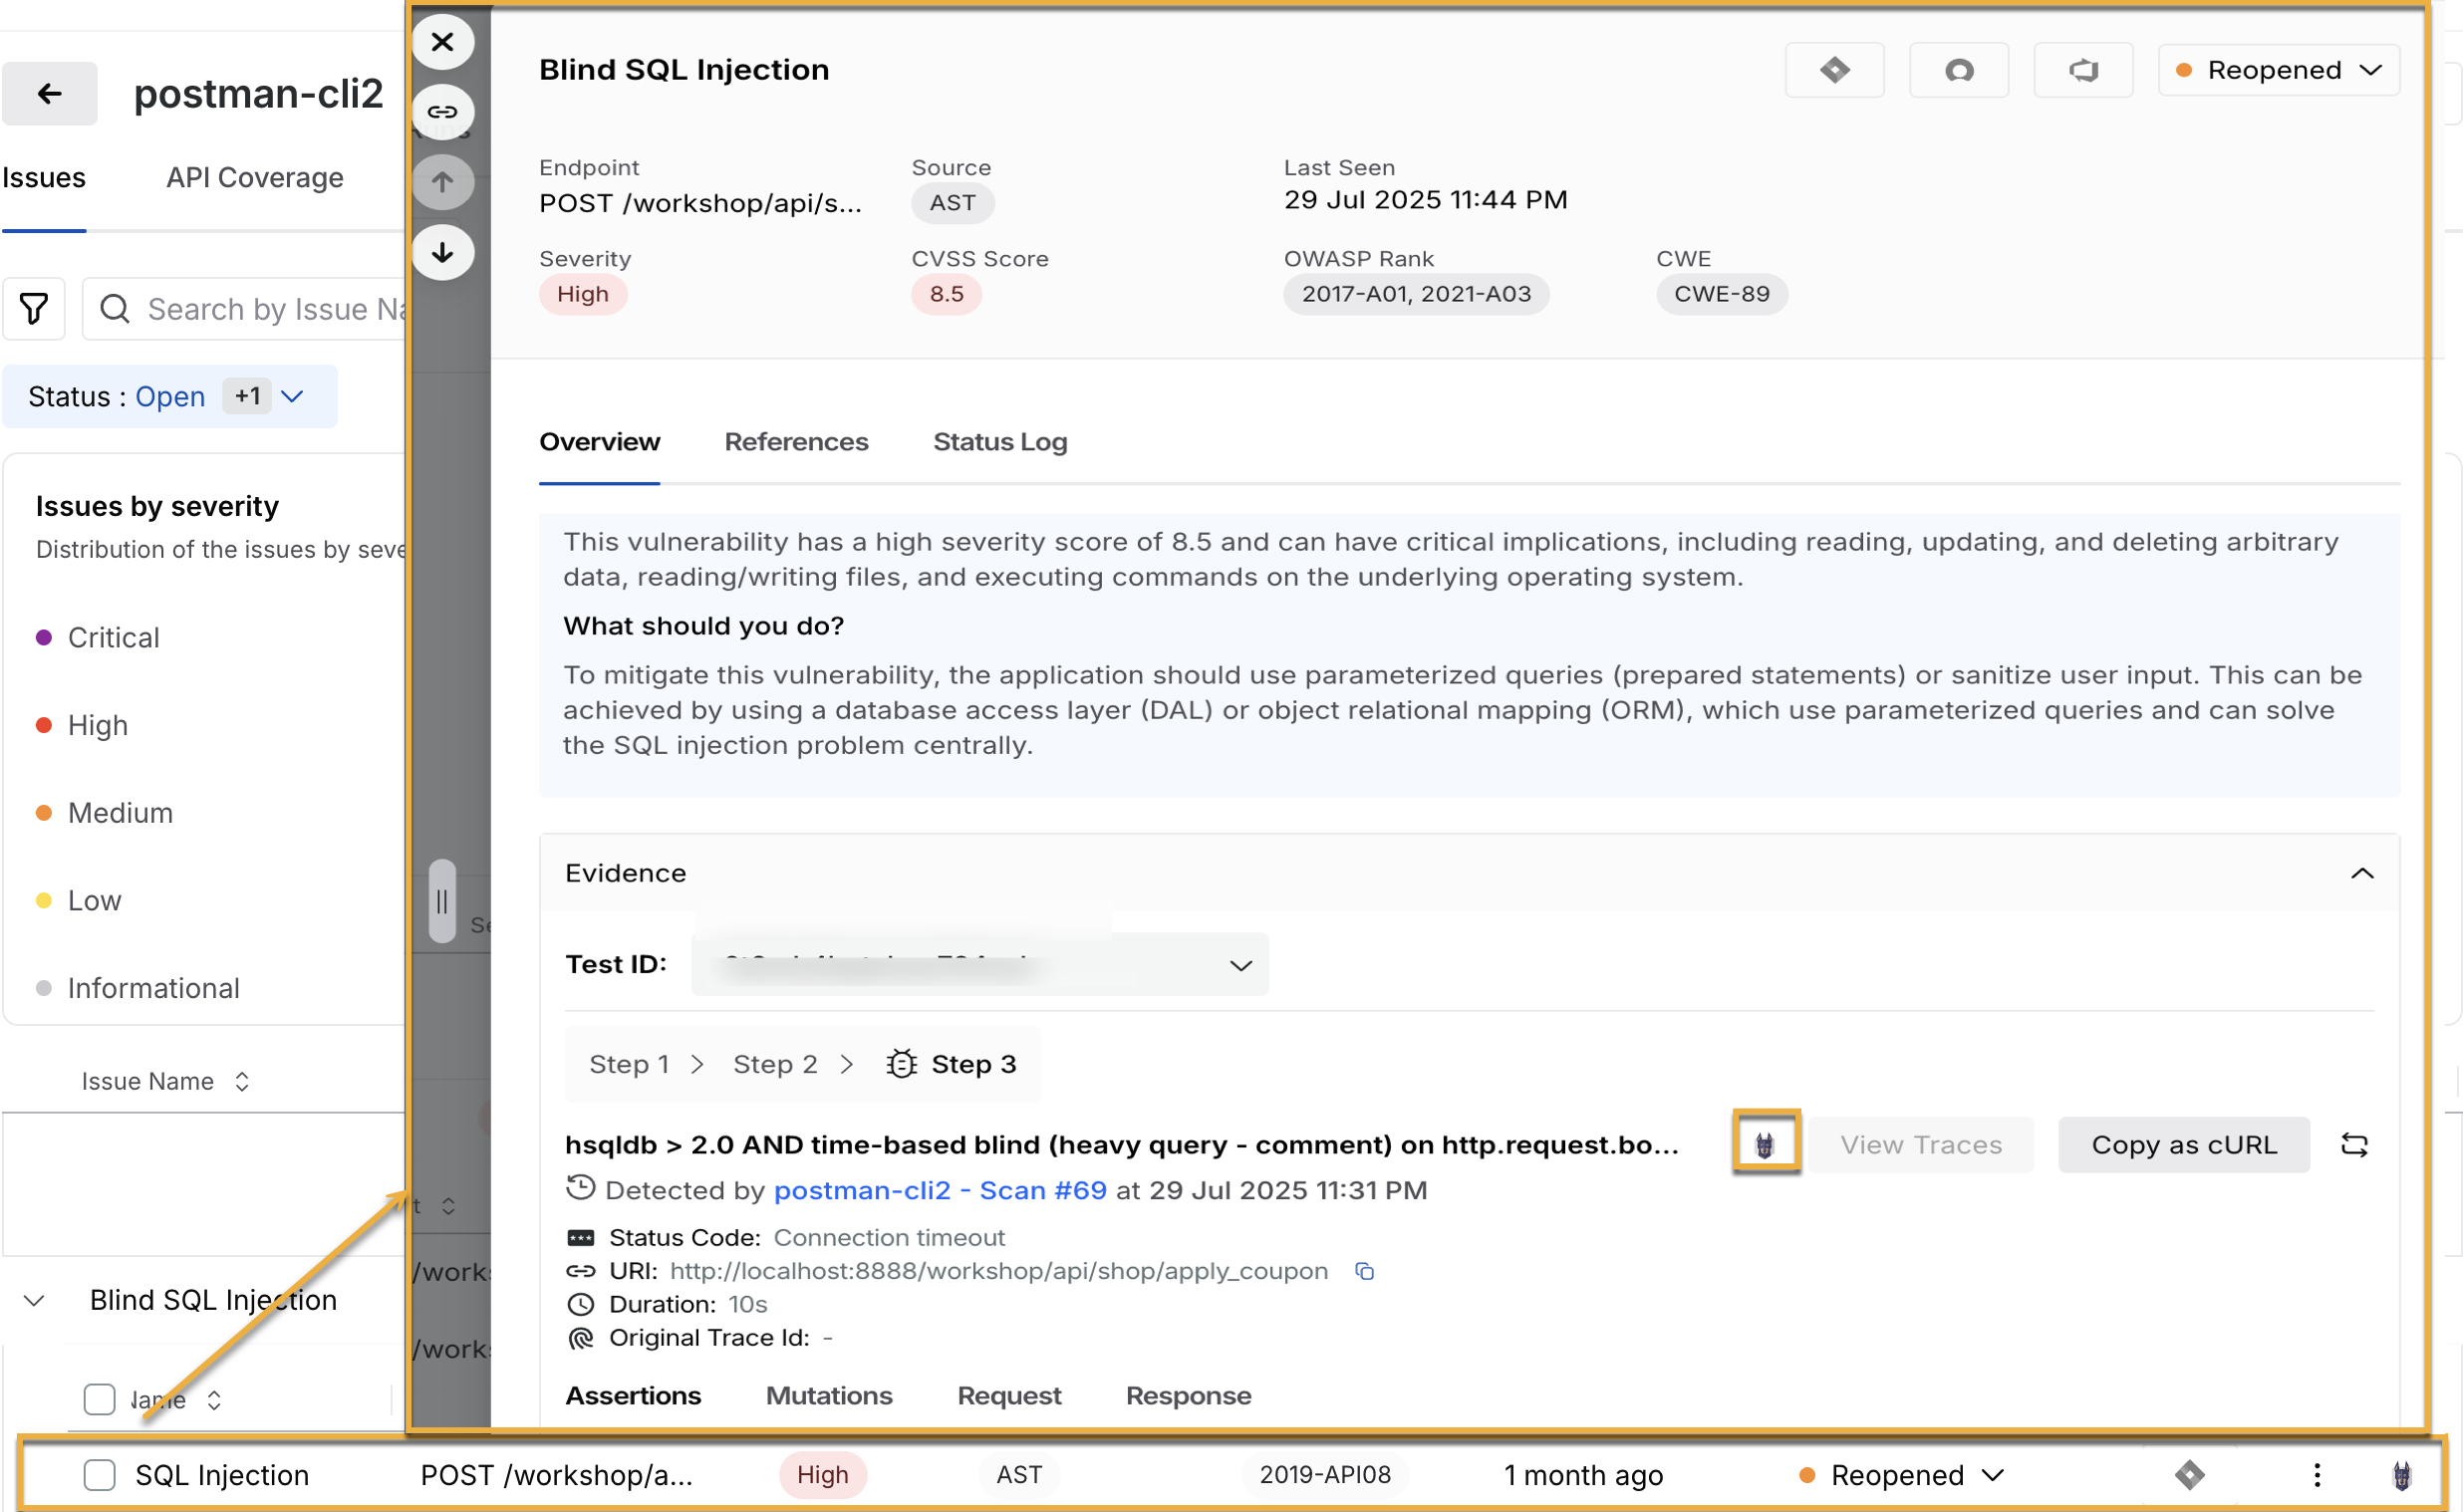
Click the Snyk (![]() ) icon to view the detailed analysis. For example, when you click on the Snyk icon for Blind SQL Injection, you are redirected to the Snyk Code Analysis window where the issue is displayed. It indicates that line number 388 in your code has an issue. On this page, you can either Ignore the issue or view the detailed code by clicking View details.
) icon to view the detailed analysis. For example, when you click on the Snyk icon for Blind SQL Injection, you are redirected to the Snyk Code Analysis window where the issue is displayed. It indicates that line number 388 in your code has an issue. On this page, you can either Ignore the issue or view the detailed code by clicking View details.
.png)
Snyk Code Analysis