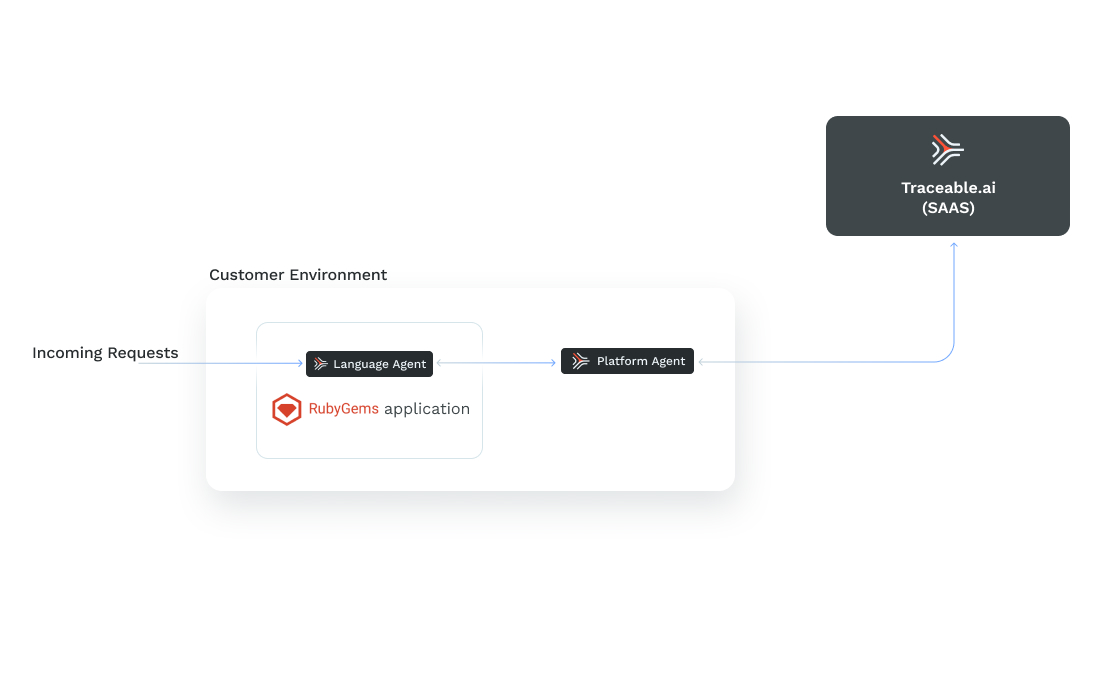
Traceable's Ruby tracing agent is an in-app tracing agent. It collects information from your Ruby application and sends it to Traceable's platform agent. The platform agent sends the information to Traceable's SaaS platform for further analysis. The topic covers deployment, verification, troubleshooting, and uninstall information. Following is a high-level deployment diagram for Traceable's ruby agent:
Before you begin
Make a note of the following points before you proceed with the deployment:
Make sure that Traceable's platform agent is already installed. For more information, see Platform agent.
Ensure your application is built on Ruby's version 2.7.x, 3.0.x, 3.1.x, and 3.2.x
Ruby agent uses OTLP exporter; hence, the default exporter port is 4318.
Basic knowledge of Ruby commands. For more information, see RubyGems basics.
Supported libraries
Traceable's Ruby agent supports the following libraries:
Rails: v5.0.0+
ActionPack
ActionView
ActiveRecord
ActiveSupport
Sinatra: v2.0.0+
http.rb
faraday
rest-client
net::http
pg
mysql2
mongo
Install Ruby agent
You can install Traceable's Ruby agent in one of the following two ways:
Option 1
Traceable's Ruby agent is available on Rubygems.org. You can install it by entering the following command:
gem install hypertrace-agentOption 2
You can also install Traceable's Ruby agent by adding it to your application's Gemfile. For example,
source "https://rubygems.org"

gem 'hypertrace-agent'
Install the agent by entering the following command to install it using Bundler:
bundle installInstrument applications
The following sections provide examples of instrument Rails and Sinatra applications.
Instrument a Rails application
To instrument a Rails application, create an initializer; for example,
config/initializers/hypertrace.rbInside the initializer, add the following:
require 'hypertrace'

Hypertrace::RubyAgent.instrument!
Instrument a Sinatra application
Sinatra is an open-source software web application library and domain-specific language written in Ruby. To instrument a Sinatra application with Traceable's Ruby agent, add the following lines to the application's main entry point:
require 'hypertrace'
Hypertrace::RubyAgent.instrument!
Traceable agent configuration
You can configure the Ruby agent through a configuration file or environment variables.
Using configuration file
Following is a sample configuration file with default values to configure Traceable agent:
service_name: rubyagent
reporting:
  endpoint: http://localhost:4318/v1/traces
  secure: false
  trace_reporter_type: OTLP
data_capture:
  http_headers:
    request: true
    response: true
  http_body:
    request: true
    response: true
  rpc_metadata:
    request: true
    response: true
  rpc_body:
    request: true
    response: true
  body_max_size_bytes: 131072
propagation_formats: ["B3"]
The service_name in the configuration file is the service name with which you identify the Ruby application in Traceable Platform. You can also use your own configuration file by setting the environment variable HT_CONFIG_FILE with a value of path to the file.
Using environment variable
You can also configure the Traceable agent using the environment variable. Add HT_ followed by the configuration field name. For example,
HT_SERVICE_NAMEHT_REPORTING_ENDPOINTHT_REPORTING_TRACE_REPORTER_TYPEHT_DATA_CAPTURE_HTTP_HEADERS_REQUESTHT_BODY_MAX_SIZE_BYTESHT_PROPAGATION_FORMATS
Once you have configured Traceable's Ruby agent, send traffic to the Ruby application. If the installation is successful, you will see traces in the Traceable Platform, as shown in the Verification section.
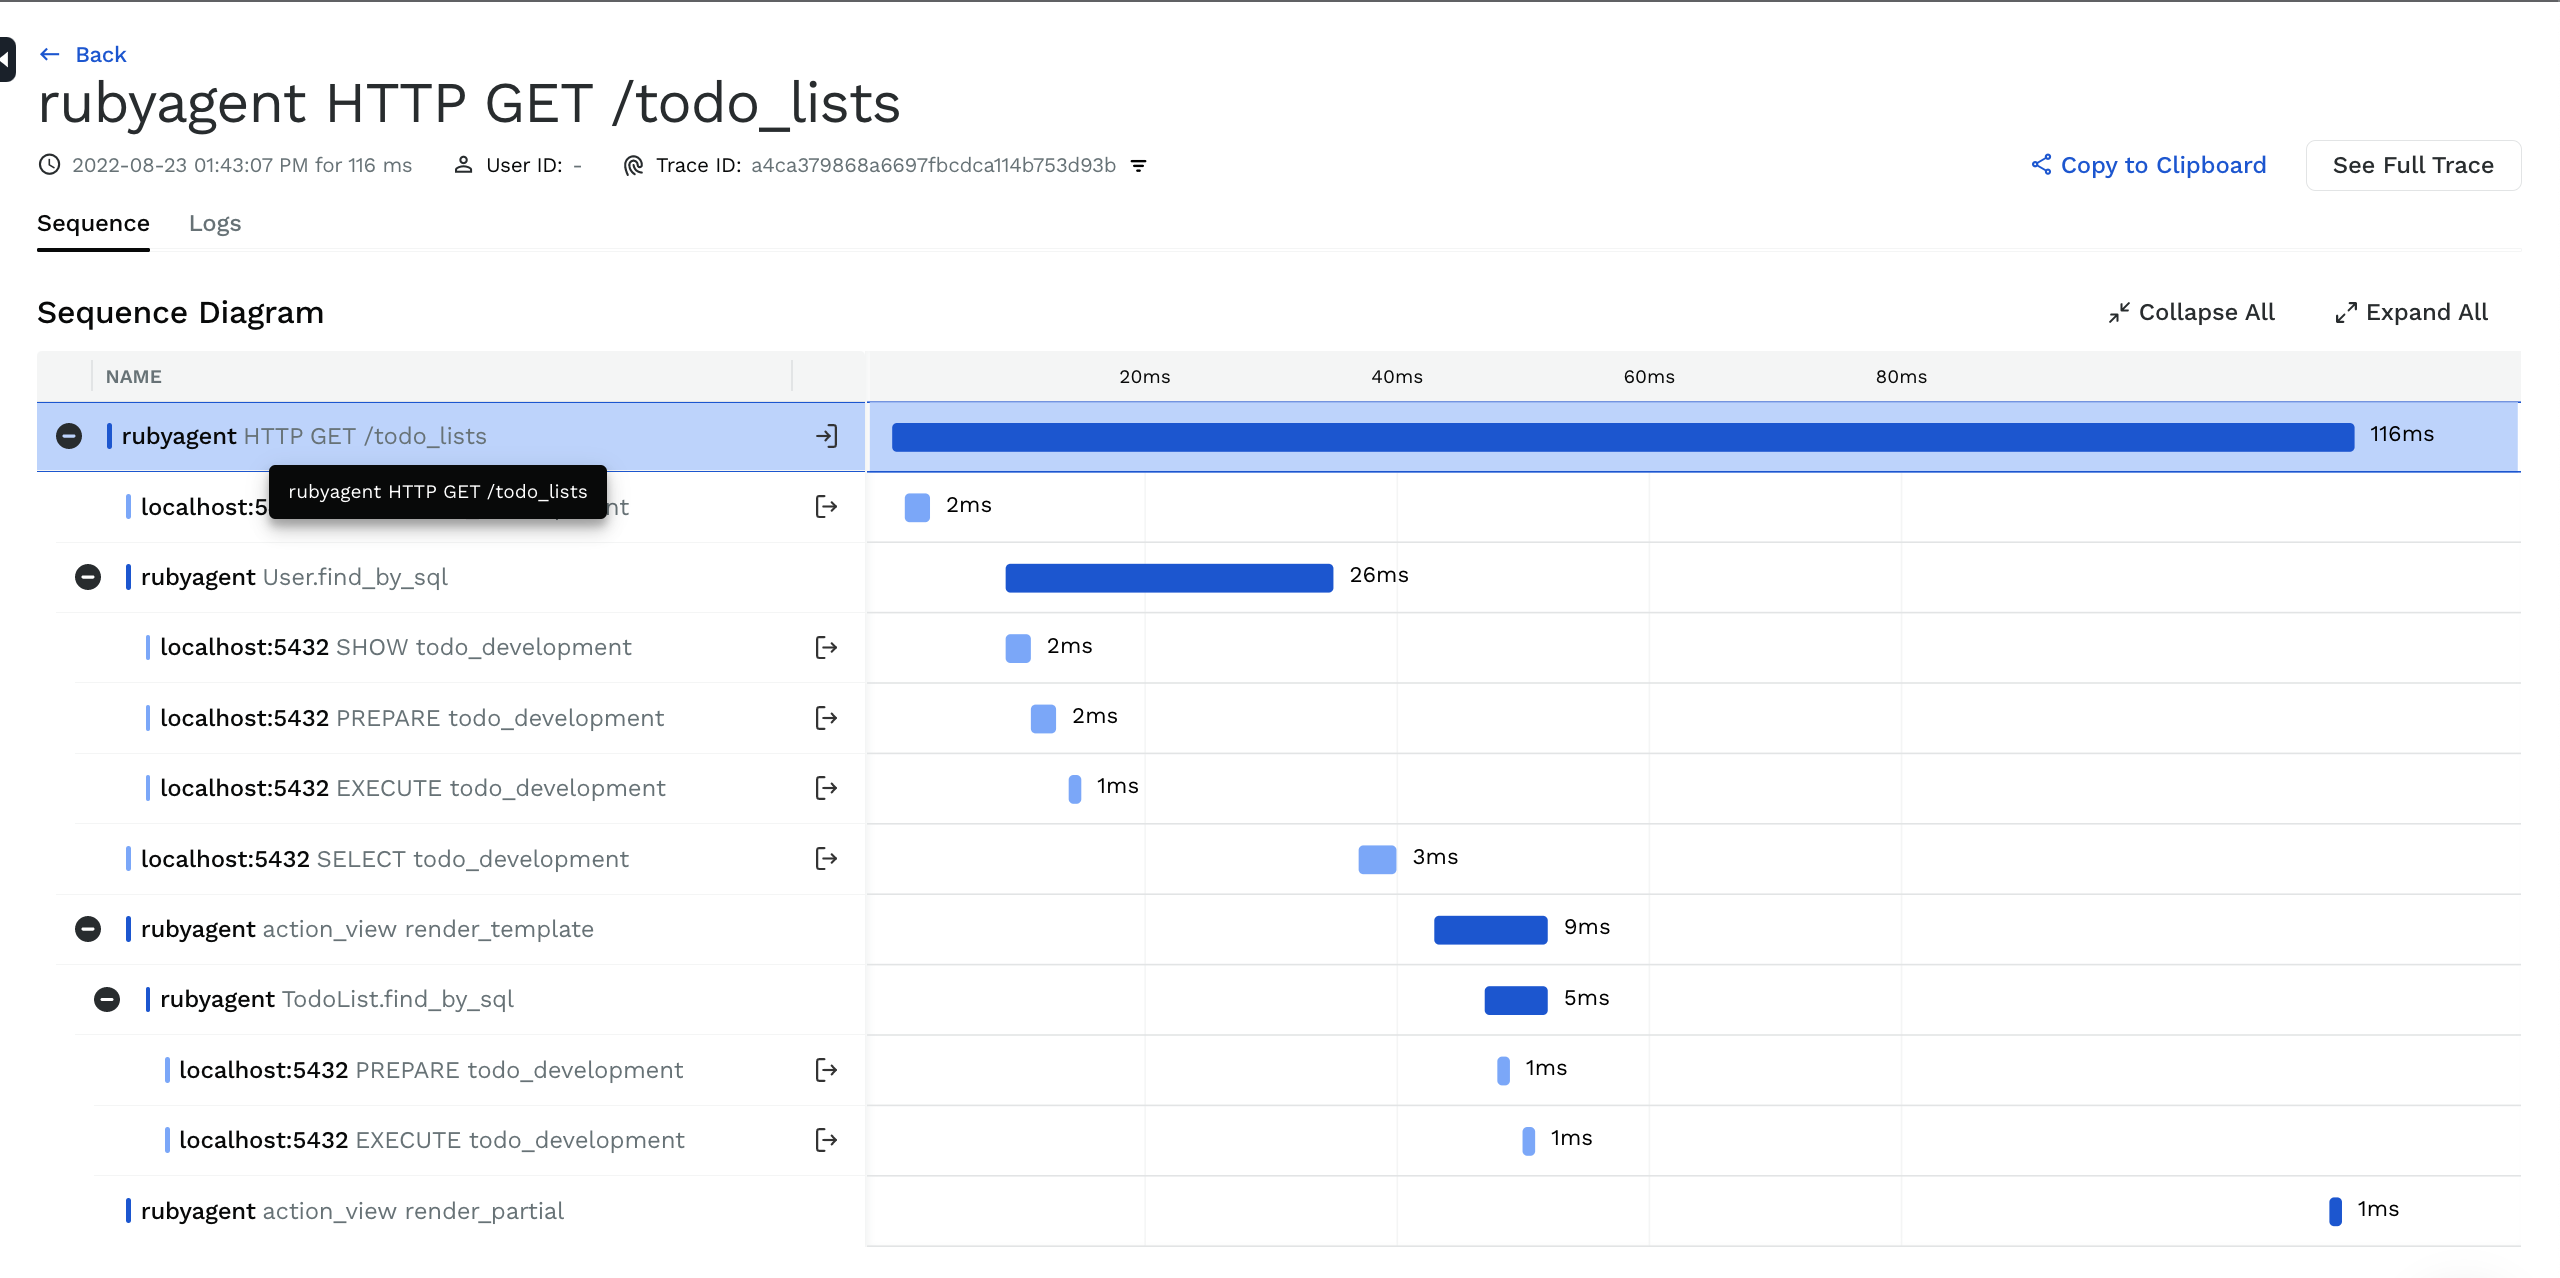
Verification
To verify a successful installation, login to Traceable Platform and navigate to API Catalog → Services. Find the service name you configured during Traceable agent configuration and click on it. Click on the Traces tab to view the traces. You can click on a trace to view detailed information about the trace. For example, as shown in the screenshot below:
Uninstall
You can uninstall Traceable's Ruby agent by entering the following command:
gem uninstall hypertrace-agentAfter you have run the above command, remove the following line from your application's Gemfile:
gem "hypertrace-agent"Troubleshooting
If you do not see any data in Traceable's platform after a few minutes:
Make sure that the instrumented Ruby application is receiving traffic.
Check whether Traceable's platform agent has the correct agent token configured. You can copy the agent token by logging into your Traceable platform and navigating to Settings(
 ) → Account → Agent token.
Check the Traceable platform agent logs for any connectivity issues or errors. You can view the logs by navigating to
/var/traceable/log/.Check the Ruby tracing agent logs for any connectivity issues or errors. You will have to change the log level to
DEBUGby setting,ENV TA_LOG_LEVEL DEBUG, and restarting the application. For example, in the case of a K8s application, you can configure this in thedockerfile.
If you need further assistance, reach out to Traceable support.