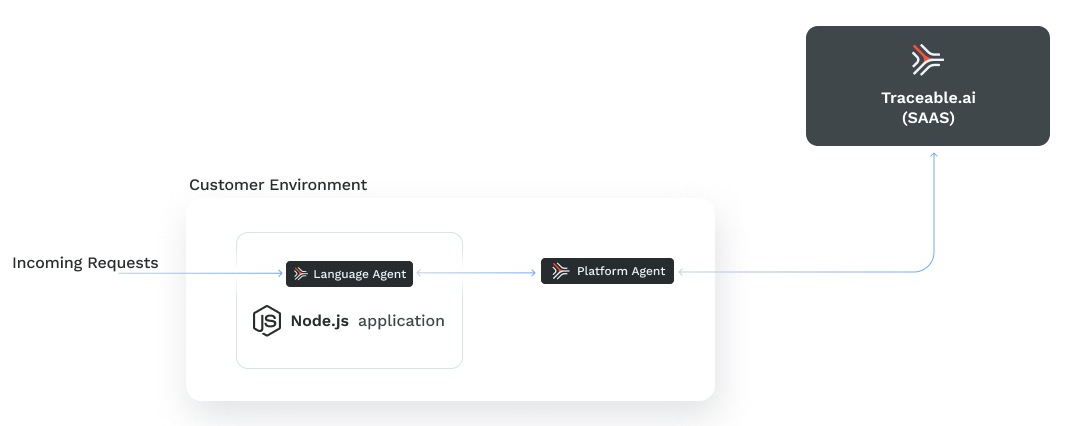
Traceable's Node.js tracing agent is an in-app tracing agent. It collects information from your Node.js application and sends it to Traceable's platform agent. The platform agent sends the information to Traceable's SaaS platform for further analysis. The topic covers deployment, verification, troubleshooting, upgrade, and uninstall information.
Before you begin
Make a note of the following points before you proceed with the deployment:
Make sure that Traceable's platform agent is already installed. For more information, see Platform agent.
Your Node.js application must be using Node 8.17 or later.
Traceable's Node.js tracing agent package comes with pre-compiled extensions that support the following:
Supported operating system
The following operating systems are supported:
Debian 10 and later.
Ubuntu 18.0.4 and later.
CentOS 7 and later.
Alpine 3.9 and later. You would need Traceable Platform agent 1.21.2 or later for blocking support on Alpine.
Supported frameworks
The following frameworks are supported:
Hapi - version 17 and later.
Express - version 4 and later.
Sails - version 1 and later.
NestJS - version 4 and later.
Koa - version 2 and later.
Supported database libraries
The following database libraries are supported:
mysql - version 2 and later.
mysql2 - version 2 and later.
Postgres - 7.* and 8.*
MongoDB - version 3.3 and later and earlier than 4. MongoDB 4 and later is not supported.
Other libraries
A few other supported libraries:
HTTP and HTTPS (these are a part of node.js standard library)
GraphQL - version 14 and later
Download
The package is downloaded as part of the installation process through npm.
Installation
To install Traceable's Node.js tracing agent, enter the following command. The package is downloaded and installed as part of the installation process.
npm install @traceable/nodejsagent --saveThe --save option instructs NPM to include the package inside the dependencies section of your automatically package.json.
Make sure that the package.json has the following entries:
  "dependencies": {
    "@traceable/nodejsagent": "1.7.0",
    ... # rest of your dependencies go here
  }
Configuration
You can configure Traceable's Node.js tracing agent using one of the following methods:
Using a configuration file
Using environment variables
Note
Environment variables take precedence over values set through the configuration file.
Configure using a configuration file
Using a configuration file to configure the Node.js tracing agent comprises two steps:
Configuring the file
Setting the environment variable for the configuration file
Step 1 - Configure the file
Create a config.yaml file as shown below:
service_name: enter_a_service_name_here
reporting:
  endpoint: http://agent.traceableai:4317 # update to point to a TPA
opa:
  endpoint: http://agent.traceableai:8181/ # update to point to a TPA
blocking_config:
  enabled: true
  remote_config:
    endpoint: agent.traceableai:5441 # update to point to a TPA
Following is a sample config.yaml file:
service_name: nodeagent
reporting:
  endpoint: http://localhost:4317
  secure: false
  trace_reporter_type: OTLP
  cert_file:
data_capture:
  http_headers:
    request: true
    response: true
  http_body:
    request: true
    response: true
  rpc_metadata:
    request: true
    response: true
  rpc_body:
    request: true
    response: true
  body_max_size_bytes: 131072
  body_max_processing_size_bytes: 1048576
propagation_formats: ["TRACECONTEXT"]
enabled: true
resource_attributes: { }
opa:
  enabled: true
  endpoint: http://opa.traceableai:8181/
  poll_period_seconds: 60
blocking_config:
  enabled: true
  debug_log: true
  evaluate_body: true
  skip_internal_request: false
  cert_file:
  modsecurity:
    enabled: true
  regionBlocking:
    enabled: true
  remote_config:
    enabled: true
    endpoint: localhost:5441/
    poll_period_seconds: 30
Step 2 - Set the environment variable
Set the environment variable TA_CONFIG_FILE. Use the path of the configuration file you created in step 1 as the value for the environment variable. For example, TA_CONFIG_FILE=./config.yaml.
Configure using the environment variable
If you wish to use environment variables, prepend TA to the YAML field you wish to set. For example, to set the service name, you would set TA_SERVICE_NAME=your_service_name.
The following table details the full list of supported environment variables:
Name | Default | Description |
|---|---|---|
|
| When |
| Represents the endpoint for polling OPA configuration file, for example, http://opa.traceableai:8181/. | |
| 60 | The poll period in seconds to query the OPA service. |
|
| The top-level switch that enables or disables blocking functionality. |
|
| Enables verbose logging of the native extensions. |
|
| Represents the endpoint for reporting the traces.
|
|
| Determines whether the request body should be analyzed. |
|
| Enables IP-based blocking. |
|
| Denotes whether the configuration needs to be fetched from remote or not. |
| Denotes the agent endpoint to connect to for configuration. For example, localhost:5441. | |
| 30 | The poll period in seconds to query for configuration updates. |
|
| When set to |
|
| Identifies the service, for example, “my service.” |
| Configure the reporting endpoint. | |
|
| When set to |
| - | The path to the certificate file. |
| - | The path to the certificate file. |
|
| When set to |
|
| When set to |
|
| When set to |
|
| When set to |
|
| When set to |
|
| When set to |
|
| When set to |
|
| When set to |
| 131072 | Is the maximum size of captured body in bytes. Default should be 131_072 (128 KiB). |
| 1048576 | Defines the maximum body size processed by filters in bytes. For the uncompressed bodies, Traceable captures all bytes up to For compressed and GRPC bodies, if the size is larger than this, Traceable ignores it entirely; otherwise, the body is decompressed/decoded and then passed to the filter. |
|
| List the supported propagation formats, for example, |
|
| When |
|
| Controls granularity of produced logs, one of |
Add the agent to your application code
To enable in-app tracing, you must add the Traceable's tracing agent to your application code. You can instrument the Node.js tracing agent using one of the following two methods:
Auto instrumentation
Manual instrumentation
Important
You should use only one method to instrument the application. Do not use both methods at the same time.
Auto instrumentation
To auto-instrument your Node.js application with the tracing agent, modify your application startup command to use the -r option. For example:
node -r @traceable/nodejsagent server.jsImportant
If using ES6 import syntax in your application, you must use auto instrumentation instead of manual instrumentation. For example, import express from 'express' instead of const express = require('express'). The former requires auto instrumentation.
Manual instrumentation
To manually instrument your Node.js application, add the following lines of code to your application's main entry file:
const traceable = require('@traceable/nodejsagent');
const traceableAgent = new traceable.TraceableAgent()
traceableAgent.instrument() # adds observability instrumentation
traceableAgent.addTraceableFilter() # adds traceable blocking features
Run your application
Run your application with the tracing agent. Complete the following:
If you have used auto instrumentation
ActionScript
TA_CONFIG_FILE=./config.yaml TA_LOG_LEVEL=DEBUG node -r @traceable/nodejsagent server.jsIf you have manually instrumented your application
ActionScript
TA_CONFIG_FILE=./config.yaml TA_LOG_LEVEL=DEBUG node server.js
The above commands use TA_LOG_LEVEL=DEBUG. This is optional; however, using this option would indicate whether everything is working as expected.
Verification
After you have exercised your application with traffic, navigate to Traceable platform and verify if your Node.js tracing agent is displayed.
Upgrade
To upgrade Traceable's Node.js tracing agent, enter the following command:
npm update @traceable/nodejsagentUninstall
If you wish to uninstall the tracing agent, enter the following command:
npm uninstall @traceable/nodejsagentTroubleshooting
Node.js dropping spans
If you observe that your Node.js application is not exporting the spans at a reasonable rate, or if the spans pass the queue size limits frequently, then customize the batch span processor using the environment variable defined in OpenTelemetry Environment Variable Specification. Specifically, configure the following two environment variables:
OTEL_BSP_MAX_EXPORT_BATCH_SIZEOTEL_BSP_SCHEDULE_DELAY