The Bot Protection Dashboard in Traceable provides a centralized view of bot-related activity across your application infrastructure. It helps security teams monitor automated threats, analyze traffic patterns, and assess the effectiveness of existing mitigation strategies. The dashboard enables more informed decision-making and ongoing refinement of bot protection policies by offering a clear breakdown of threat types, sources, and behaviors.
.png)
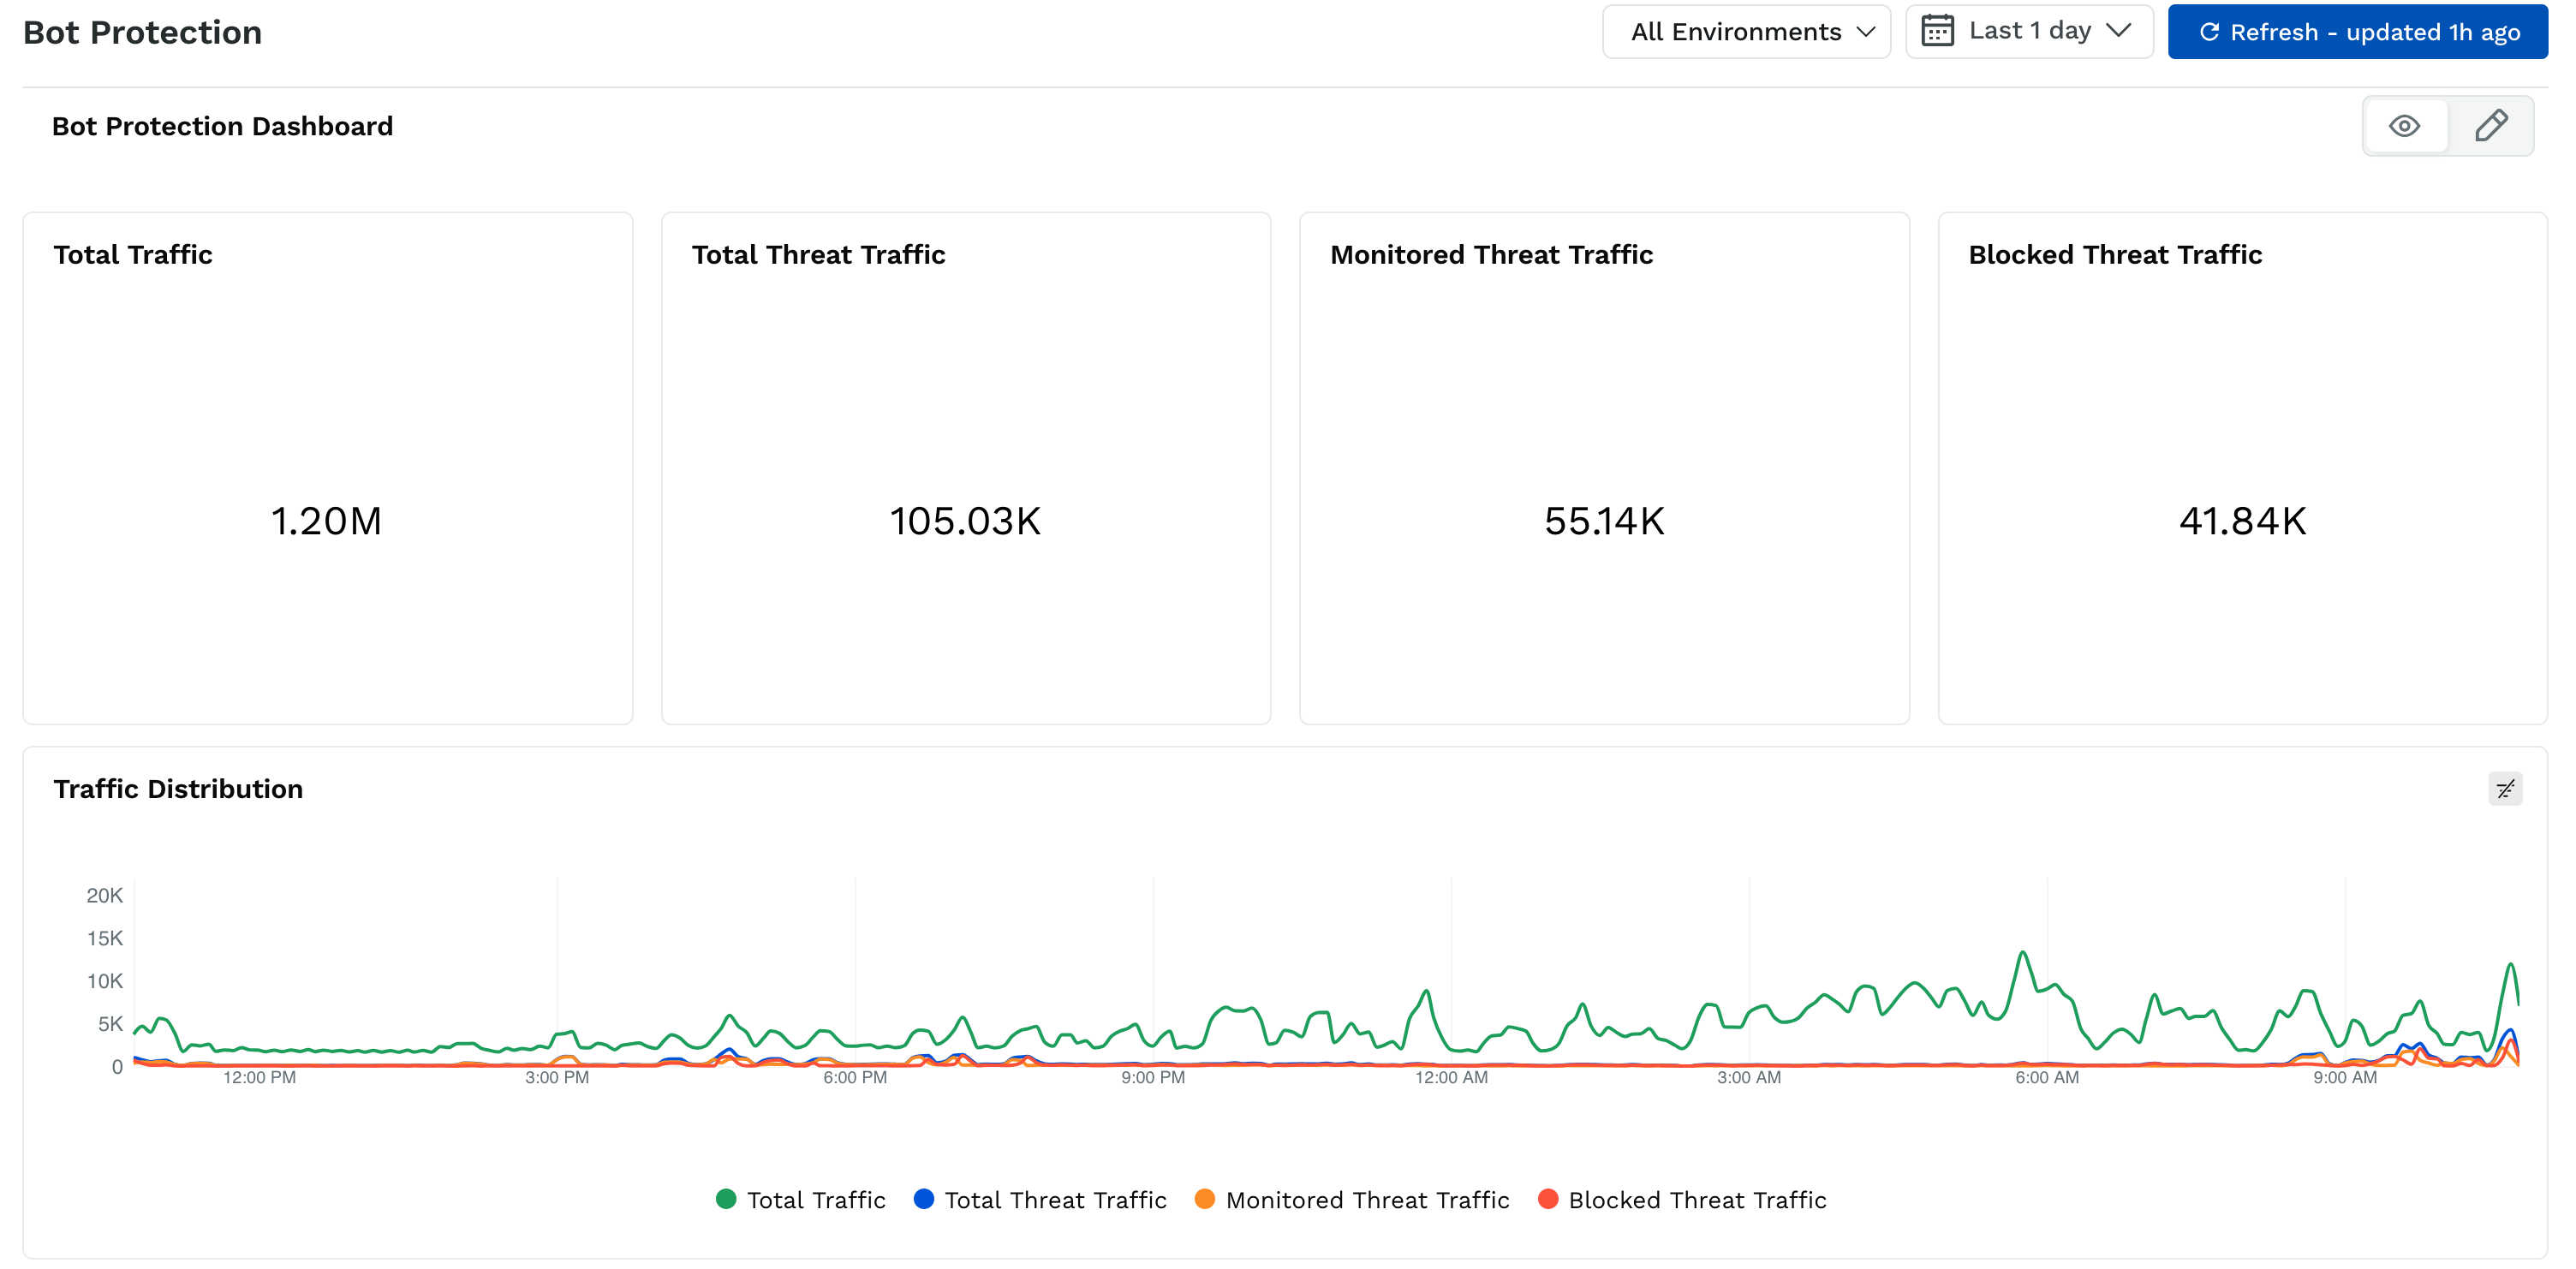
Traffic Overview and Distribution
At the top of the dashboard, you can see a high-level summary of your overall traffic and bot-related threats. This section provides a quick view of trends and anomalies.
Key Metrics
Total Traffic
Total number of incoming requests to your application.Total Threat Traffic
Number of requests identified as potential bot threats.Monitored Threat Traffic
Threat traffic detected but not blocked is typically used for observation before enforcement.Blocked Threat Traffic
Requests actively blocked by Traceable's bot protection policies.
Traffic Distribution Over Time
The time-series chart helps you visualize how different traffic categories evolve throughout the selected period. By clicking their respective labels below the graph, you can toggle the visibility of total traffic, total threat traffic, monitored threat traffic, and blocked threat traffic.
How to Use This Section
Use this section to:
Monitor your traffic load and the proportion attributed to bots.
Identify unusual spikes or sudden increases in threat traffic.
Compare blocked versus monitored traffic to fine-tune your mitigation settings.
Correlate traffic patterns with business hours or external events.
Threat Types and Bot Subcategories
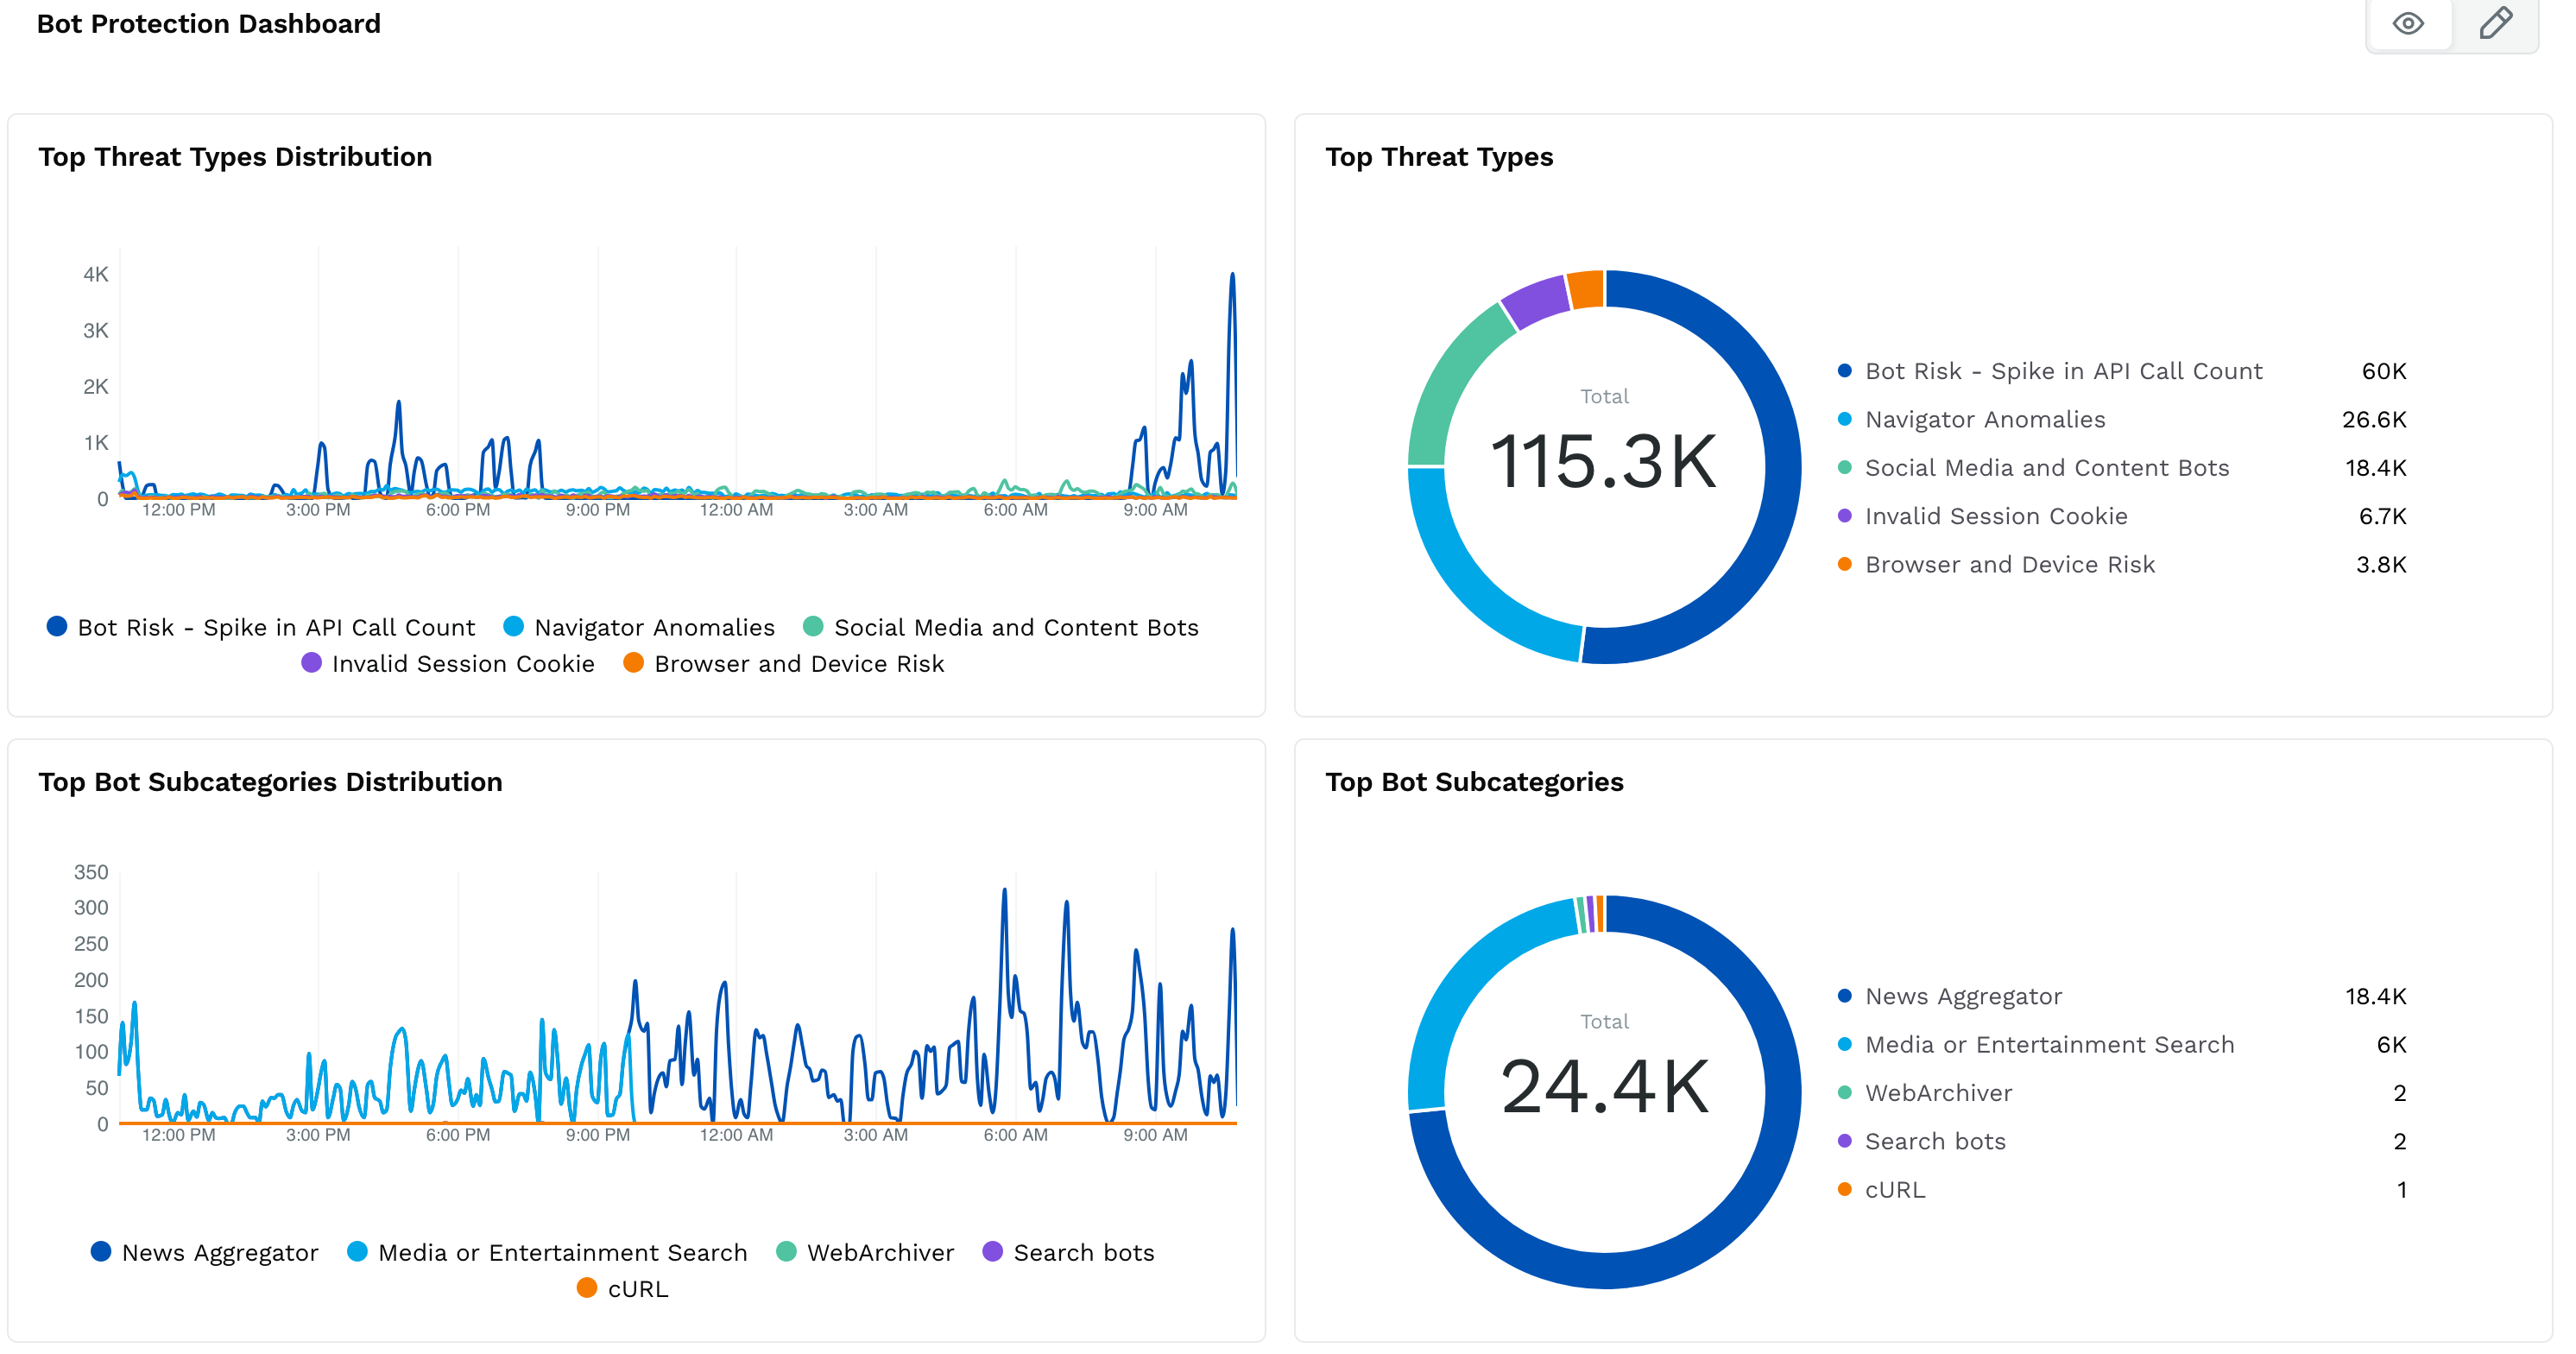
This section breaks down bot activity into specific threat types and behavioral subcategories, providing deeper insight into what kind of automation your system is facing.
Top Threat Types Distribution
This chart displays traffic trends associated with various bot threat behaviors, such as:
Bot Risk – Spike in API Call Count
Navigator Anomalies – Indicates inconsistencies in browser properties, often a sign of automation tools or headless browsers.
Social Media and Content Bots – Bots interacting with or scraping publicly available content like posts, articles, or listings.
Invalid Session Cookie – Suggests attempts to use expired or malformed session tokens, common with bot frameworks.
Browser and Device Risk – Highlights mismatches or anomalies in user-agent or device attributes that deviate from typical user patterns.
Each behavior highlights a different technique bots may use to interact with your applications.
Top Threat Types (Pie Chart)
This pie chart summarizes the total distribution of each threat type for easy comparison.
Top Bot Subcategories Distribution
Here, bot activity is categorized based on its likely intent, including:
News Aggregator — Bots that collect headlines, summaries, or full articles from news websites for aggregation platforms.
Media or Entertainment Search — Bots scanning for movie listings, celebrity profiles, or media metadata on entertainment-focused sites.
WebArchiver — Bots used by internet archive services to store snapshots of web pages.
Search Bots — Bots that simulate search engine behavior, either legitimate (for example, Googlebot) or spoofed.
cURL — A command-line tool commonly used to make HTTP requests for scripting, automation, or testing. While it is often used in legitimate workflows, high-frequency or unusual cURL traffic can signify scripted abuse or automated scanning activity.
Top Bot Subcategories (Pie Chart)
A complementary pie chart shows the overall traffic share of each bot subcategory.
How to Use This Section
Use this section to:
Identify the most common bot behaviors targeting your system.
Detect shifts in bot intent, such as a move from scraping to login attempts.
Prioritize protections based on the dominant types and subcategories observed.
Investigate new or unusual threat types as they appear.
Categorized Bots and Threat Sources
This section focuses on identifying specific known bots and tracing the sources of bot-related traffic.
Top Traceable Categorized Bots Distribution
This chart shows traffic volumes associated with known bots, including:
Google Live Results – Fetches content dynamically for Google Search result previews and featured snippets.
GoogleWebSnippetBot – Used by Google to generate previews and summaries for shared URLs.
BNEBot – A lesser-known bot type, typically seen performing exploratory or metadata scraping tasks.
GoogleBot – The main web crawling bot used by Google Search to index websites.
cURL – Command-line tool often used in scripts or automation for making HTTP requests.
Top Traceable Categorized Bots (Pie Chart)
Summarizes the contribution of each bot to the total observed automated traffic.
Top Threat Sources by IP
Lists the individual IP addresses responsible for the highest volumes of suspicious traffic.
Top Threat Sources by Country
Shows the geographic distribution of bot-originated requests.
Top Threat Sources by IP Org & ASN
Maps bot traffic to IP owners and their Autonomous System Numbers (ASNs), providing more context about the networks involved.
.png)
How to Use This Section
Use this section to:
Determine whether bots are coming from legitimate search engines or less reputable sources.
Investigate high-volume IPs for possible abuse or misbehavior.
Identify cloud providers, ISPs, or VPN services commonly used for attacks.
Consider blocking or rate-limiting by ASN or IP organization if patterns of abuse are detected.
Attack Surface Visibility and CAPTCHA Metrics
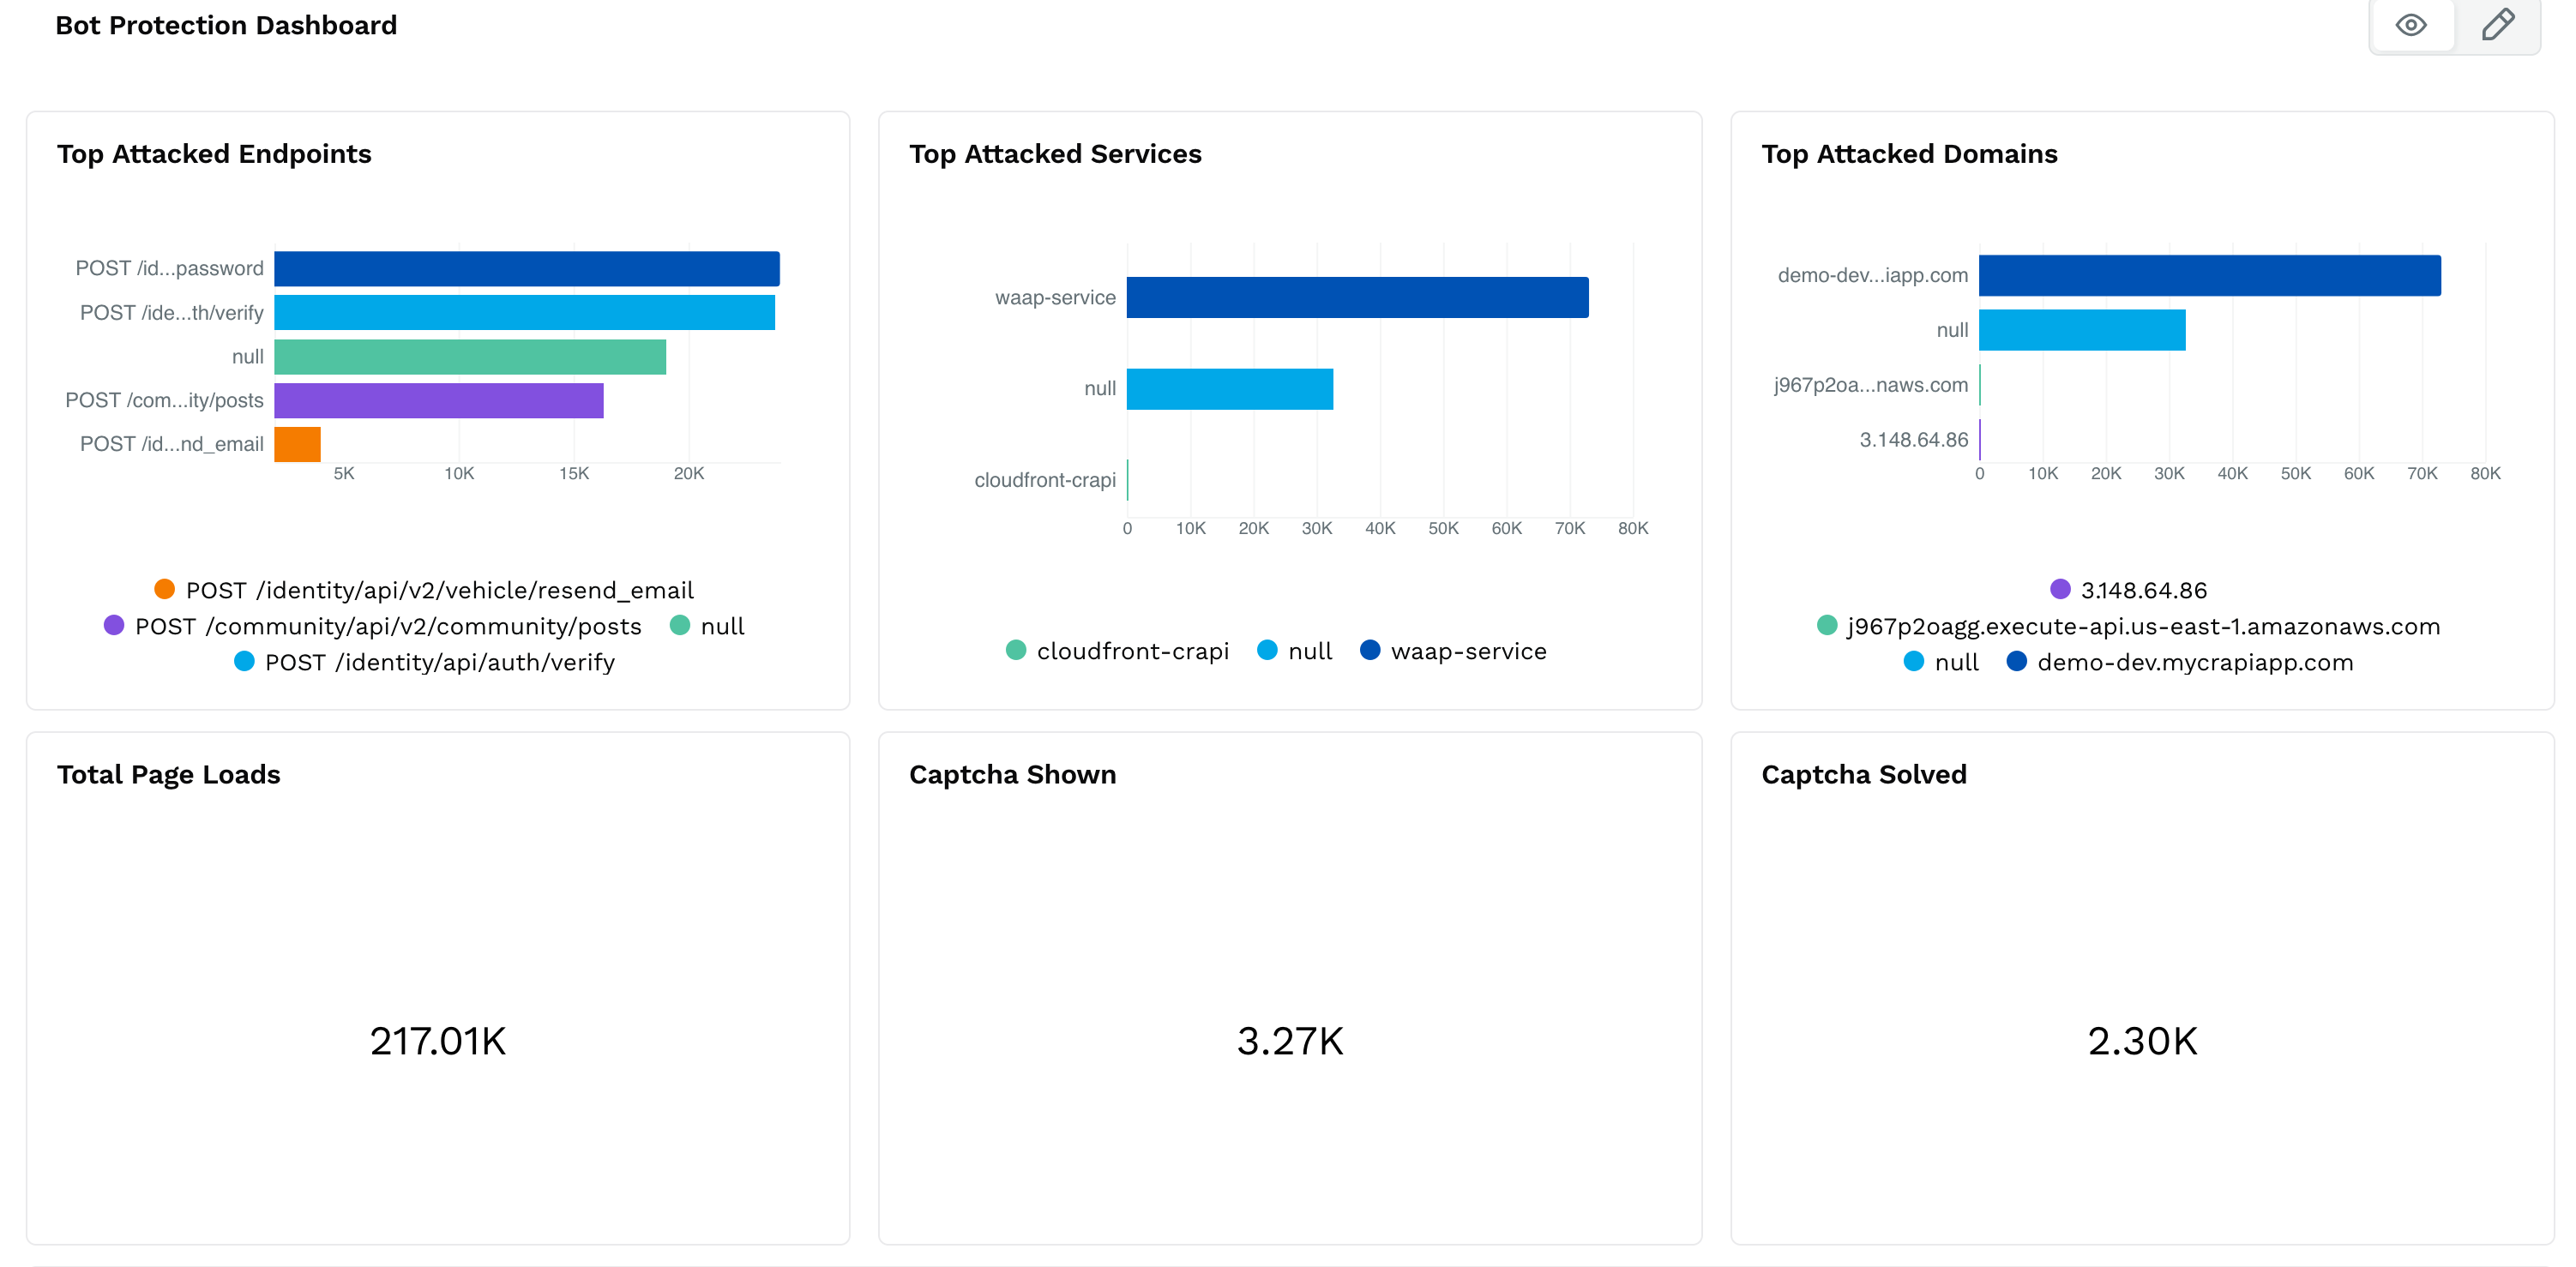
This part of the dashboard highlights which parts of your application are being targeted most heavily and provides insights into CAPTCHA challenge activity.
Top Attacked Endpoints
Lists API endpoints that receive the most bot traffic, helping you identify high-risk areas.
Top Attacked Services
Highlights backend services targeted by bot traffic.
Top Attacked Domains
Shows which domains and subdomains are being targeted, including staging and production environments.
CAPTCHA Metrics
Total Page Loads
The overall number of pages loaded across your platform.CAPTCHA Shown
Number of CAPTCHA challenges triggered.CAPTCHA Solved
Number of challenges that were successfully completed.
How to Use This Section
Use this section to:
Detect which API endpoints and services require additional protection.
Identify domains that bots are actively probing or attacking.
Analyze CAPTCHA solve rates to evaluate the effectiveness of challenges. A high solve rate may indicate that advanced bots are successfully bypassing challenges, or that legitimate users are being flagged too often, prompting a review of detection thresholds.
Ensure that legitimate users are not being excessively impacted by CAPTCHA enforcement.
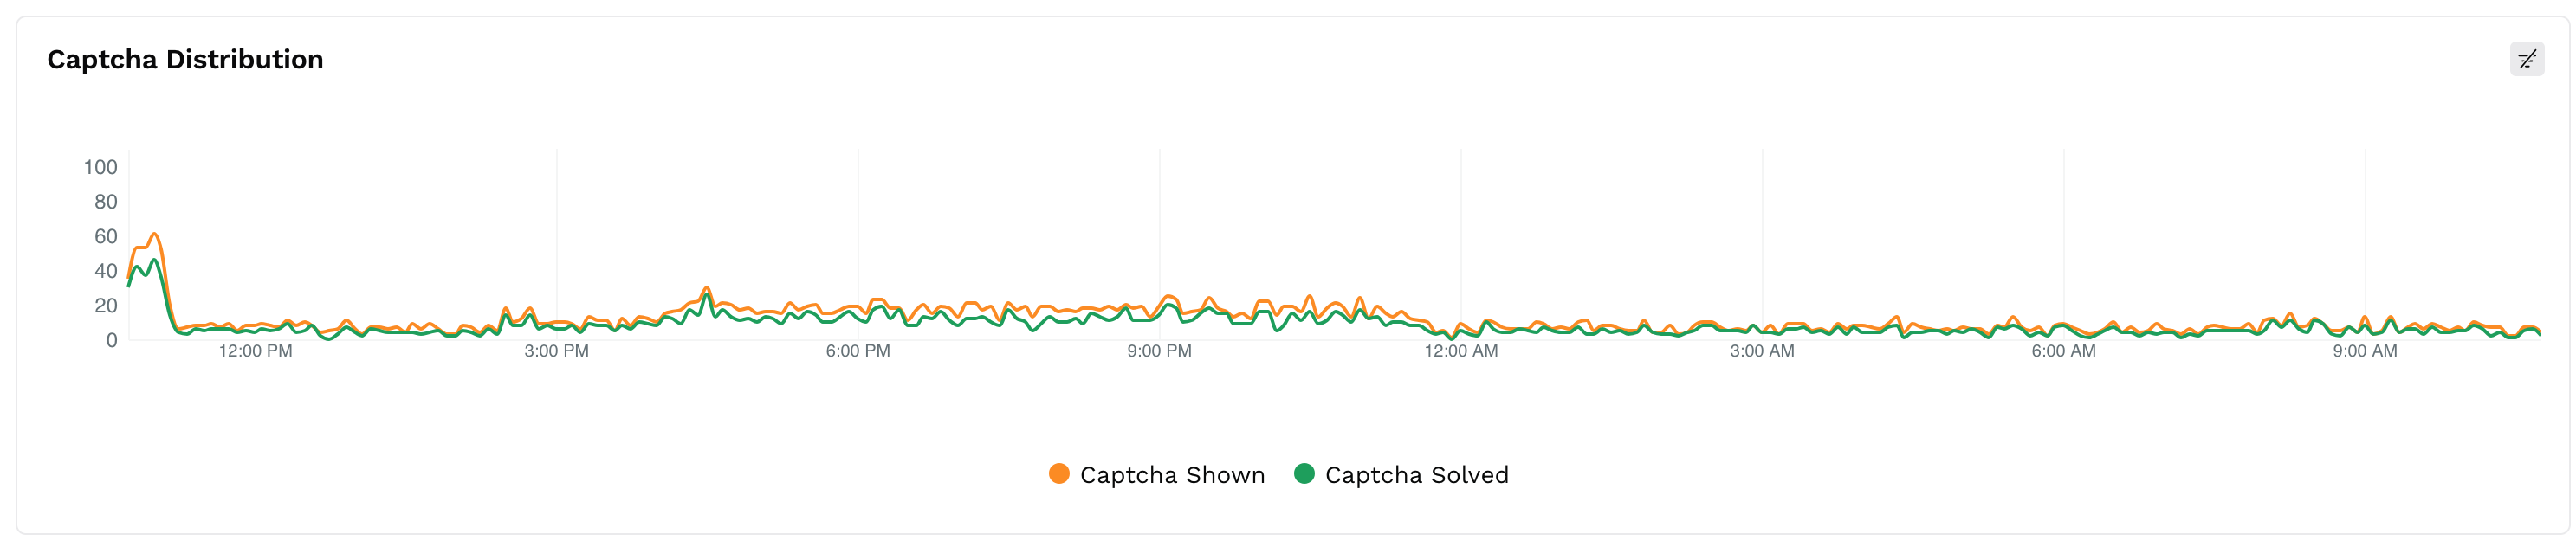
CAPTCHA Distribution Over Time
This section provides a timeline view of CAPTCHA activity, helping you understand enforcement patterns over time.
CAPTCHA Distribution
The line chart compares:
CAPTCHA Shown: Instances where users or bots were challenged.
CAPTCHA Solved: Instances where the challenge was completed successfully.
Users can toggle each line individually for better clarity.
How to Use This Section
Use this section to:
Monitor periods of high bot detection and challenge enforcement.
Detect anomalies, such as bots solving CAPTCHAs at unusual rates.
Adjust CAPTCHA settings if legitimate users are encountering unnecessary friction.
Confirm that bot mitigation measures are operating as expected during peak attack periods.
Practical Example: Investigating a Spike in Bot Activity
Here is a practical example of using the Bot Protection Dashboard to investigate a real-time incident.
Scenario
The traffic distribution chart shows a sudden increase in Blocked Threat Traffic while Total Traffic remains steady.
Step 1: Analyze Traffic Trends
You toggle off Total Traffic to focus only on threat traffic. The spike aligns with a jump in blocked requests.
Step 2: Identify the Threat Type
Switching to the Threat Types Distribution section, you find an increase in:
Bot Risk – Spike in API Call Count
Navigator Anomalies
This suggests that bots made high-frequency, automated requests that deviated from typical browser behavior.
Step 3: Find the Attack Targets
In the Top Attacked Endpoints chart, /identity/api/auth/verify and /identity/api/v2/vehicle/resend_email appear among the top targets. This indicates a potential attempt to exploit authentication or account recovery endpoints.
The Top Attacked Services section confirms that most of this traffic was handled by the waap-service.
Step 4: Trace the Source
Reviewing the Threat Sources section reveals:
Several high-volume IP addresses.
Most originating from the United States.
ASN mappings show associations with Digital Ocean and VPN service providers.
This points toward the use of hosted infrastructure and anonymization techniques.
Step 5: Validate CAPTCHA Effectiveness
Examining the CAPTCHA Distribution chart, you see a high number of challenges issued, but only a small percentage solved. This indicates that CAPTCHA was effective in filtering out the malicious traffic.
This investigation demonstrates how different sections of the Bot Protection Dashboard work together to support incident tracing, behavioral analysis, and informed mitigation based on real-time insights. By combining high-level metrics, detailed threat categorization, source tracing, and CAPTCHA performance insights, the Bot Protection Dashboard provides a comprehensive toolkit to manage evolving bot threats without compromising user experience.