Updates (April 2026 to June 2026)
April 2026 — Updated the topic to add information for the AI Assets tab.
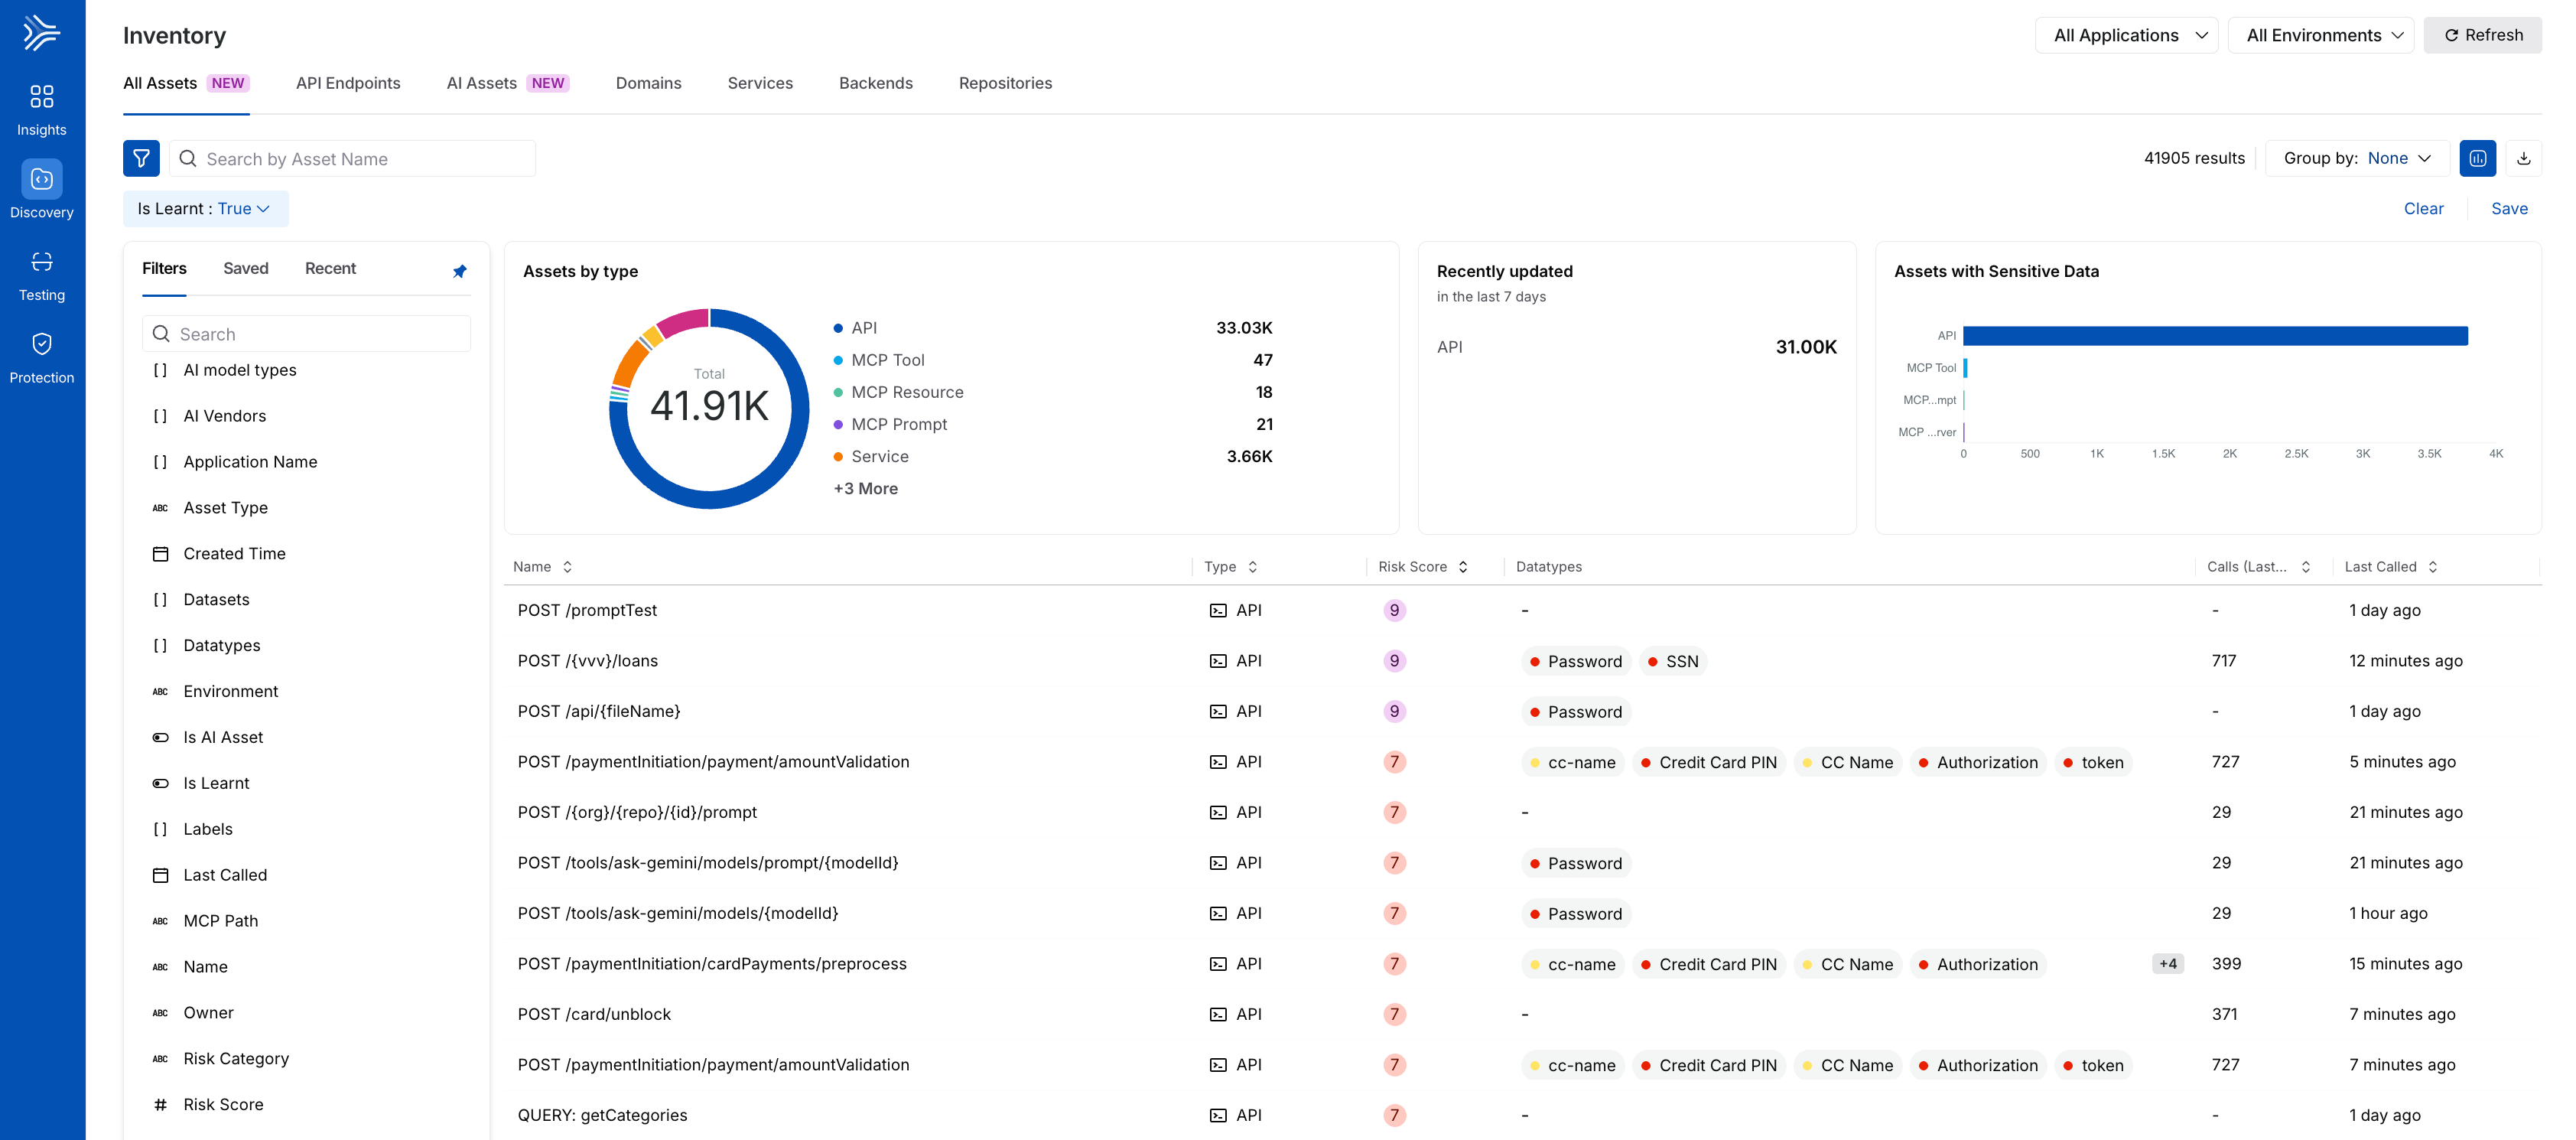
The All Assets page provides a unified and comprehensive view of all application assets, everything associated with your application. This page consolidates API Endpoints, AI APIs, MCP tools, MCP servers, MCP resources, MCP prompts, Domains, Services, Backends, and other components into a single page. It provides a centralized inventory of all components associated with your application, enabling easier monitoring, management, and security assessment.
All Assets
What will you learn in this topic?
By the end of this topic, you will be able to understand:
The data displayed on the All Assets page.
How to navigate the widgets, table, and asset details.
How to use the data to reduce risk, improve your application’s security posture.
An example of how to leverage the AI assets displayed on the page.
Understanding the All Assets view
The All Assets page helps you understand all components of your application, including AI assets. At the top of the page, Traceable displays multiple widgets. These widgets help you understand information such as the number of assets currently deployed and whether any unmanaged assets require your attention.
Note
While Traceable displays the details on the page for All Environments by default, you can click the Environments drop-down in the page’s top right corner and select the Environment according to your requirements.
Traceable displays the following widgets on the page:
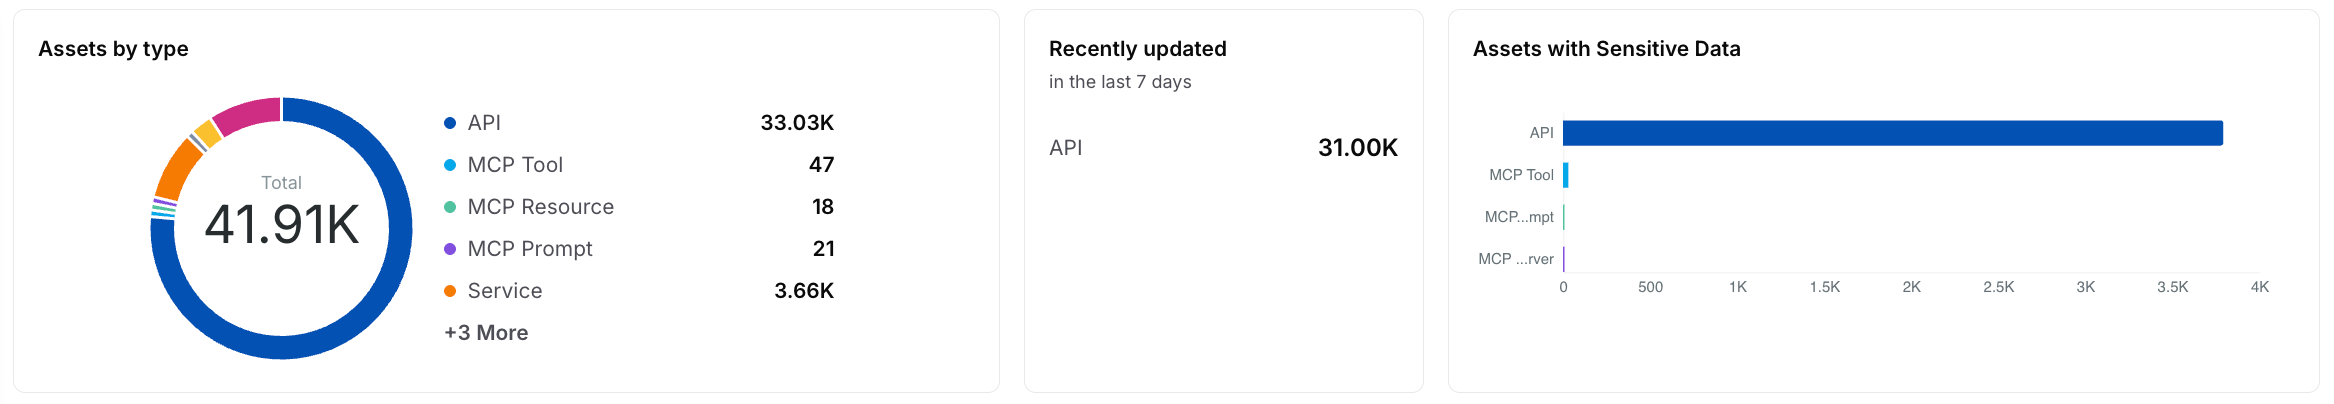
Widgets on the All Assets page
Assets by type — This widget provides metrics for your application, presented in a donut chart displaying the number of AI APIs, MCP tools, MCP resources, and MCP servers.
Recently updated — This widget provides metrics for assets, broken down in a table chart with details, such as the number of APIs, MCP tools, and backends updated in the past seven days.
Assets with Sensitive Data — This widget provides metrics for assets, displayed in a bar chart with details, such as the top three asset types with sensitive data flowing through them.
The page also displays an All Assets table that highlights key details, including the asset name, type, risk score (if applicable), and sensitive datatypes flowing through it.
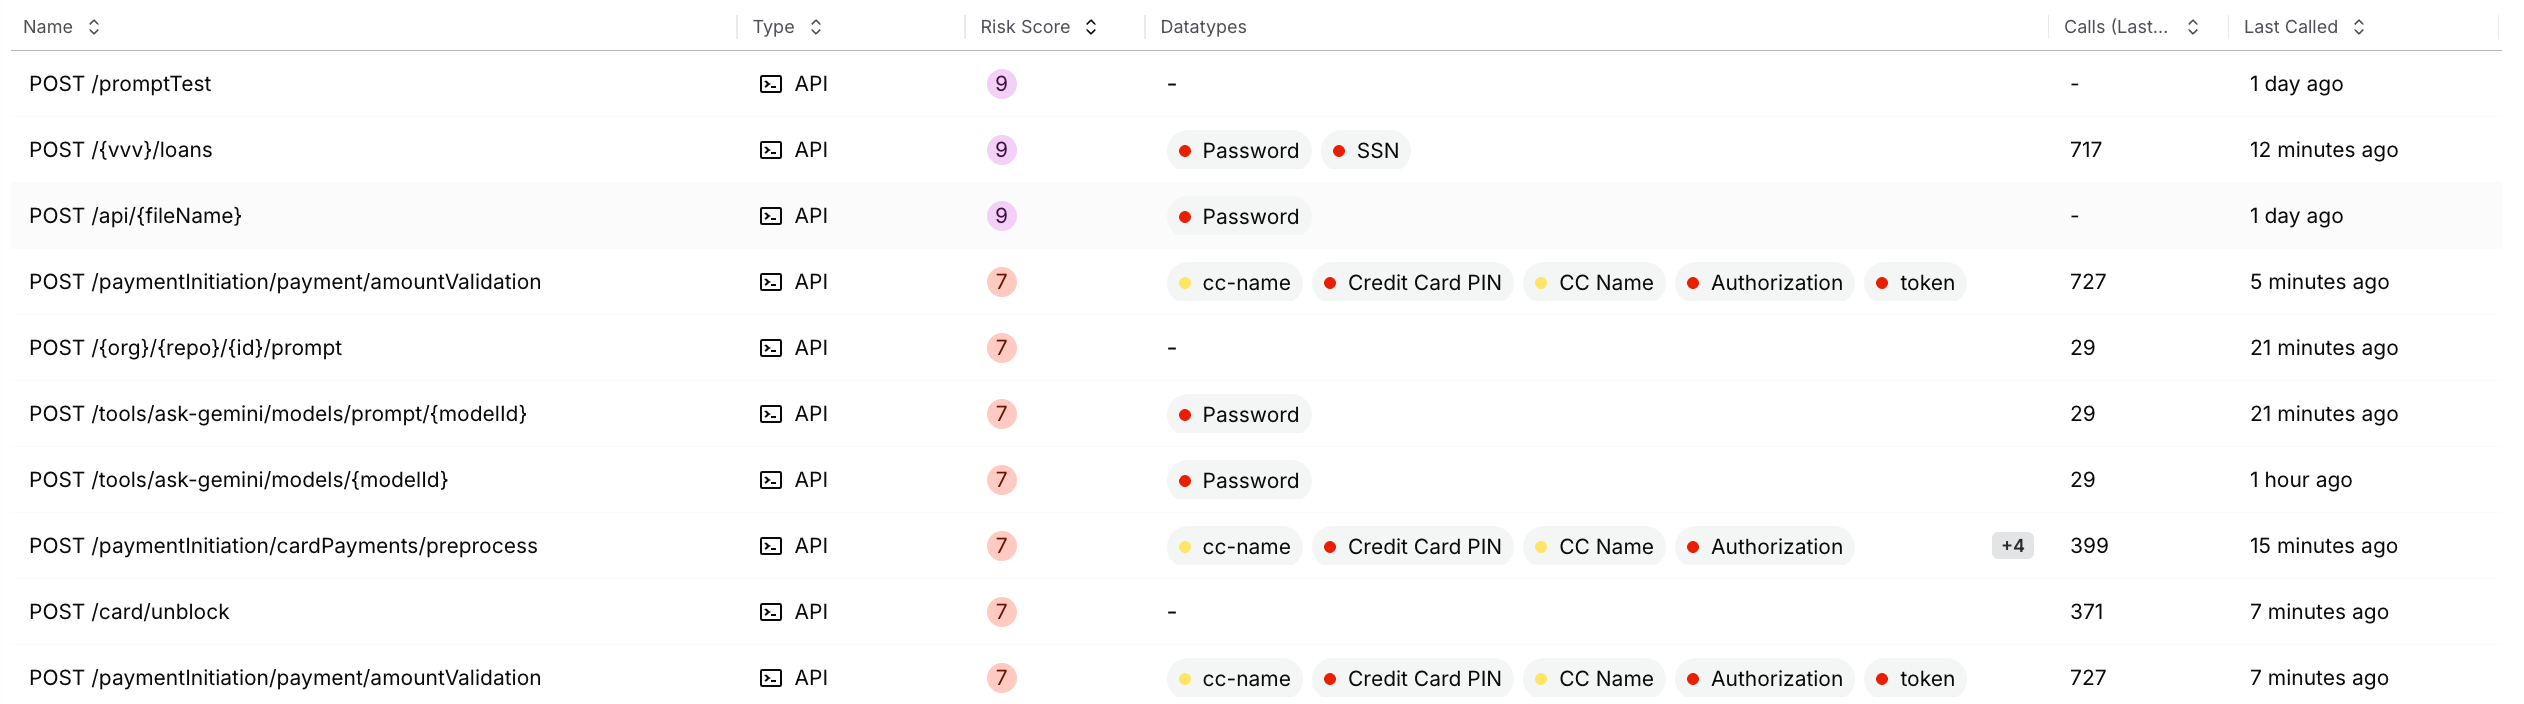
Table on the All Assets page
You can click a specific asset to access deeper insights, including metadata, security posture, spans, and its schema. This helps you understand the following:
The scale of your application and its composition
The relationship between the components
Identify whether an asset is healthy, at risk, or redundant
While Traceable displays all assets on the page, you can view AI assets and their details in the AI Assets tab. For more information, see AI Assets and AI Asset Details.
Leveraging the All Assets view
Once you understand the assets visible on the page, you can use this information according to your requirements. You can do this in the following manner:
Filtering strategically
You can use the filters to narrow down the view to what matters most to you. For example, filter by the following:
Is AI Asset to view the list of AI assets.
Last Called to view unused assets that may be increasing unnecessary costs or prone to attacks.
You can do this by clicking the Filter (![]() ) icon in the page’s top left corner, and selecting the attribute you wish to narrow the data on.
) icon in the page’s top left corner, and selecting the attribute you wish to narrow the data on.
Group for insights
You can group assets by labels or owners to reveal patterns. For example, grouping by labels highlights whether specific assets are production-related and require your attention.
You can do this by clicking the Group by drop-down in the page’s top right corner and selecting the attribute you wish to group by.
Take necessary actions
Once you have the necessary data according to your requirements, you can carry out the following actions:
Reduce risk — Identify assets with issues, such as no authentication, and prioritize them for remediation.
Optimize operations — Identify redundant or inactive assets and decommission them.
Audit assets — Download the asset list for offline audit and analysis.
Plan for growth — Use the downloaded list to identify asset counts, activity trends, and plan for future infrastructure requirements.
Example — leveraging AI assets
Suppose your monitoring system flags that an MCP server in your Production environment is facing downtime. On the All Assets page, filter by Asset Type to view MCP servers. This view helps you identify the affected MCP server, the associated MCP tools, and the dependent applications. With this insight, you can alert your teams, prioritize restoration efforts, and assess whether you need to activate redundant tools or backup servers.
This way, the All Assets page helps you assess the downstream impact of infrastructure issues and make informed decisions, ensuring reliability, uptime, visibility, and control across your application environment.